Evaluation of 3 methods to determine impact of small Best Management Practices on Peters Brook, Somerville, NJ
|
|
|
- Britney Riley
- 5 years ago
- Views:
Transcription
1 Evaluation of 3 methods to determine impact of small Best Management Practices on Peters Brook, Somerville, NJ Presented by Pat Rector Rutgers Cooperative Extension Co-authors: Robert O Neil, Planner, Principal Environmental Specialist, New Jersey Water Supply Authority Ken Klipstein, Director Watershed Protection Program New Jersey Water Supply Authority Dr. Chris Obropta, Water Resource Specialist, Rutgers University Heather Barrett, Environmental Specialist, New Jersey Water Supply Authority Ben Pearson, Rutgers University

2 Outline Peters Brook Watershed Rain fall and Rain Barrels Biological monitoring to date and future Flow monitoring: problems encountered and progress Modeling scenarios


3

4 NJDEP developed TMDL for fecal coliform, which requires a 98% reduction for Peters Brook. Identifies primary source of bacterial contamination as suburban stormwater Implementation plan identifies implementation of the Phase II rules as the Specific measure to address the impairment
5 % of storm days/year During a 1-inch rainfall event an 88 ft 2 roof section will fill a 55-gallon barrel Average roof size in Peters Brook watershed is 1500 ft2, therefore estimated average drainage to 1 barrel = 375 ft % of storm days versus average precipitation Average precipitation range (inches) With this information we know what we are shooting for: 1 rain barrel at each downspout will capture 41% of annual roof runoff on a residential property. To capture the roof runoff from the 0.5-in storm we would need 8+ barrels or 4 at each downspout, each directed to pervious surfaces. Data courtesy NJ State Climatologist, Rutgers State University. Data observations Somerville, NJ.
6 Ninety-eight people were trained and brought home rain barrels. Of these participants 42% were from the targeted neighborhoods and 76% were from the Peters Brook watershed. A minimum of 75 rain barrels were distributed in the watershed. Several families took home more than 1 barrel. The number of Class II properties (residential) in the Peters Brook watershed is 5,769. Therefore we have distributed rain barrels to a minimum of 1.3% of the residential properties with a potential to disconnect up to 41% of roof runoff annually from 1.3% of the Peters Brook watershed, plus the first flush from the 0.5-inch storm


7 What are we doing? Installation rates preliminary survey results Respondent in the watershed installed Respondents in the "neighborhood" that installed
8 Total Suspended Solids (TSS) mg/ L Water Quality Sampling Total suspended solids data summer 2010 baseline sampling Walck Park /17/2010 6/24/2010 7/1/2010 7/8/2010 7/15/2010 7/22/2010 7/29/2010 8/5/2010 8/12/2010 Sampling dates 8/19/2010 8/26/2010 9/2/2010 9/9/2010 9/16/2010 TSS


9 STEP-L Reductions from installations of urban BMPs

10 Goals/Objectives How can an organization document an improvement in water quality in a stream due to the implementation of small Best Management Practices, such as Rain Gardens or Rain Barrels in a reasonably cost-efficient and expedient manner?
11 Total phosphorus concentrations (mg/l) Water Quality Sampling Total phosphorus data summer 2010 baseline sampling Walck Park /17/2010 6/24/2010 7/1/2010 7/8/2010 7/15/2010 7/22/2010 7/29/2010 8/5/2010 8/12/2010 Sampling dates 8/19/2010 8/26/2010 9/2/2010 9/9/2010 9/16/2010


12 Following the stormwater

13 Biological Monitoring Field Assessment Walck Park August 4, 2010 flatw orms Net spinning caddisfly caddisfly scuds midge Riffle beetles aquatic w orm dragonfly Metrics NJDEP Fast Score would be 19 for a Good. EPA Rapid Bioassessment Score would be Moderately impaired w ater snipe/ dance fly (tw o pointed ends, no prolegs Dominance of flatworms would indicate organic and/or nutrient enrichment. (Voshell, Jr. 2002)
14 Biological Over the fall/early winter will continue to evaluate the macroinvertebrate data we have collected to greater taxonomic detail. Greater taxonomic detail requires greater time and expense. Until significant improvement in nonpoint source pollution and flow has been made there may not be a change in the community structure. Annual sampling to the detail already completed may be well worth the time/effort/cost for the results obtained. Results will not provide documentation, only general watershed health. This ultimately is one of the highest criterion Estimated costs: kick nets, waders, taxonomy books, microscope, assorted trays, sampling equipment- $3,000. Staff time. After training. 2 day/site/year


15 Flow Monitoring
16 Nice sunny day in July Left Bank Edge Dista nce (ft) Width interv al (ft) Depth (ft) Area (ft) Velocity (ft/s) Cell flow (cf/s) Percent total flow Q total 0.264


17 Measuring Flow

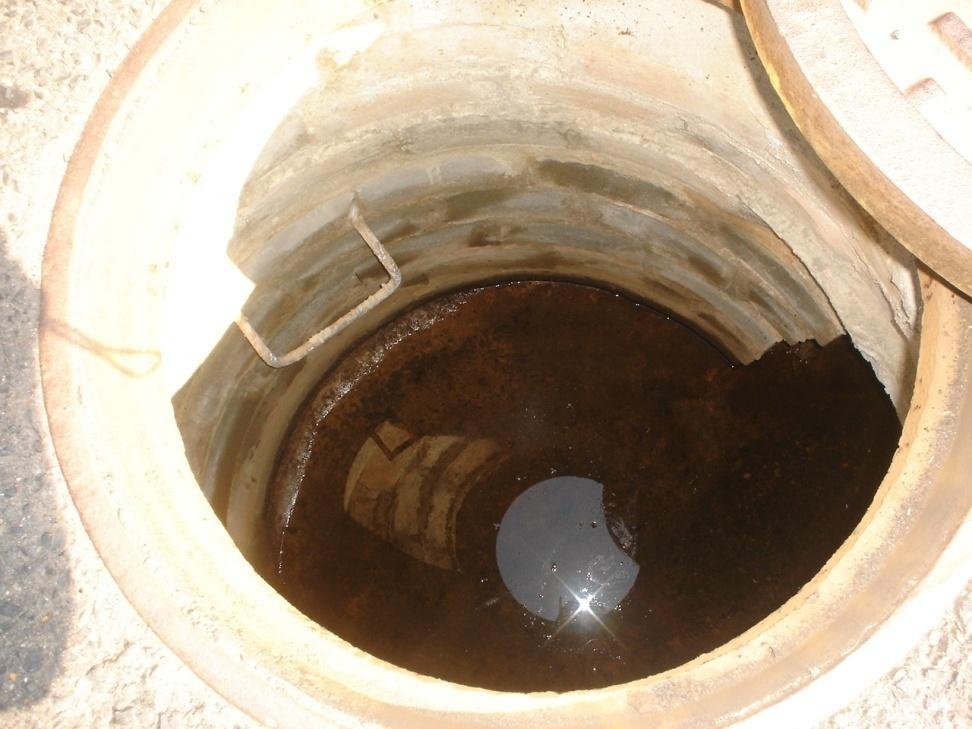
18 Measuring Flow

19 Measuring Flow
20 Flow The Stingray will be installed this week due to delays. This project will continue after the grant expires. We will be looking at flow for rain events of similar amount/duration for when barrels are in operation to compare to when they are off-line. We will be unable to account for other events that add/detract flow to the storm system lines. This will provide only a surrogate for water quality. In a larger system this would not be a reliable method. Annual sampling to this level of detail may be well worth the time/effort/cost for the results obtained. Results will provide documentation on a small watershed basis. Estimated costs: Flow Meter & data logger with attachment band $7,000. Staff to install (including staff that is certified for enclosed space training) $500. Staff to take readings 1/month = $3,000/yr

21 Ross Brook Watershed Ross Brook feeds Peters Brook in Somerville, NJ Drainage area is approximately 230 acres Study area (#14) is located in Lower Watershed Sub catchments based on existing stormwater infrastructure Overall, mainly impervious and directly connected

22 Area of Interest Ross and Peter Brook are impacted by stream bank erosion due to increased volumes and velocities of runoff Goals is to measure the impact of small scale residential best management practices such as rain water harvesting Installed rain barrels in outlined area to determine an impact on runoff volume Stakeholder involvement through training, installation and maintenance

23 Windows Source Loading and Management Model Allows best management practices to be modeled based on volume Can model rain harvesting, rain gardens, and porous pavements to compare volume reductions based on different best management placement

24 Model individual sub catchments to show which neighborhoods within the watershed can have the biggest impact Determine which best management practices are the most cost efficient and have the greatest volume reductions Compare three methods of measuring impacts
25 Over the fall/early winter the modeling will be completed. The model can be upgraded with the information gained through the surveys to include the actual homes that have installed the rain barrels, and whether the barrel disconnects pervious or impervious surfaces. Once the model is completed it can be run and additional barrels can be added as they are installed. Estimated costs: WinSLAMM model $1,000. Staff time to field verify and input data: $2,500. Annual input: $500.
26 Continuing on Small disconnection BMPs can have an impact on water quality in the Peters Brook watershed. The educational impact will be even greater. We believe that we can document this impact but it will need to be a multi-tiered combination of survey instruments for flow data, biological data, and modeling. We see it as one circle, with each wave feeding the other, but providing a clearer picture of the impacts of small BMPs on the Peters Brook watershed.

27 What to use and when Providing information of when specific tools might be utilized and at what cost and when they would not be a useful tool will be an important deliverable. Many organizations would like to know what is working for their own information. Knowing what is working is critical. The closer we can get to reasonably providing that information the better we serve.
28 Questions? Pat Rector Rutgers Cooperative Extension