Dredging Project Update
|
|
|
- Griffin McDonald
- 5 years ago
- Views:
Transcription

1 Dredging Project Update Fall 2009
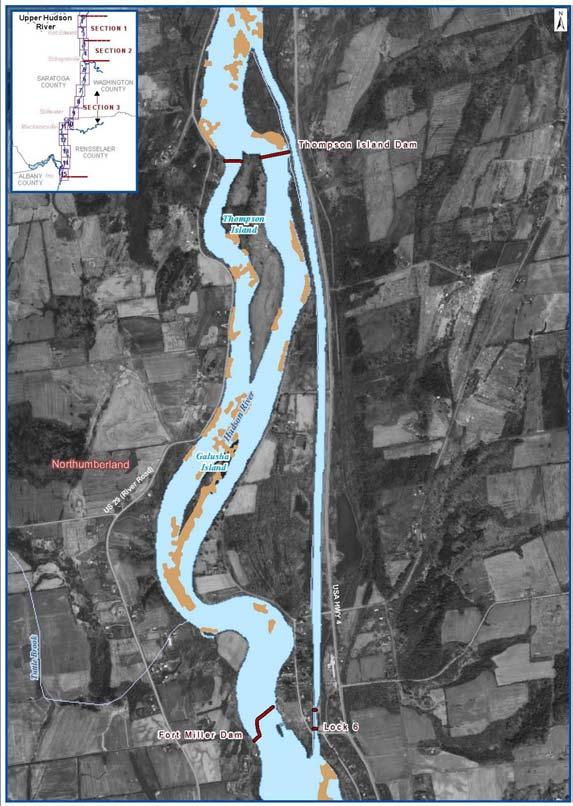
2 Hadley SARATOGA WARREN Glens Falls Thompson Is. Dam Fort Miller Dam Northumberland Dam Schuylerville WASHINGTON Falls Bakers Falls Fort Edward Section 1 Section 2 Upper Mechanicville Stillwater Section 3 RENSSELAER Cohoes Green Island Waterford Federal Dam Troy mi 10 k
3 > Dredging along 40 miles of river > Phase 1: 1 st year dredging (May - November) 2009 Test equipment/processing facility at peak performance Test of EPA s performance standards > Review of Phase 1: > Phase 2: Project Phases Independent peer review panel --- Receive public comments EPA decision on changes to project Remaining dredging
4 Phase 1 and 2 Dredge Area Delineation Based on more than 50,000 sediment samples (since 2002) sampling data allowed EPA and GE to: determine the distribution of PCBs in the sediment refine estimates of the amount and location of PCBs in the sediment establish river sediment characteristics (e.g., silt, sand, gravel) 400 acres to be dredged during Phase 2 (490 acres total) Overall typical depth 3 ft (some areas extend to 5 ft or more)
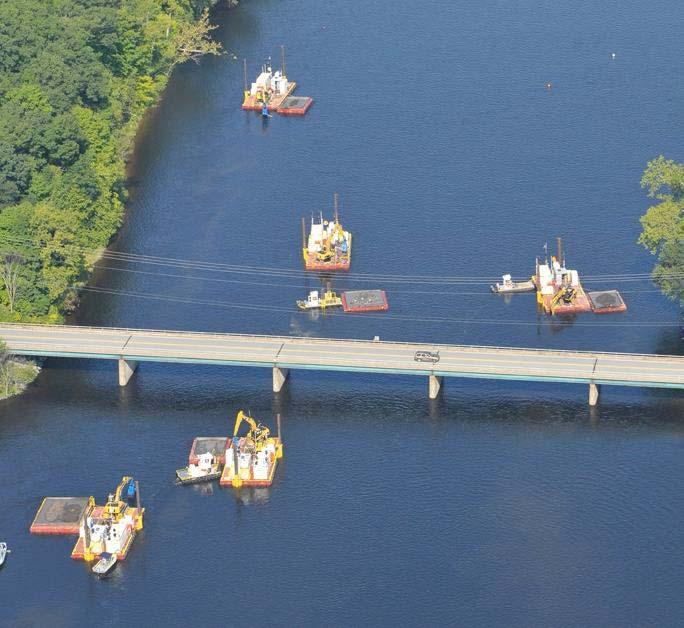
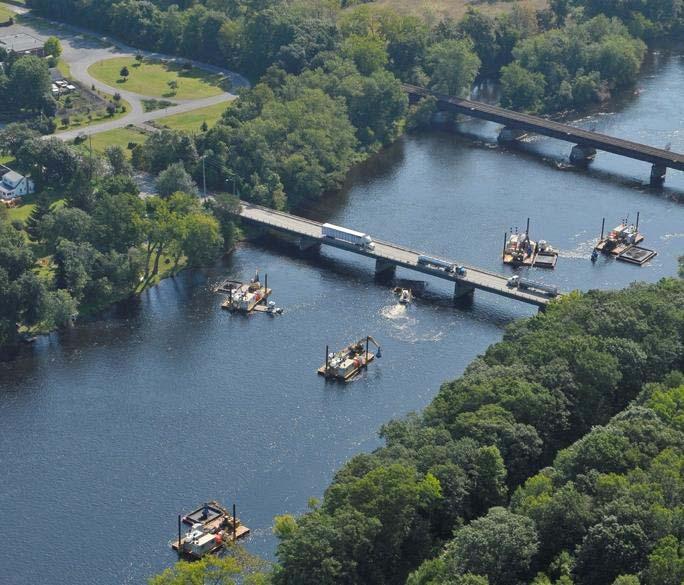
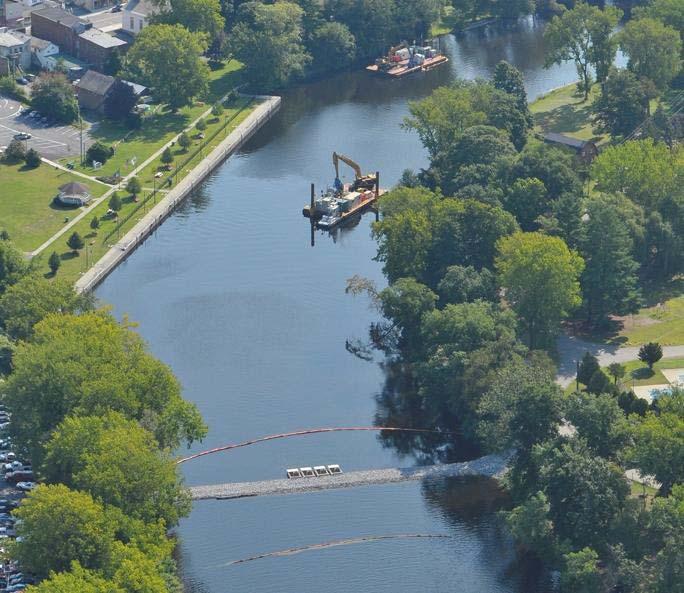
5 > May-November 2009; operate 24/6 > 245,000 cubic yards from 90 acres in Thompson Island Pool > Need 6 months to complete > Up to 12 mechanical clamshell dredges working at same time > 27 Hopper Barges >21 Tugs Phase 1 Dredging > Constant monitoring to measure performance > Backfill after dredging > Habitat replacement
6 Phase 1 Certification Units 18 Units in Phase 1 Average 5 Acres Process Inventory Dredging Hydrographic Survey PCB testing Residual Dredging Backfill or Cap
7
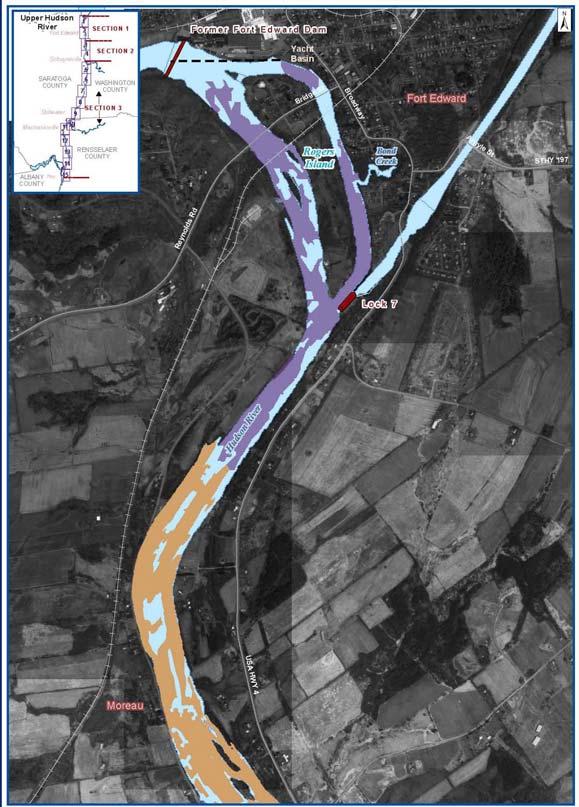
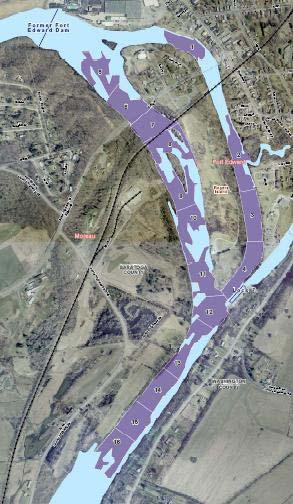
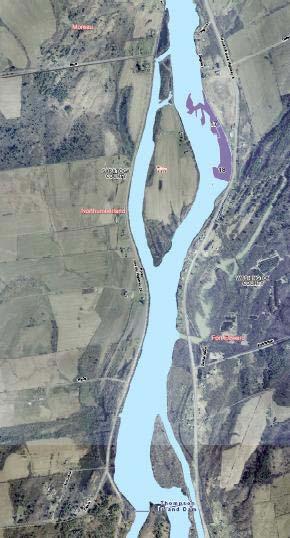
8 Map 1
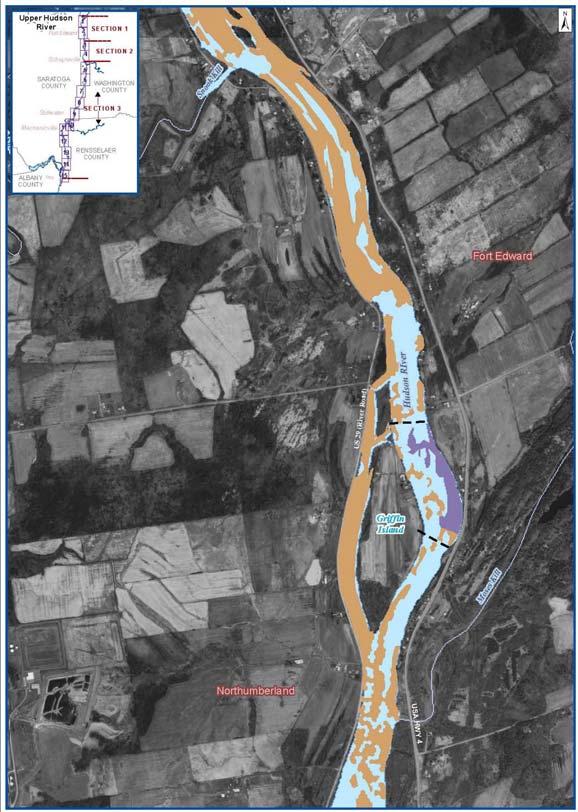
9 Map 2
10 Map 3

11 Map 4

12 Map 5

13 Map 13
14 Engineering Performance Standards Resuspension, residuals and productivity standards are included in the basis of design Design analysis includes the assessment of the ability to achieve the standards Achievement of the performance standards will be tested in Phase 1
15 Quality of Life Standards Noise Light Odor Navigation Air

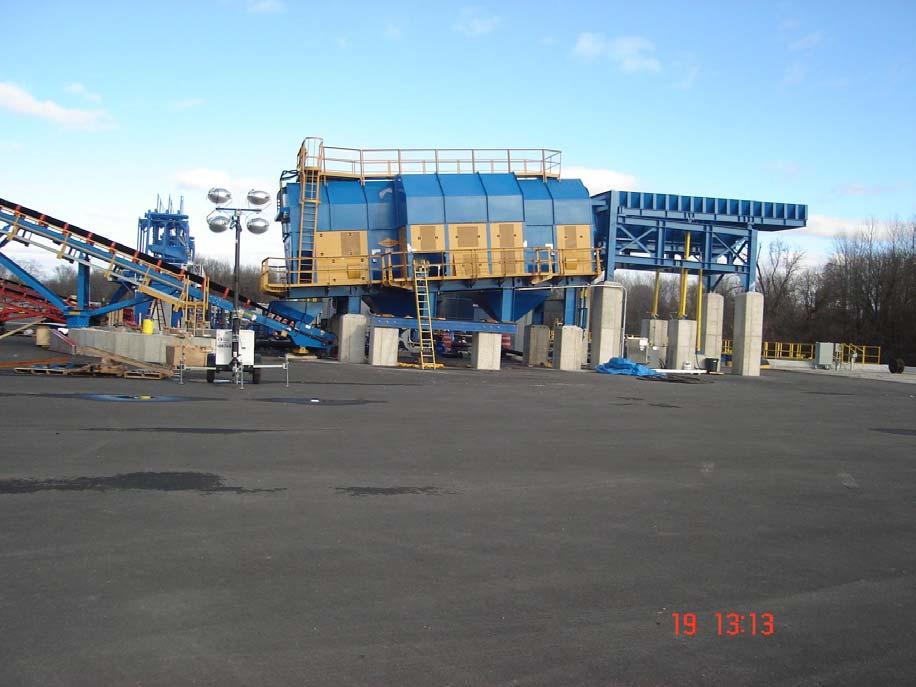
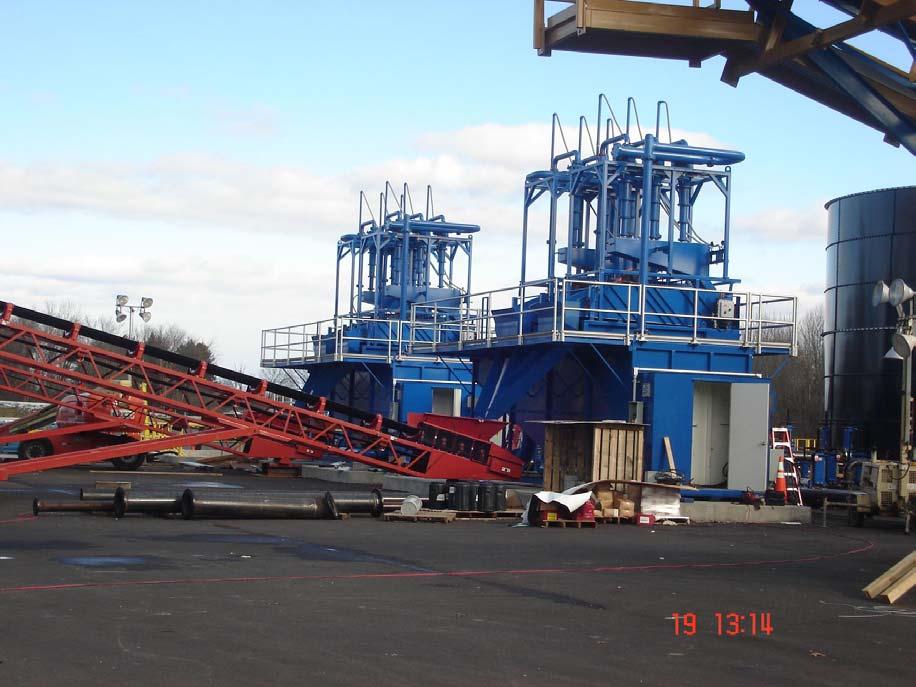
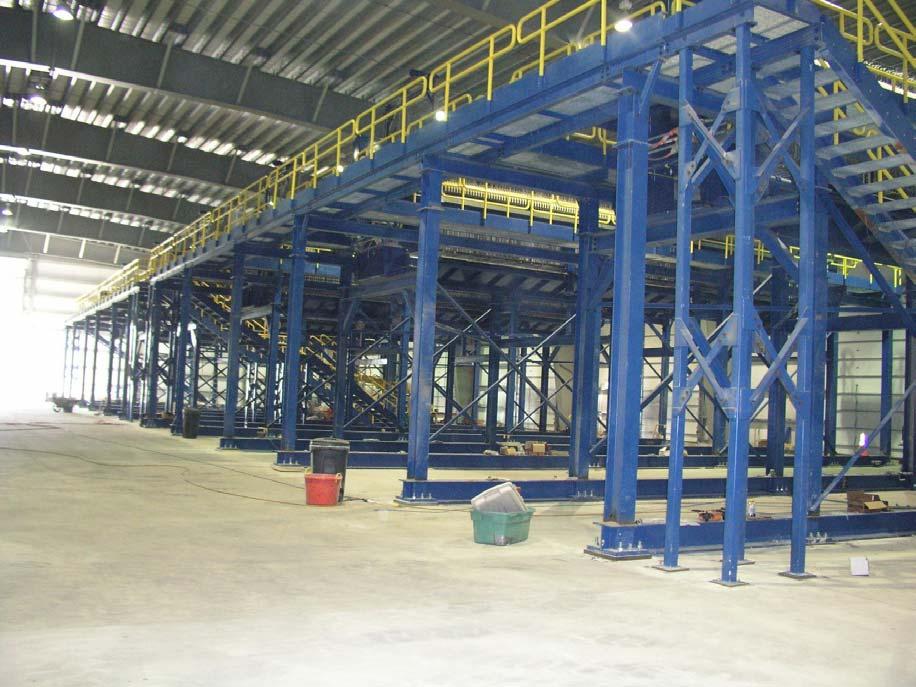
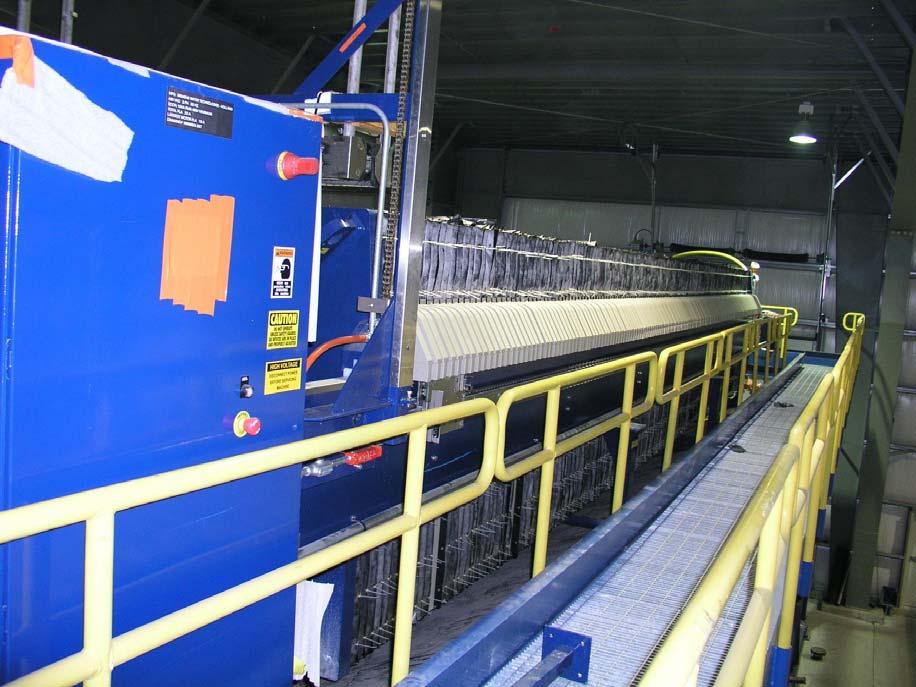
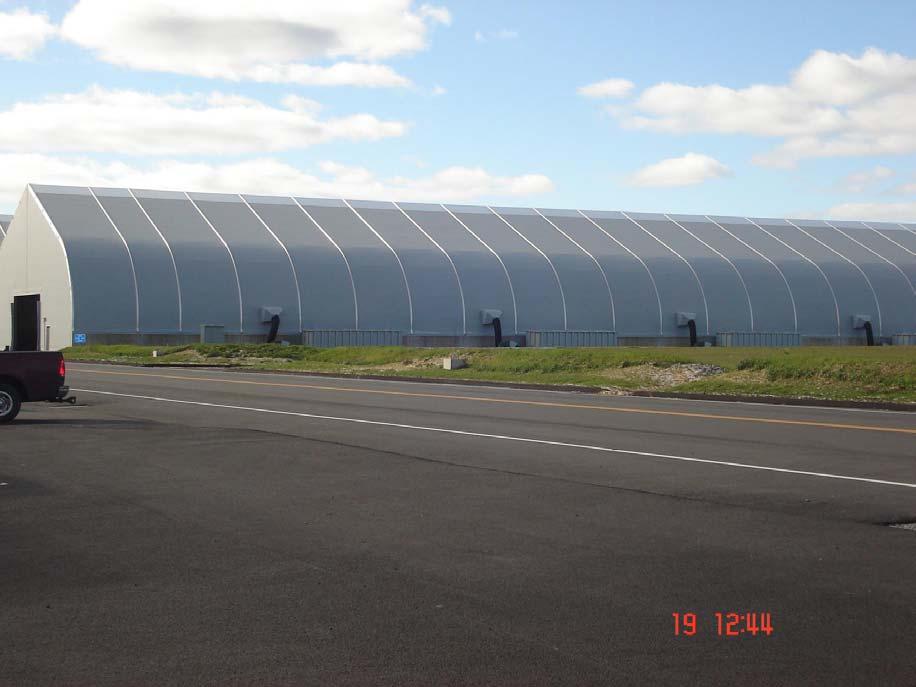
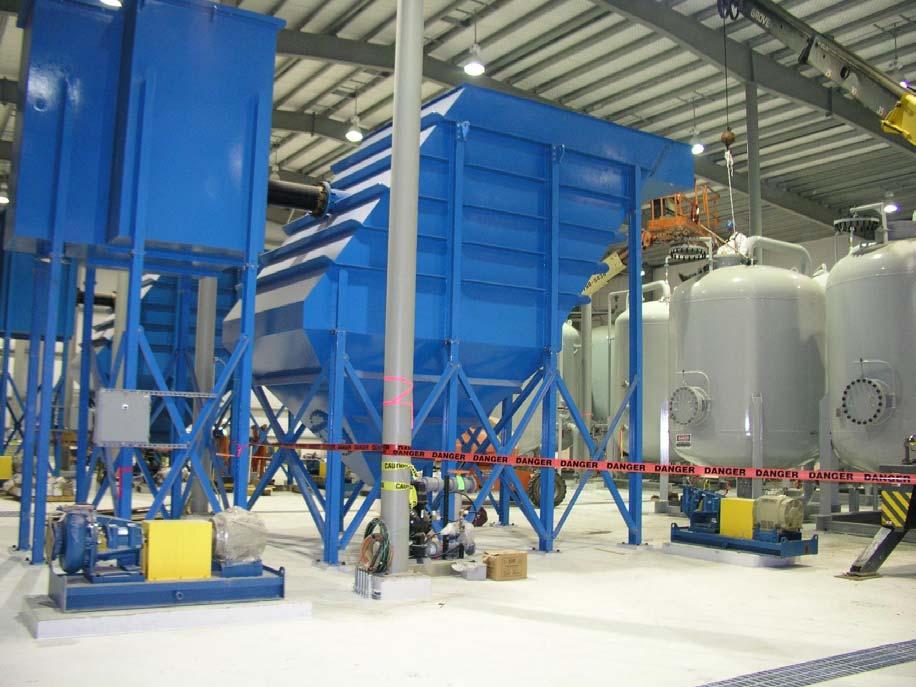
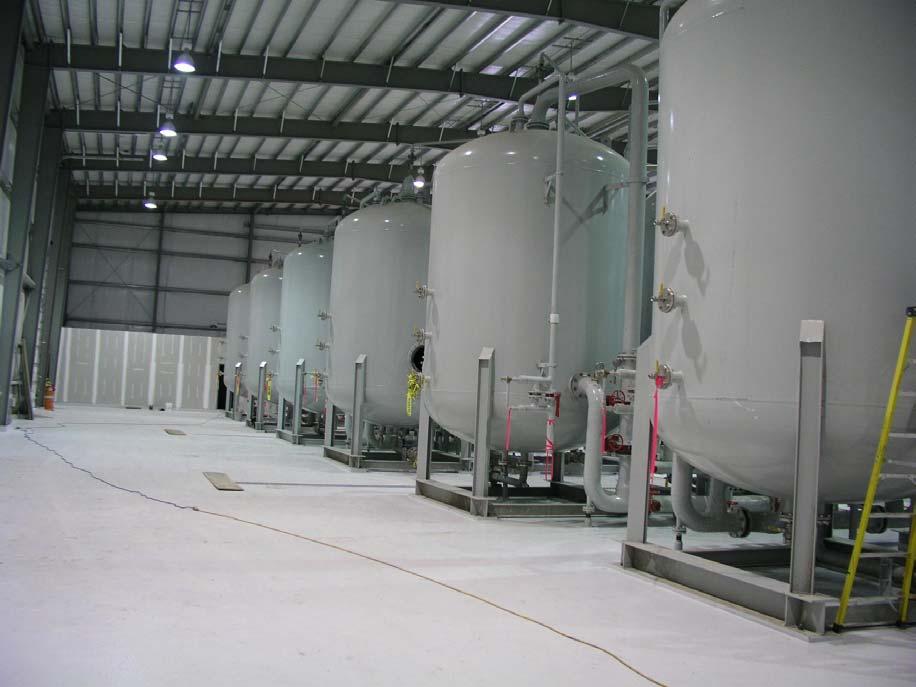
16 Dewatering Facility Operations
17

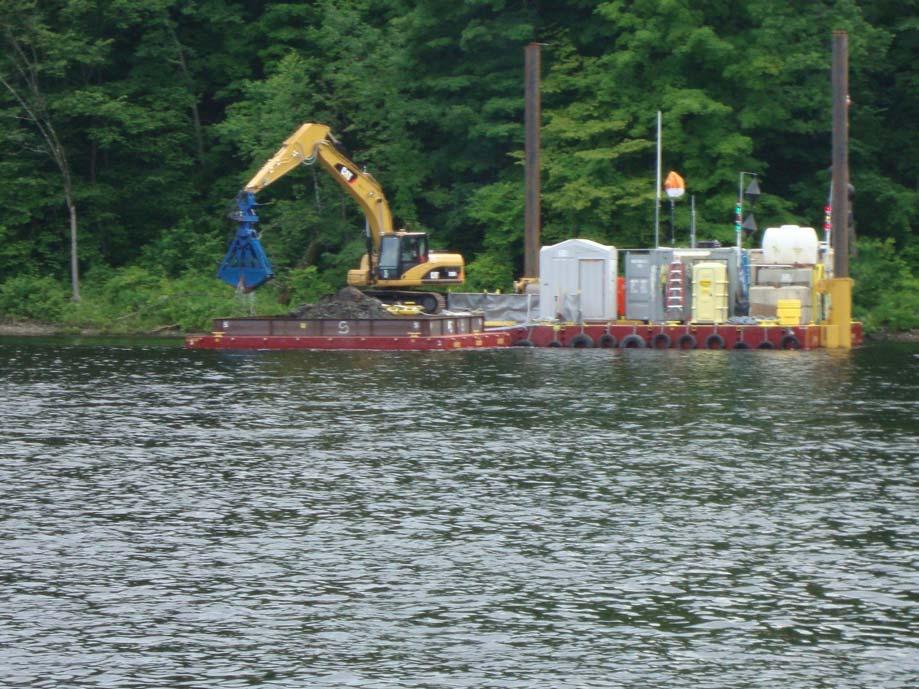
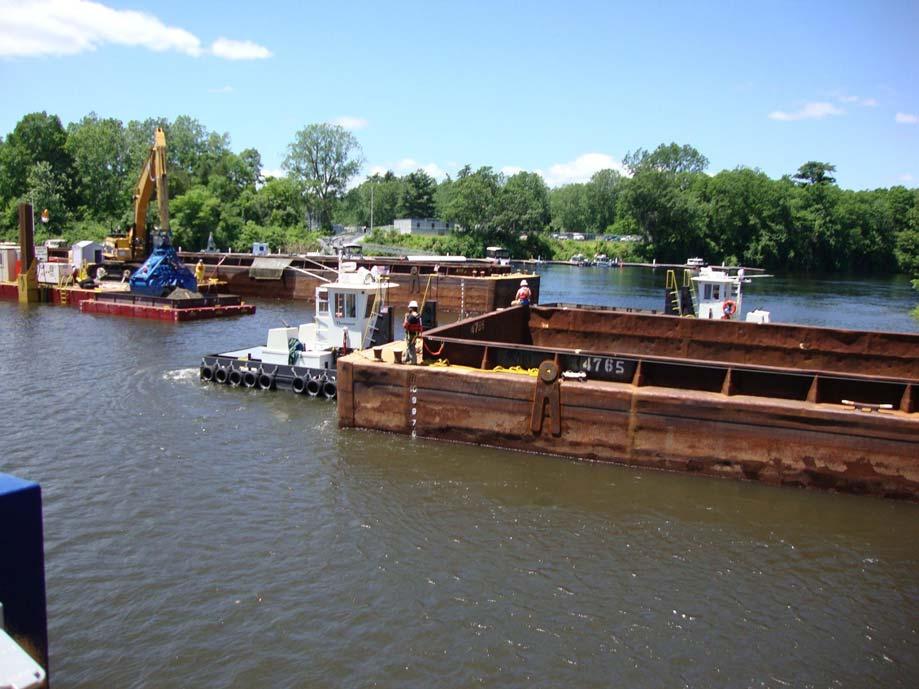
18 Dredging Project Update Unloading at processing facility
19

20
21
22
23

24
25

26
27


28 Water Treatment Plant Dewatering Plant > Handles process water and water from the stormwater basins > 25,500-square-foot building; 40-feet high > 2 million-gallon-a-day capacity
29
30
31 Water Supply Issues Waterford and Halfmoon use the river for drinking water. New water line from Troy built by EPA for alternate supply. Village of Stillwater have well field next to river. GAC treatment built and operated by EPA for Village.

32 Dredging Project Update Tree trimming


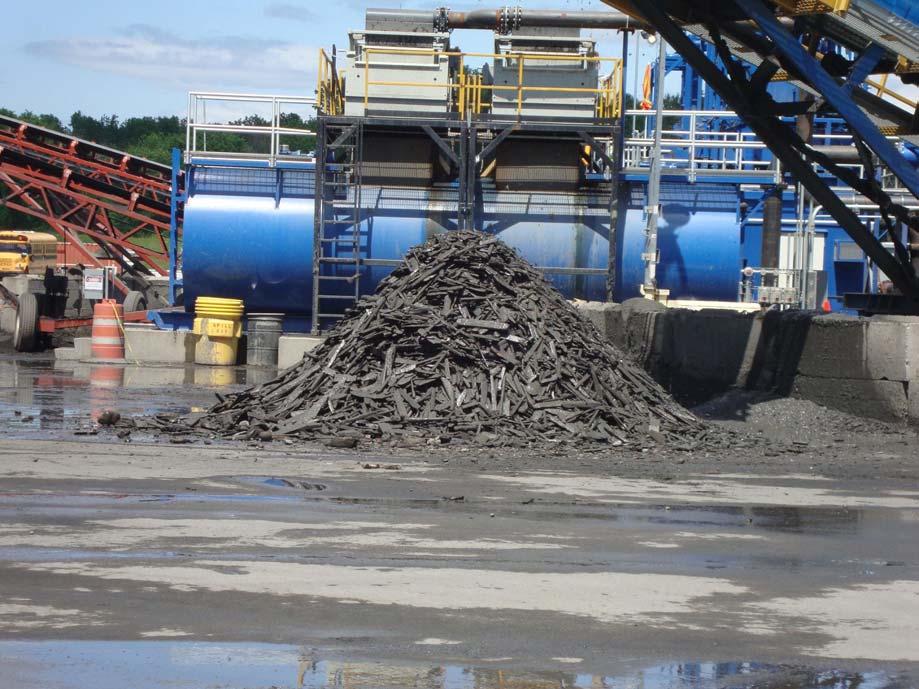
33 Dredging Project Update Debris removal
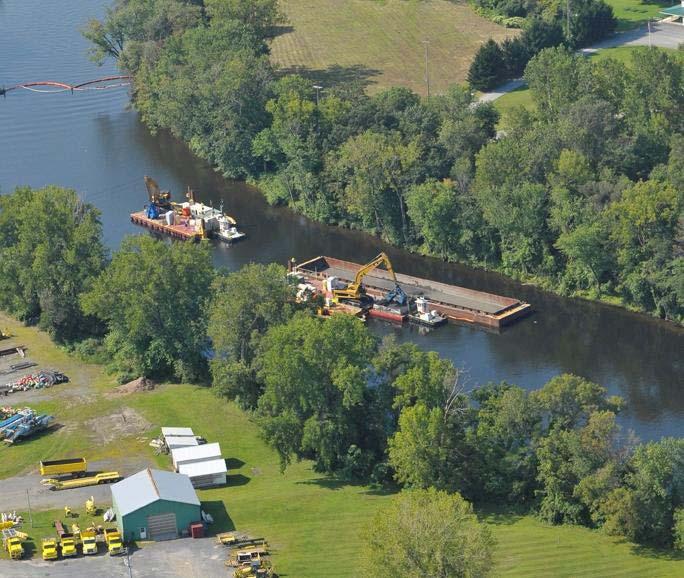
34 Dredging
35
36
37
38
39
40
41
42
43


44 Update on Phase 1 (cont) Continuing Operations Activities: Certification unit review/approval Backfilling/capping Backfilling to continue through fall season


45 Water Monitoring One standard level exceedance in August Dredging halted, contingency monitoring began Dredging resumed once monitoring results over two consecutive days were below standard level One standard level exceedance in September (not a confirmed exceedance)

46 PCB Concentrations: Far-Field Stations
47 PCB Concentration: Thompson Island
48

49 Productivity Approximately 278,000 cubic yards dredged as of October 17, 2009.
 to")

50 Load (lbs) to October 18

51 Performance Standard Monitoring Air: Approx 2,000 (24hr) samples collected since start of dredging 65 samples exceeded the standards along dredging corridor 11 samples exceeded the standards at the dewatering facility Approximately 4% of all samples exceeded the standards


52 Productivity Approximately 224,500 cubic yards dredged as of September 23, 2009.

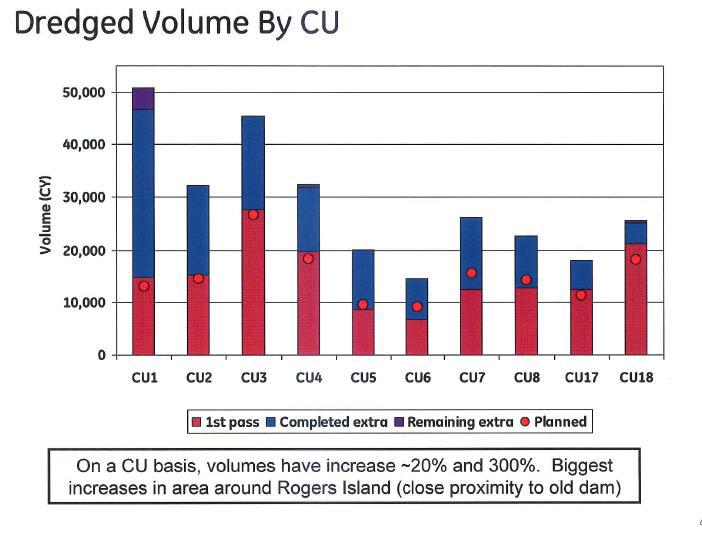
53 Progress by CU
54 Volumes To Date
55
 to expose older strata dating from")
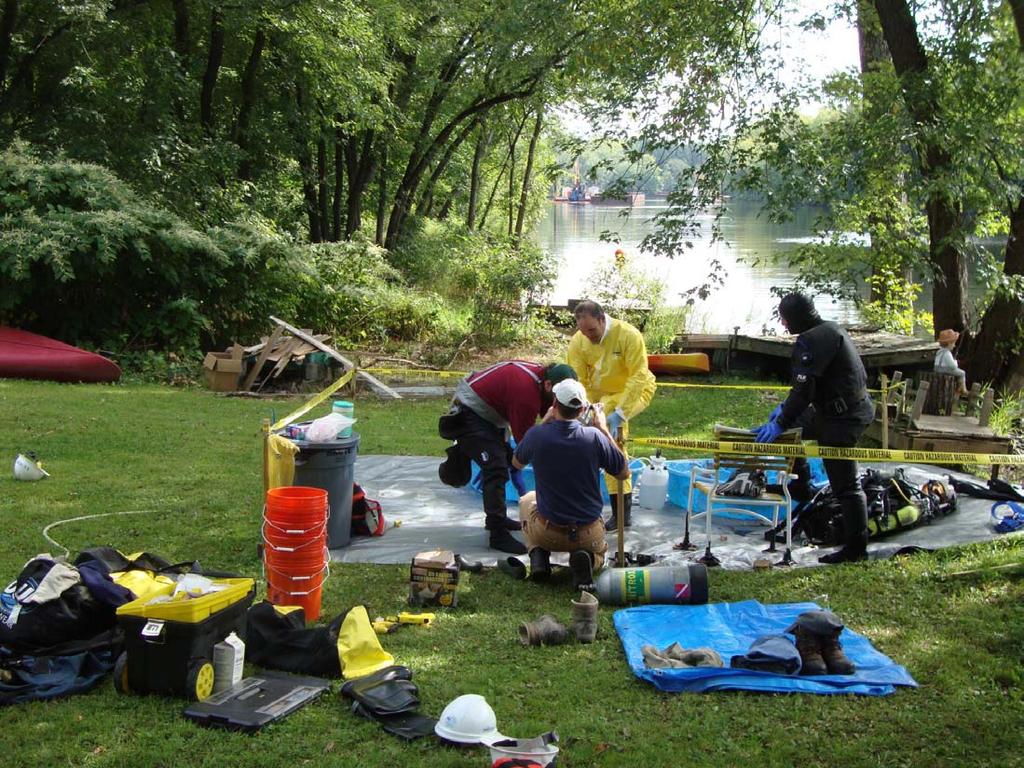
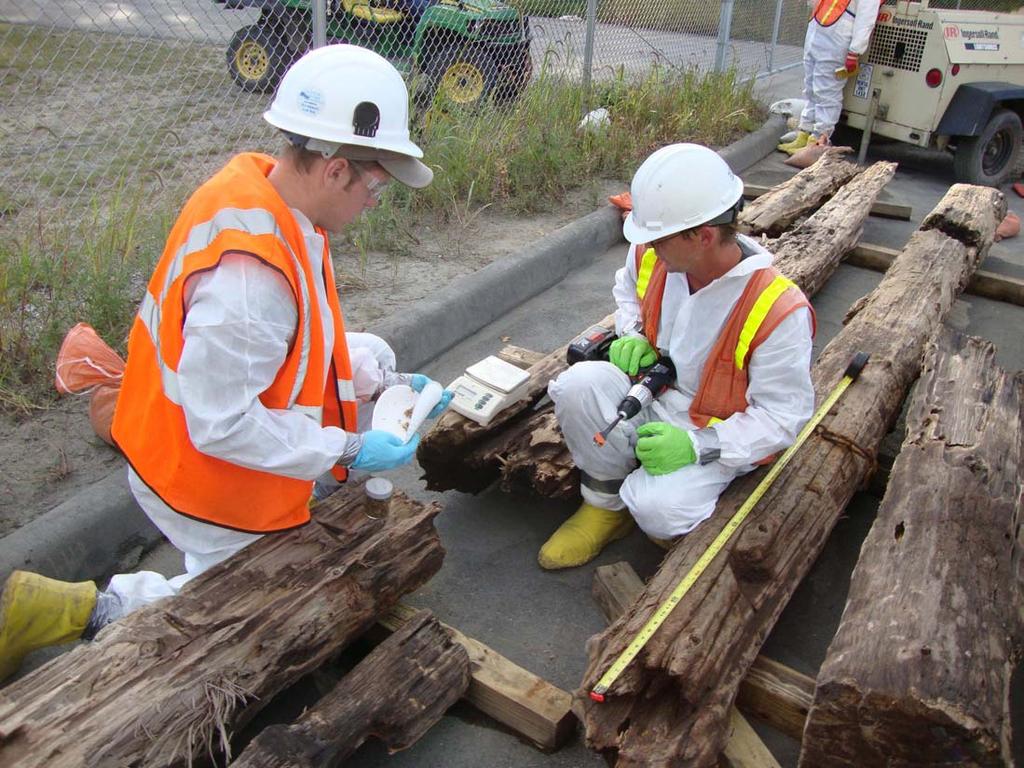
56 Archeological Investigation Archeological work is underway at the site of historic Fort Edward. Archeologists have completed underwater studies removed the upper soil layers (recent material) to expose older strata dating from the time of the occupation of the Fort.
57
58

59
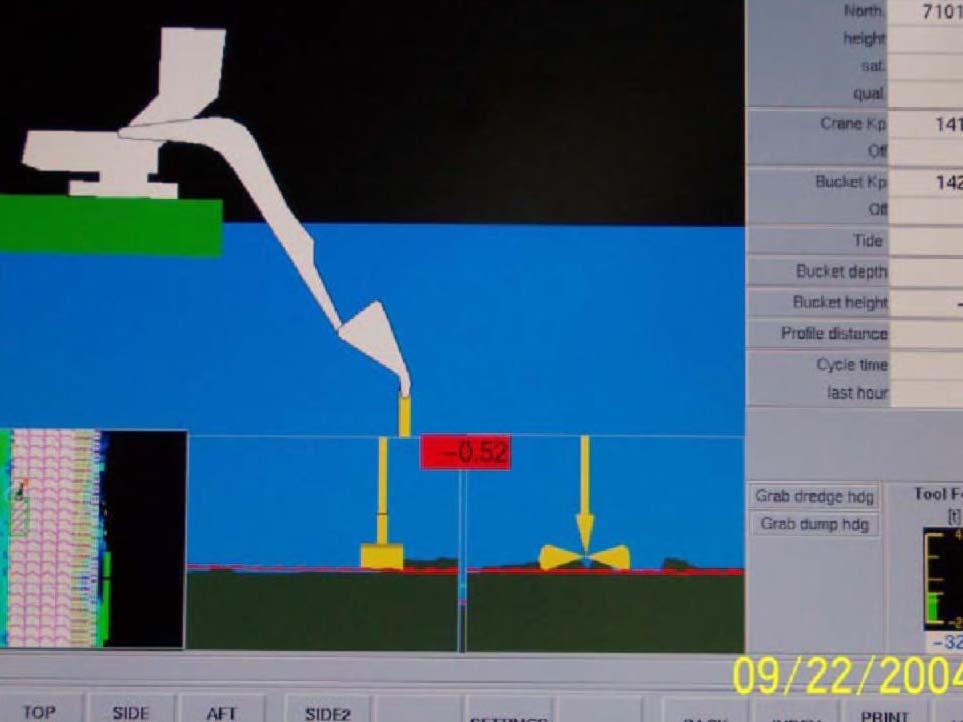
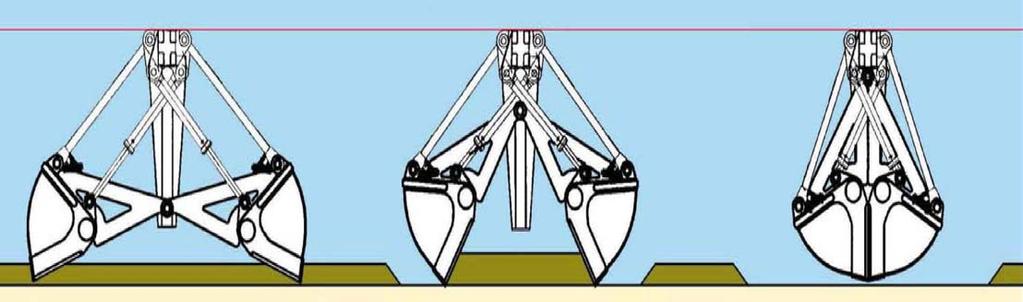
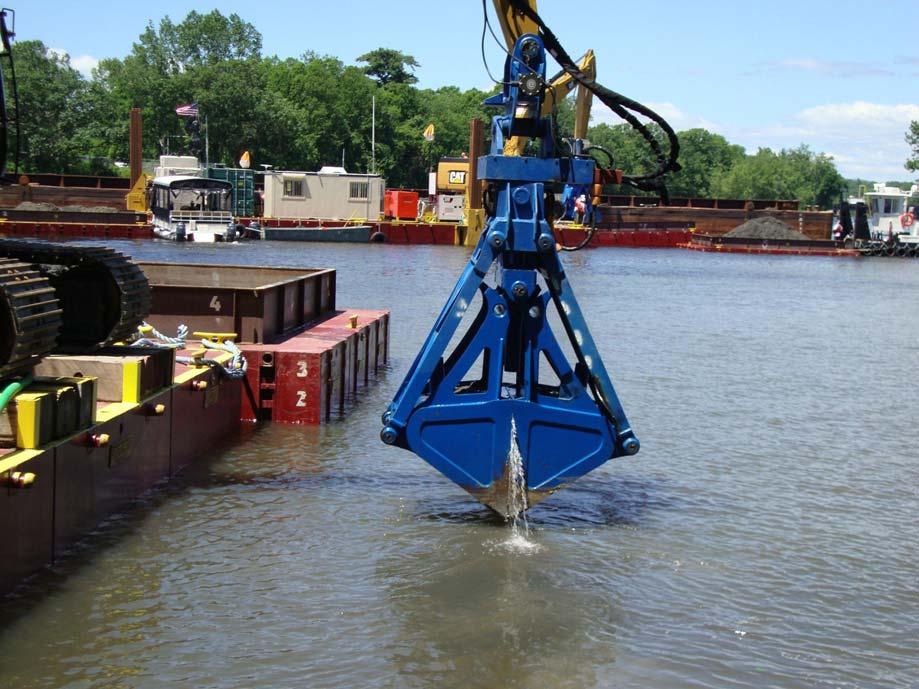
60 Observations from the First Phase of Dredging flows have varied significantly from typical conditions. Started in the worst case conditions Debris removal and prop wash are significant resuspension contributors. Lumber operation debris became a significant issue. Environmental bucket observations

61 EPA s Monitoring Data Website
62 Questions
63 Questions for CEUs
64 Question # 1 What are the Engineering Performance Standards?
65 Engineering Performance Standards Resuspension, residuals and productivity standards are included in the basis of design Design analysis includes the assessment of the ability to achieve the standards Achievement of the performance standards will be tested in Phase 1
66 Question #2 What are the Quality of Life Standards for?
67 Quality of Life Standards Noise Light Odor Navigation Air
68 Question #3 Why was mechanical dredging chosen over hydraulic dredging?
69 Mechanical Dredging Distance to pump material is 40 miles. Large amount of debris to be removed. Cobbles and boulders can clog transfer lines and must be removed mechanically anyway.
70 Question #4 Why are there 2 phases to the project?
71 > Dredging along 40 miles of river > Phase 1: 1 st year dredging (May - November) 2009 Test equipment/processing facility at peak performance Test of EPA s performance standards > Review of Phase 1: > Phase 2: Project Phases Independent peer review panel --- Receive public comments EPA decision on changes to project Remaining dredging
72 Question # 5 What are the lessons learned so far in the project?
73 Observations from the First Phase of Dredging flows have varied significantly from typical conditions. Started in the worst case conditions Debris removal and prop wash are significant resuspension contributors. Lumber operation debris became a significant issue. Environmental bucket observations