Multiple Sector Resource Management: Zambezi Case Study
|
|
|
- Arlene Pierce
- 5 years ago
- Views:
Transcription
1 Multiple Sector Resource Management: Zambezi Case Study

2 Quantitative Approaches to Optimizing Water, Land and Biodiversity Management An Operational Example from the Zambezi
3 Speakers & Discussants Chair: Ashok Subramanian, Acting Sector Manager, Africa Region, World Bank Daniel Liborio da Sousa, Senior Agriculture Services Specialist, Africa Region, World Bank Jeffrey Richey, Professor, School of Oceanography, University of Washington Erick Fernandes, Advisor, Agriculture and Rural Development, World Bank Discussants: Bonizella Biagini, Senior Environmental Specialist, Global Environment Facility (GEF) Len Abrams, Senior Water Resources Management Specialist, Africa Region, World Bank Christophe Crepin, Lead Environmental Specialist, Africa Region, World Bank

4 . This year, the participants will be challenged Sanitation, to think Health outside and Environment the water glass, building on the integrating theme of Access to Water the Bank s newly established Sustainable Development Governance Network and and Institutions exploring the challenges and options for good water Variability and Climate Change management and improved water services into the Complex future and Innovative Approaches
5 PURPOSE OF THIS SESSION Summary of Zambezi GEF baseline activity Outline approach that was taken broadly applicable. Highlight products, tools, and information framework developed Next steps
6 Outline Recent trends in the water sector The spatial dimension of water The impact of climate change Water in the World Bank Water Week 2007
![Market Led Smallholder Zambezi Development River in the Zambezi Valley Mozambique [IDA+GEF]](/docs-images/87/95104862/images/7-0.jpg "LANDSAT row/path, w/ Districts Overlay Env.")

,")
7 Market Led Smallholder Zambezi Development River in the Zambezi Valley Mozambique [IDA+GEF] LANDSAT row/path, w/ Districts Overlay Env. Sustainable Ag Intensification 169/71 168/71 167/71 166/71 Increase small holder incomes Support GOM community-driven market approach 169/72 168/72 167/72 166/72 Leverage GOM decentralization and catalyze Pvt. Sector involvement Leverage 169/73 WB infrastructure 168/73 (roads 167/73 & bridges), 166/73 Beira railway projects Harness synergies between national development goals and global environmental benefits

8 % change in runoff by 2050 Many of the major food-bowls of the world are projected to become significantly drier Globally there will be more precipitation Higher temperatures will tend to reduce run off A few important areas drier (Mediterranean, southern South America, northern Brazil, west and south Africa)

9 Projected Change in Frequency of Extreme Events in next 20 years

10 Mozambique Zambezi Flooding 2001


11 Mozambique: Impact of 2000 floods on the economy -23% +44%


12 Adaptation to Climate Variability & Change Zambezi Floods, Jan-Feb, 2007

13 Cyclone Tracks Season
 Enhance Moz capacity to assess and integrate climate change risk in current development plans/investments Strengthen Moz NAPA climate change mitigation")
14 Zambezi-GEF Objectives Reduce deforestation and loss of above- and belowground biodiversity Sustain ecosystem services (carbon sequestration, eco-hydrology, agrobiodiversity, native biodiversity) Enhance Moz capacity to assess and integrate climate change risk in current development plans/investments Strengthen Moz NAPA climate change mitigation activities
15 Regular Operations Approach The goal was to derive quantitative & georeferenced biophysical baselines for a blended IDA+GEF smallholders project in 5 districts adjacent to the Zambezi river in Mozambique. Because the Zambezi basin comprises 5 countries, we anchored the Mozambique portion in the context of the wider basin by first developing a state of the art Digital Elevation Model derived from NASA's Shuttle Radar Topographic Mission (SRTM) data We then coupled it with a basin-scale Variable Infiltration Capacity model that dynamically describes and forecasts both soil moisture and stream flows. Scaling up the hydro portion to the other basin countries is highly desirable given the dynamic land use changes (agricultural expansion, new forest plantations, natural forest logging) amidst increasing climate variability and associated risks being experienced in the region.
16 The quantitative baselines focus on: Land Cover and Land Use: A characterization of land use and land cover dynamics over the period in the 5 project districts of Mozambique's portion of the Zambezi basin. Vegetation Biodiversity: Provision of a georeferenced plant biodiversity profile for the 5 project districts, with rapid appraisal methods using low-cost, high-return, gradient directed transects (gradsects). A Dynamic Hydrology Analysis Framework: Deployment of geospatially-explicit, process based hydrology models that compute the water and energy balance of a spatial unit of the landscape (a 'pixel'), as a function of landscape structure (topography, soils) and vegetation properties - The Variable Infiltration Capacity (VIC) model. The hydro-print of Cabora Bassa dam on river and downstream surface flows has also been incorporated. Because the model is coupled to a medium range weather model, the current and evolving basin-scale product can now look "forward" (crude forecasting) to alert local stakeholders about extreme weather events.
17 Who did the work & How? The work was conducted by local experts collaborating closely with 3 international experts and myself. An important part of the early work was the hands on training for local staff from the Ministries as well as faculty and postdoc/graduate students from Eduardo Mondlane University in Maputo. The national staff and students that were trained participated in field data collection. Communities were interviewed and their locations georeferenced via GPS units.
18 Data Collection Where field data was absent, our team knew where and how to access public domain datasets. This was done at zero cost for LANDSAT images, Shuttle Radar Topographic Mission DEM tiles, the 1:5,000,000 IGBP soils data base, the 1:1,000,000 Mozambique soils map. For climate data, the civil war in Mozambique resulted in the destruction of most of the met and river gauging equipment and has created a 20 year weather data gap. The team overcame this major constraint by finding and accessing two independent public domain data streams: data records from the World Meteorological Organization (WMO), and the daily re-analysis product (ERA40), from the European Center for Medium Range Weather Forecast (ECMWF). Despite some discrepancies between the ERA40 and the WMO stations datasets, we were able to compile a useful database comprising daily and monthly time series of the climate variables Not trivial but doable with the right level of expertise and experience.


19 Field Footprint.
 databases on LCLUC dynamics, biodiversity, soils, ag potential, hydrology, climate (MICOA, DNA, CENACARTA, ARA ZAM, EM UNIV) Basin/catchment hydrology assessment")
20 Outputs Demand driven capacity enhancement/ training. National (+WB) databases on LCLUC dynamics, biodiversity, soils, ag potential, hydrology, climate (MICOA, DNA, CENACARTA, ARA ZAM, EM UNIV) Basin/catchment hydrology assessment framework. Create and sustain national capacity to model the interactive impacts of climate change and prioritize mitigation measures.
 inform Transboundary water and environmental security issues (and what is a WMNG anyway?) Subplot #2.")
21 An Integrated Model of River Basin Dynamics: towards Progress and Collaboration Subplot #1. How can Watershed Models (the Next Generation) inform Transboundary water and environmental security issues (and what is a WMNG anyway?) Subplot #2. How best to establish the necessary dialogue between the technology and the application? Subplot #3. How does a basin work?


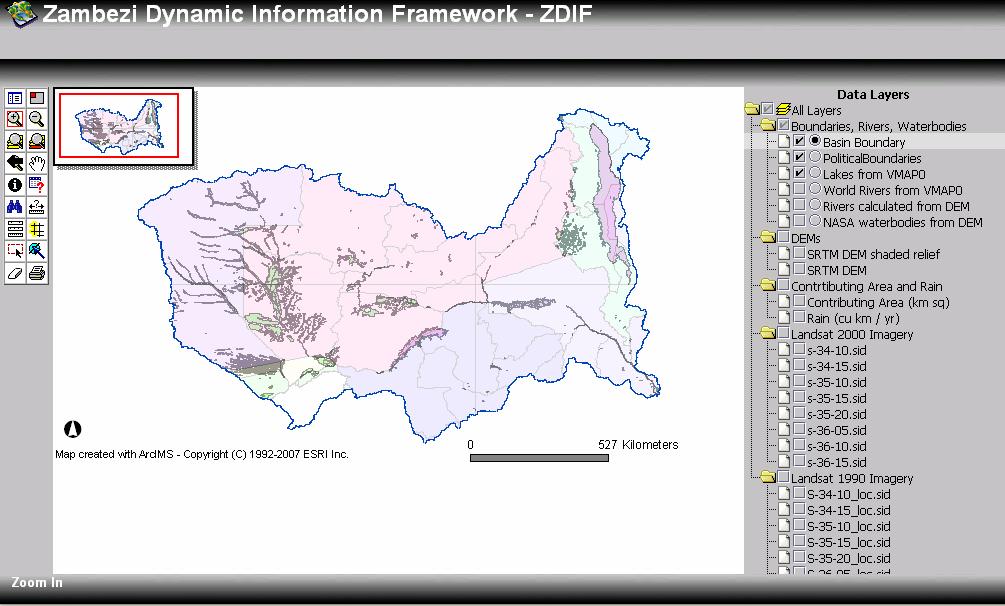
22 DYNAMIC INFORMATION FRAMEWORK (DIF).noting especially issues of data gaps.. (Transboundary) Political Boundaries Landuse/Landcover Physical Template

23 Express Societal Impact on a Biophysical World
 Provides a means for ~intelligent interpolation for sparse data.")
24 Essentially, a Dynamic Information Framework is a numeric and quantitative Commons, which builds on the legacy of knowledge, with the goal of harmonizing watershed function for multiple users Process of creating the model provides an integration of data from multiple sources (of interest to many) Provides a means for ~intelligent interpolation for sparse data. Also, provides the basis for crossscale/upscaling analyses. Provides an instrument for a (quantitative) analysis of complex interdependent problems Provides a foundation for scenarios

25
26


27 SRTM-derived 3 (90-m) DEM of the Zambezi basin, with progressive zoom-ins from whole basin to Smallholder districts 1:15,904,562 1:1,000,000 MUTARARA 1:250,000 CHEMBE MORRUMBALA MARINGUE MOPEA CHIRE
, Revuboe (2), Tete (3), Matundo Cais (4), Megaza (Chire, 5), and Luenha")
28 Routing Network derived from the SRTM30 and Hydro1k basin delineation For subsequent model analysis, the stations at Zumbo (1), Revuboe (2), Tete (3), Matundo Cais (4), Megaza (Chire, 5), and Luenha (6)


29


30 Soil types of Tete, Sofala, and Manica provinces, at 1:1M (IIAM)


31

32


33 Landsat spectral mixture analysis, for images from March 1991, August , and December 30, Whole image (upper images), with red rectangle indicating zoom-in for each. (lower images)


34 HIGHER SPATIAL RESOLUTION Land-cover Map 1991 Numerical decision tree used to classify biophysical data into land-cover types 2000 Green = woodland/dense savanna; Yellow = savanna; Blue = herbaceous-dominated; Red = degraded or disturbed

35 HIGHER TEMPORAL RESOLUTION SEASONAL PHENOLOGY (NDVI) Of THE ZAMBEZI REGION May-Sep 2000 Test-of-Concept /1 st -Look MODIS 1-km 16-Day averages* *Processing by Leon Delwiche/UW

36 BIODIVERSITY Terrestrial ecoregion classifications covering the area under study
 reference transects (red dots) along the gradsect from Tete (Mphanda Nkuwa) to the delta region near Chinde.")
37 GRADSEC RAPID BIODIVERSITY ASSESSMENT Tete (Mphanda Nkuwa) Mutarara Morrumbala Mopeia Quelimane Chinde Layout of 32 (40x5m) reference transects (red dots) along the gradsect from Tete (Mphanda Nkuwa) to the delta region near Chinde.

 Section of full Landsat")
38 DOMAIN potential mapping of the entire Zambezi basin. Colors indicate similarity of an environmental envelope and compared with land cover (percentage of vegetation class in each pixel for 8 key vegetation types within the basin). Red indicates similarity >95% grading through orange, yellow, green to blue that is < 5% (typically upland zones) Section of full Landsat scene 167/72 (Dec 2000) showing results of a DOMAIN analysis of Land Cover as indicated by composite photosynthetic and non-photosynthetic vegetation and soil (bare ground) imagery.
 *extensive literature in international")
39 DISTRIBUTION OF WATER ACROSS THE ZAMBEZI VIC * (Variable Infiltration Capacity) *extensive literature in international peer-review


40 PROBLEM: HOW GOOD IS DRIVER SURFACE CLIMATOLOGY? Rainfall, Tmax, Tmin, Wind WMO stations in and around the Zambezi basin, with the number of missing daily observations in the period World Meteorological Organization


")
41 Daily Average Precipitation: WMO v ERA40* Feb 2000 Feb Aug (mm/d) *ERA40: daily re-analysis product from the European Center for Medium Range Weather Forecast (ECMWF)

42
 monthly mean discharge (m3/s) at Matundo-Cais, 1980-2003 Monthly average time series 1997-2006 of precipitation and simulated hydrologic")
43 PRELIMINARY VIC-MODELING (cal/val in progress) ERA- VIC-modeled (0.5 o resolution) monthly mean discharge (m3/s) at Matundo-Cais, Monthly average time series of precipitation and simulated hydrologic variables (R, ET, SM; in mm) Precipitation 2001 Flood Runoff Evapotranspiration Soil Moisture
 Evaporation (mm) Soil Moisture")
44 1997-August 2002 Annual Average Daily Runoff (mm) Evaporation (mm) Soil Moisture (mm)

45 IS THIS APPROACH MORE WIDELY APPLICABLE?. If time, look at Mekong and Amazon.


46 SCALING, from a Small Watershed to Far-Field Effects in Large Systems MAE CHAEM MEKONG
 J.")
47 Effects of landuse change on the hydrologic regime of The Mae Chaem river basin, NW Thailand Thanapakpawin et al (in press) J. of Hydrology* 4000 km 2 /Sparse Data *NSF, BNPP Functional Value of Biodiversity


48 Surface Climate Landcover Scenarios


49 Underlying Dynamic Changes DHSVM (Distributed Hydrology Soil Vegetation Model) (150m) m 3 /s Observed discharge Simulated discharge 0 5/94 10/94 5/95 11/95 5/96 11/96 5/97 11/97 5/98 11/98 5/99 11/99 5/00 11/00
 53.3 11.1 752 Scenario II I NI 202 (24.7) 261 (31.8) 53.6 61.2 5.8 12.5 781 715 Scenario III I NI 220 (25.6) 269 (32.8) 56.8 63.1 7.0 12.")
50 Landcover scenarios Veg 2000 I NI Annual yield, mm (m 3 /s) 215 (26.2) 249 (30.5) Average hydrologic components ( ) High flow, m 3 /s a Low flow, m 3 /s Annual evapotranspiration, mm Scenario I NI 223 (27.2) Scenario II I NI 202 (24.7) 261 (31.8) Scenario III I NI 220 (25.6) 269 (32.8) Scenario IV I NI 193 (23.6) 251 (30.7)
51 Landscape structure and use, climate, and water movement in the Mekong River basin Costa-Cabral et al (in press). Hydrological Processes*. * NSF, BNPP Functional Value of Biodiversity


52 Mekong Flow (m 3 /s): Observed Simulated Chiang Saen Luang Prabang Vientiane Nakhon Phanom Mukdahan Pakse Stung Treng Phnom Penh
 L2 An")

53 L1 Average monthly soil moisture saturation by soil layer: calibrated simulation (fraction of the maximum water content, by porosity) L2 An intermediate product Implications for flooding prediction weeks out Implications for drought prediction weeks out L3 Combine with regional climate model in near real-time.
54 Average monthly streamflow rate in for simulation scenarios 4000 Ubon 4000 Vientiane minus Chiang Saen Flow Rate (m 3 /s) Jan Mar May Jul Sep Nov Jan Mar May Jul Sep Nov Current Historical (~1950) Future (100yr) Upland agr. (replace irrigated&bunded w/upland) Current Historical Future (100yr) No Swidden (replace w/forest)

55 EFFECT OF DAMS ON FLOW SUB-MODEL

56 Mekong River Commission Secretariat, Vientiane

57


58 Routing Model Flow direction and accumulation DEM

59 Santo Antonio do Içá FAILURE!
60 Rio Madeira Rio Negro Rio Juruá
61 NEXT STEPS?