NASA - A Partner in Disaster Risk Reduction for Public Safety
|
|
|
- Barnard Caldwell
- 5 years ago
- Views:
Transcription

1 Plenary Presentation NASA - A Partner in Disaster Risk Reduction for Public Safety Jordan Bell, Disaster Applications Coordinator, NASA Applied Sciences Disasters Program


2 NASA - A Partner in Disaster Risk Reduction for Public Safety Jordan Bell Research Associate/Disaster Coordinator University of Alabama in Huntsville NASA Marshall Space Flight Center (MSFC) 2


3 Applied Science and Disaster Response at NASA Science Mission Directorate Earth Science Division NASA Earth Science Research Applied Science Flight Technology Disaster Response Partnerships, International Initiatives


4 Application Themes & Societal Benefit Areas Programmatic Focus on: Health & Air Quality Disasters Water Resources Wildfires Ecological Forecasting Support ad hoc opportunities in additional areas: Agriculture & Food Security Aviation Safety Climate & Weather Energy Socioeconomic Impacts

5 Operating NASA Earth Science Missions

6 Planned NASA Earth Science Missions


7 Airborne Observing Platforms

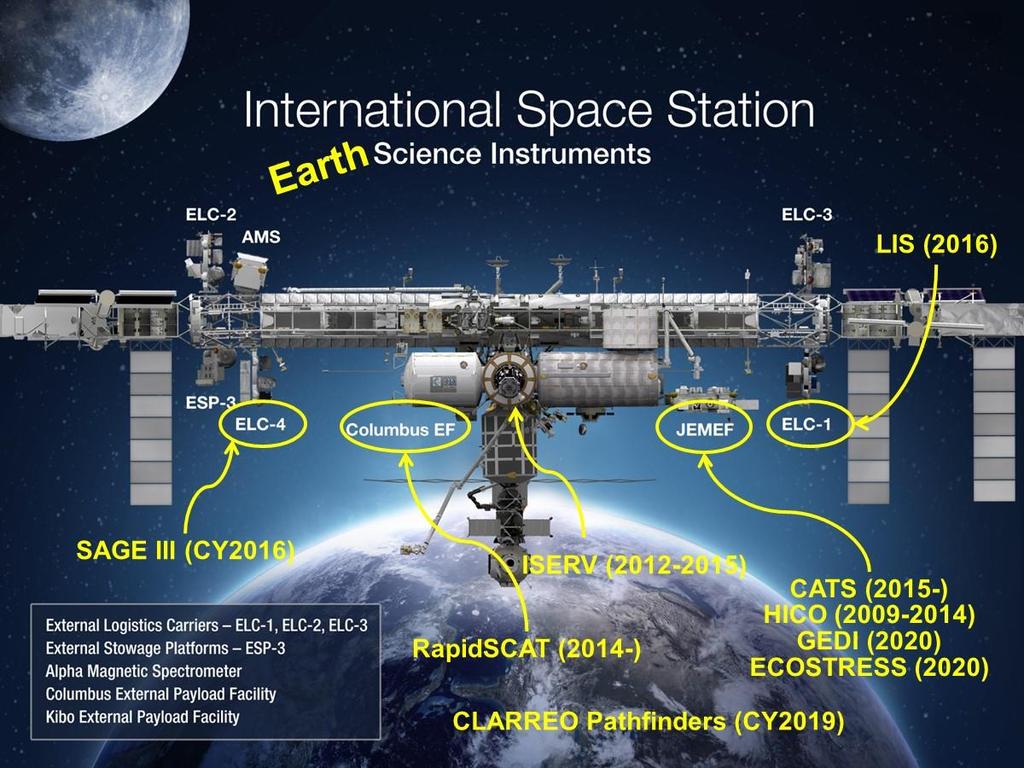

8 International Space Station Science NASA provides a unique perspective

9 NASA Disaster Response Program Disasters Applications area promotes the use of Earth observations to improve prediction of, preparation for, response to, and recovery from natural and technological disasters.


10 Disaster Program Rapid Assessment and Response Tiers of Disaster Assessment: Events/Year Tier 1: Events/Year Tier 2: 3-10 Events/Year Tier 3: 0-3 Events/Year
11 PUBLIC SAFETY SCENARIOS
12 CRITICAL INFRASTRUCTURE MONITORING Thanks to: Cathleen Jones, NASA Jet Propulsion Lab


13 Critical Infrastructure Monitoring Sentinel-1 European Space Agency Synthetic Aperture Radar

 Contains")

14 Monitoring a High-rise European Space Agency TRE ALTIMIRA Technique: Processing multiple SAR images collected over time to detect small-scale movement (cm/yr to mm/yr) Contains modified Copernicus Sentinel data ( ) / ESA SEOM INSARAP study / PPO.labs / Norut / NGU,CC BY-SA 3.0 IGO


15 UAVSAR: The NISAR Prototype Airborne Instrument Today NISAR Launch Dec Global coverage every 12 days
16 Subsidence & Levee Movement


17 Subsidence & Levee Movement Vertical Velocity


18 Aqueduct Subsidence Monitoring Avenal Hot Spot Previously had seen 13 max subsidence of the aqueduct in July March By June 2016 the same location showed 25 max subsidence of the aqueduct. 4.7 miles of the aqueduct subsided > 10. InSAR averages over an area of ~25 x25, so maximum at a point location is probably higher. DWR calculated that the aqueduct flow here is reduced by 20% from initial construction values, 8350 ft 3 /s ---> 6650 ft 3 /s.
19 DAMAGE AND INUNDATION MAPPING

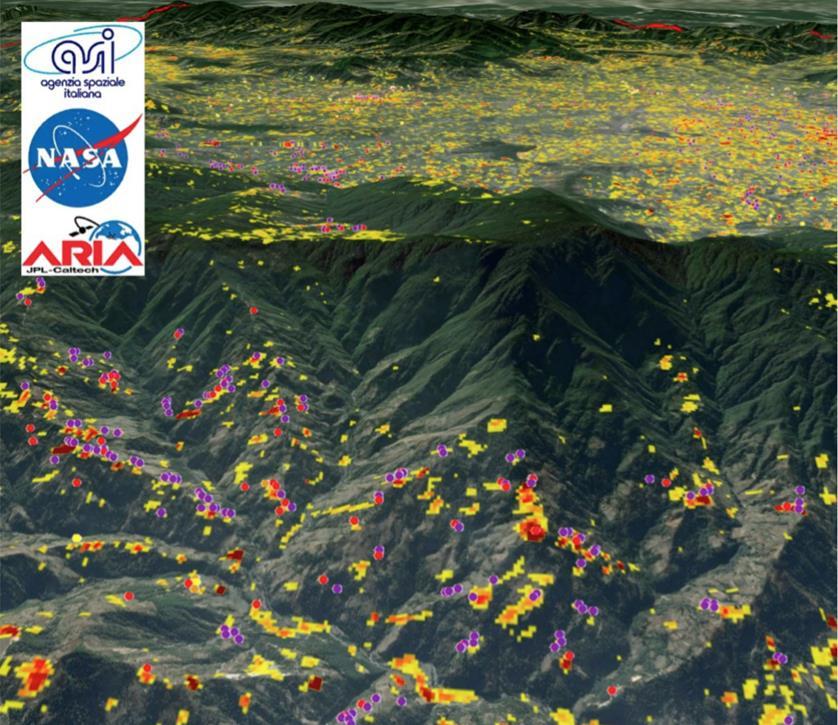
20 Damage Proxy Mapping

")
21 Inundation Mapping ALOS-2 (12 m) Sentinel 1 (30 m) Sentinel 1 (30 m)
22 POWER OUTAGE ASSESSMENT


23 Power Outage Assessment Hurricane Matthew Yellow: Lights missing after damage from Sandy These data were provided to USGS, the U.S. Army Northern Command and FEMA to assist with their response efforts Post-Sandy: November 1, 2012
24 RISK EXPOSURE MAPPING Thanks to: Charles Huyck and Ron Eguchi, ImageCat, Inc.


25 Exposure Modeling Loss Modeling Risk Exposure Layers Adding Context and Aiding Decision-making Default Exposure Population EO Exposure EO data Developing Global Building Exposure for Disaster Forecasting, Mitigation and Response Landuse or urban zone classification Population Structural characteristics Building replacement values Decision Support Hazard Vulnerabilities Calculation Prob. Loss
26 Los Angeles Basin
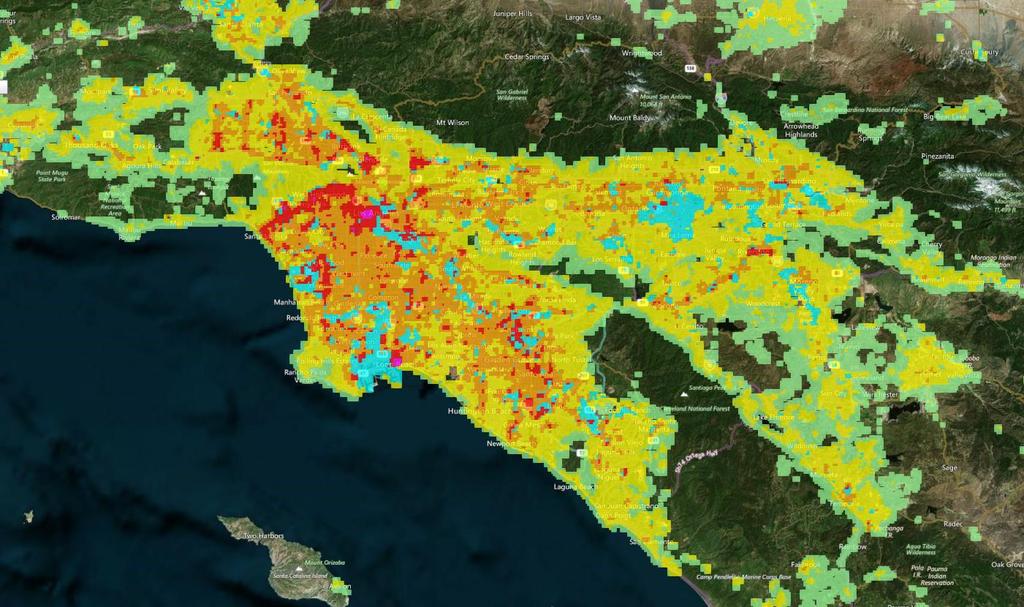
27 Development Pattern

28 Building Replacement Value

29 Hansen Dam Burst Inundation Area Hansen Dam
30 Exposure Affected by Hansen Dam Occupancy Total SQFT (Thousands) Total Building Exposure ($Billions) AGR 1, COM 186, EDU 8, GOV 4, IND 82, REL 9, RES 656, Grand Total 949,

")
31 How do Exposure Maps enhance NASA s Earth Science Disasters Program Enhances situational awareness after a disaster add exposure data layer to hazard data layer to estimate impacts Provides context for risk reduction and community resilience enhancement programs - benchmark current and future impacts for large regions Creates an entrée into commercial applications, e.g., insurance (especially in emerging countries and economies)
32 ARCGIS PORTAL DEVELOPMENT FOR DISASTER RESPONSE
33 NASA Disaster Applications Current Planned Architecture (Q3 2017) Satellites Airborne UAS Partnerships Tsunamis Tornadoes FTPs Wildfires Earthquakes Severe Weather Volcanoes Floods Hurricanes Oil Spills Dam Threats APIs Listserves GIS Apps & Systems

34 NASA Disaster Applications Current Planned Architecture (Q3 2017) Satellites Airborne UAS Partnerships Tsunamis Tornadoes Wildfires Floods Earthquakes Severe Weather Volcanoes Hurricanes Oil Spills Dam Threats NASA Disaster Applications GeoPlatform GIS Apps & Systems


35 Jordan Bell Research Associate Further Questions: Dr. David Green Disaster Response Program Manager Office: Mobile: Program: Response:

36 Questions?

37