Non-intrusive wellhead surveillance to support brownfield production optimisation recent case studies
|
|
|
- Dominick Lynch
- 5 years ago
- Views:
Transcription

1 Non-intrusive wellhead surveillance to support brownfield production optimisation recent case studies
2 Agenda Introduction Produce the Technical Limit Typical Sonar Applications Sonar Technology Case Studies Conclusion
3 Introduction Production optimisation of mature fields plays a significant role in todays market conditions where cost is at the top of the priority list and operators need to find suitable technologies to support daily operations while keeping costs down without jeopardizing or shutting down production. Low oil price brings Optimization into sharp relief

4 RESERVOIR MANAGEMENT DATA Plant Capacity & Choke Model Data Wells & Pipeline Data Plant Capacity Mapping Pressure Mapping Produce the Technical Limit MANPOWER - RESOURCES Asset, Cross Discipline Team PTL, Cross Discipline Facilitation Team EGIS PTL REVIEW WORKSHOP System Bottlenecks Identified Opportunities Identified Prioritisation of Opportunities PTL Opportunities are Developed further, Resourced, Costed and Logged. Process Simulators Reservoir Simulators Activities Implemented IAM Toolkit OPTIMISATION TOOLS Production Gains Tracked


5 Typical SONAR Applications SonarTest Temporary SonarMonitor Permanent Wellhead Production Surveillance ESP Optimisation Gas lift Optimisation Pressure Support (water Injection) Post and pre intervention Augment well testing regime New meter verification during start up Legacy metering verification Legacy metering replacement
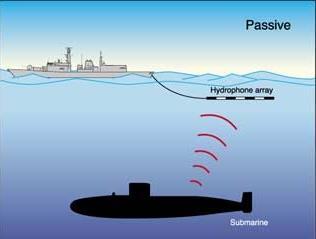
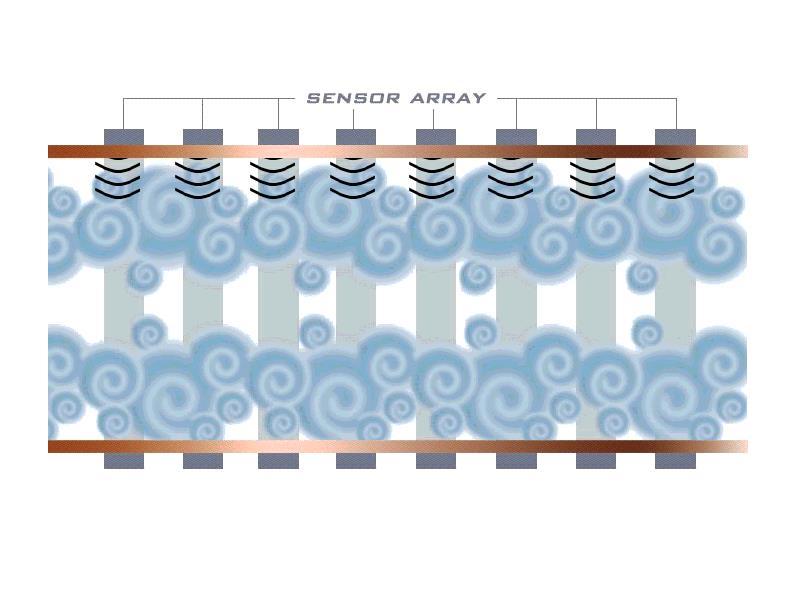
6 SONAR Technology Copyright Expro 2015
 Gas Flow Velocity Range (application dependant) = 6 to 50 m/s (20 to 150 f/s) Well-suited for high flow rates, large diameter pipes and high")
 Gas Flow Velocity Range (application dependant) = 0.5 to 50 m/s (1.")
7 SONAR Technology Specifications PassiveSONAR TM Meter ATEX Zone 2, 2 to 30, Liquid Flow Velocity Range (application dependant) = 1 to 10 m/s (3 to 30 f/s) Gas Flow Velocity Range (application dependant) = 6 to 50 m/s (20 to 150 f/s) Well-suited for high flow rates, large diameter pipes and high liquid loadings. ActiveSONAR TM Meter ATEX/IECEX Zone 1, 2 to 32, Liquid Flow Velocity Range (application dependant) = 0.5 to 50 m/s (1.5 to 150 f/s) Gas Flow Velocity Range (application dependant) = 0.5 to 50 m/s (1.5 to 150 f/s) Well-suited for dry and wet gas surveillance in heavy schedule piping.
8 Case Studies Centrica SNS: Mature Dry Gas (SPE171712) Marathon NS : Liquid Loading Prone Gas (SPE MS) Algeria: Mature Oil Field
9 Centrica Case Study: Mature Dry Gas (SPE171712) Slide 12 Centrica operates South And North Morecambe Gas Fields Production commenced in 1985 S. Morecambe 34 active wells, N. Morecambe 10 active wells Produced via volumetric depletion Wells gathered to drilling platforms Normally Unmanned Installations SPE Application of Sonar Flow Measurement For Field Wide Surveillance Of A Mature Gas Field Ahmed Hussein
10 Well Allocation and Metering Background Slide 13 Venturi meters originally installed for both fields (1985 and 1994 respectively) Meters sized for peak production, outside measurement range as field production declined. Production separators installed and subsequently removed. Rough well allocation performed by analyzing P & T trends. Different technologies evaluated before Sonar technology selected after an initial trial campaign.


11 Initial Meter Validation Charlie Facility, Gross 14 MMscf/day, 5 wells Individual wells ~ 3 MMscf/day SONAR Meter diagnostics gave overwhelming evidence that only 1 out of 5 wells were flowing, Flowing well was > 14 MMscf/day Production from only 1 well Customer made decision to shut in facility, one well at a time Well #4 shut in last, confirmed all production came from single well Wireline intervention downhole camera highlighted Halite Well work program fresh water Halite wash and N2 Coil Tubing Lift Additional 4 wells were taken back onto production, Overall Field production up.

12 SONAR Well Surveillance Slide Sonar meters permanently installed across 6 platforms Meters directly clamped onto pipe, no flow interference or pressure loss Short rig-up time Significantly lower production losses as compared to individual well testing using test separators. Availability of real time flow information for each well.
13 SONAR Qgas (MMscfd) SONAR Qgas (MMscfd) Apr-12 May-12 Jun-12 Jul-12 Aug-12 Sep-12 Oct-12 Nov-12 Dec-12 Jan-13 Feb-13 Mar-13 Apr-13 May-13 Jun-13 Jul-13 Aug-13 Sep-13 Oct-13 Nov-13 Dec-13 Jan-14 Feb-14 Mar-14 Apr-14 May-14 Jun-14 SONAR Qgas (Mmscfd) SONAR Real Time Data Slide Well Alpha1 - Alpha Platform All Platforms (S. Morecambe) - 08 June 2014 Gamma Platform - 08 June Alpha Beta Charlie Delta Gamma X1 X2 X3 X4 X5 X6 X7 X8 X9

14 Well Production Optimization Well Cycling Slide 17 Following the start up of a new, high pressure field, wells on DPPA platform dropped off in performance. Sonar meters used to establish worst affected wells and analyze response to cycling procedures. Determination of the optimum shut in period is a trail and error exercise until a suitable ratio is established
15 Well Production Optimization Well Cycling Slide 18 Cycling program was then extended to other wells in the fields Wells responding to a cycling routine were subjected to batch foam treatment to help unload larger amounts of liquid Selected wells from the batch program put forward as candidates for permanent foam injection. Sonar test data used to diagnose unstable wells (due to liquid loading and/or other issues) After Sonar data evaluation, PLT (Production Logging Test) runs are scheduled for wells displaying unstable behavior due to liquid loading

16 Separator Pressure (Bars) Marathon Case Study: Liquid Loading Prone Gas (SPE MS) Marathon East Brae mature Gas Condensate Field Field in Production blow down Water Influx from active reservoir Gas recycling to maximise condensate recovery Gas Exporting Blow-down stage Reducing Separator Pressure with Production Decline HP Sep 15 Test/ LP Sep Mixture of core and lazy wells Well allocation using individual well testing


17 Case Study: Liquid Loading Prone Gas (SPE MS) Flow assurance Shell deliquifaction modelling tool Marathon Oil s gas modelling Vertical lift performance In-flow performance Critical rate at HP & LP Separator Pressures Production constraints Actions Process modelling Convert test separator to LP Production Maximise production at or below critical gas rate Intensive well manipulation with focused surveillance Pro longed Sonar well tests Temperature monitoring Production logging interventions Power, Fluid, Gas Production Wells Gas Oil Water Facilities Cap Rock RESERVOIR $ A complete systems approach Injection Wells Water
18 Qgas (MMscfd) Qgas (MMscfd) Data Comparison Bi-monthly Surveillance clamp-on well testing Clamp-on hardware is permanently mounted to wellhead piping for consistency of measurement and well site efficiency well A3 over a period of 2 years. A3 Sonar Test Data A3 Separator Test Data Comparison of data from the test separator gas meter and the sonar meters was carried out Jun-10 Oct-10 Feb-11 Jun-11 Oct-11 Feb-12 Jun-12 Oct East Brae The percentage difference in measured Qgas (volumetric gas flow rate at standard conditions) varies between 0% and 10% A01 A02 A04 A05 A06 Wells Work with regulatory authorities to have SONAR Meter accepted as alternative to conventional Test Separator based well tests Test Separator Rates Sonar test rates
19 Copyright Expro STM00003 Rev 01 Qgas (MMscfd) Qgas (MMscfd) Process Press. (barg) Process Press. (barg) Huff & Puff plus HP to LP Swing Use SONAR Meters to test core wells when Test Separator is not available Use of SONAR Meters to investigate individual well performance in LP Separator Identify performance based criteria for well swinging operations 0.0 Time 28.0 Std Conditions Process Pressure 12 wells on 4hr swing cycle LP separator can accommodate Maximum 3-5 wells Well closed in to change compressors HP separator LP separator HP separator Lazy wells on Huff and Puff Achieve 90% utilization of LP Separator for well unloading, Std Condiitions Time Process Pressure
20 Gas Production Arrest Field Decline. Arrested Decline Decline pre test separator crossover Decline post test separator crossover

21 Multirate tests Algeria Water / Gas injection Case Study Hassi Messaoud Mature Oil field Super Giant reservoir with total proven reserves of 6.4+ billion barrels of oil. Large scale water and gas injection network Need for understanding and optimising injection of increased importance in current environment Identifying and trouble shooting gaps in existing data Gas lift Optimisation Reservoir Pressure Support Gas Injection rates Water injection rates


22 Gas Lift Measurement -Algeria ActiveSONAR used to measure gas lift rates during production testing Expro provides personnel and equipment data analysis and reporting One test per day Measure lift gas flow rate at wellheads and manifolds Enhance the value of the ongoing production testing TMU package offering
23 Gas Lift Optimisation -Algeria Hydrocarbon lifting optimisation is enabled by simultaneous measurement of lift gas and production rates. Couple Sonar with PassiveSONAR for production measurement SONAR Gas Injection (Sm3/h) Produced Qgas Av (Sm3/h) Produced Qoil Av (Sm3/h) /03/ /03/ /03/2015 GAS Lift optimization 0.00


24 Algeria Production Plant Single phase injection and gas lift is on going SONAR now being deployed to monitor production separator outlets to identify and monitor cycling behaviours Next step is audits in the Production Plant where client is experiencing instabilities and uncertainties in the volumetric behaviour Client solution Multiple SONAR Packages run simultaneously measure the production rates from the wells, manifolds, separators and export lines
25 Conclusions Slide 29 Sonar Surveillance aids production Optimisation Sonar Surveillance has had major impact in aiding production allocation from individual wells while minimizing separator well testing frequency and associated production loses Sonar Surveillance, in conjunction with other methods such as temperature monitoring and PLTs, has helped to understand individual well performance and analyze the impact of liquid loading Sonar Surveillance have enabled the production engineering team to identify underperforming wells and implement short-term de-liquification strategies such as well cycling Sonar Surveillance is able to evaluate the effectiveness of interventions and select suitable candidates for further intervention work, helping to prolong the field life of the mature asset Once adopted the scope of work and value information invariably increases
26 Conclusions The use of non conventional technologies such SONAR allows for; Continuous Well and Reservoir Monitoring without process interruptions Understanding individual well behavior Real Time Data Collection Optimize and evaluate well intervention activities Access to Remote locations Minimize HSE risks Increase frequency of testing Cost reduction More Quality Data = Better field management = Increased Production
27 Questions Any Questions?