Dr. Xiaosong Chen, PE
|
|
|
- Buddy Wilson
- 5 years ago
- Views:
Transcription


1 Dr. Xiaosong Chen, PE
2 (1) One Successful Case Study - Why Thermal Remediation (2) Several Failed Case Studies - What Challenge we encountered


3 Area: 600 m 2 * 14 m bgs Former chemical industrial area
4 Lithology: silt and clay Low Soil Permeability Highly Heterogeneous Hydrogeology Groundwater level: <1m bgs hydraulic conductivity < 1x10⁻⁶ cm/s
 (mg/l) o-toluidine 770 0.43 Vinyl Chloride 26.1 0.023 DCE 0.816 0.19 2,6-Dinitro-toluene 1.05 0.051 2,4-Dinitro-toluene 3.22 0.")
5 2- Nitroaniline, 1.21% Dinitrotolue ne, 1.74% Dichloroeth ylformal, 2.18% Dinitrophe nol, 4.09% Nitrobenze ne, 1.03% others, 13.13% BaP, 0.78% o-toluidine, 47.78% Benzylbuty lphthalate, 4.57% Cresol, 23.49% COC Max Conc. Remedial Goal (mg/l) (mg/l) o-toluidine Vinyl Chloride DCE ,6-Dinitro-toluene ,4-Dinitro-toluene nitro-o-toluidine TPH COC Max Conc. (mg/kg) Remedial goal (mg/kg) Boiling point ( C) Dinitro-toluene o-toluidine DCE

6 Tight schedule less than 5 months from mobilization to de-mob Tight Budget

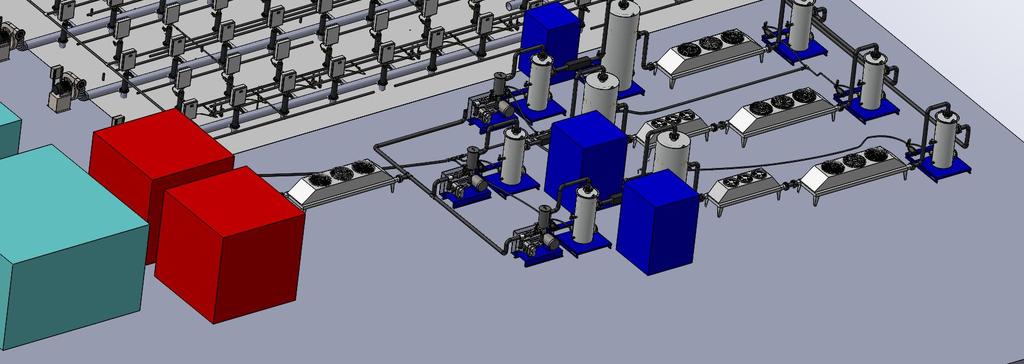
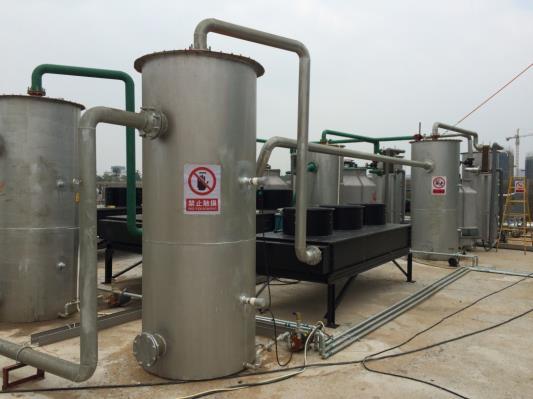
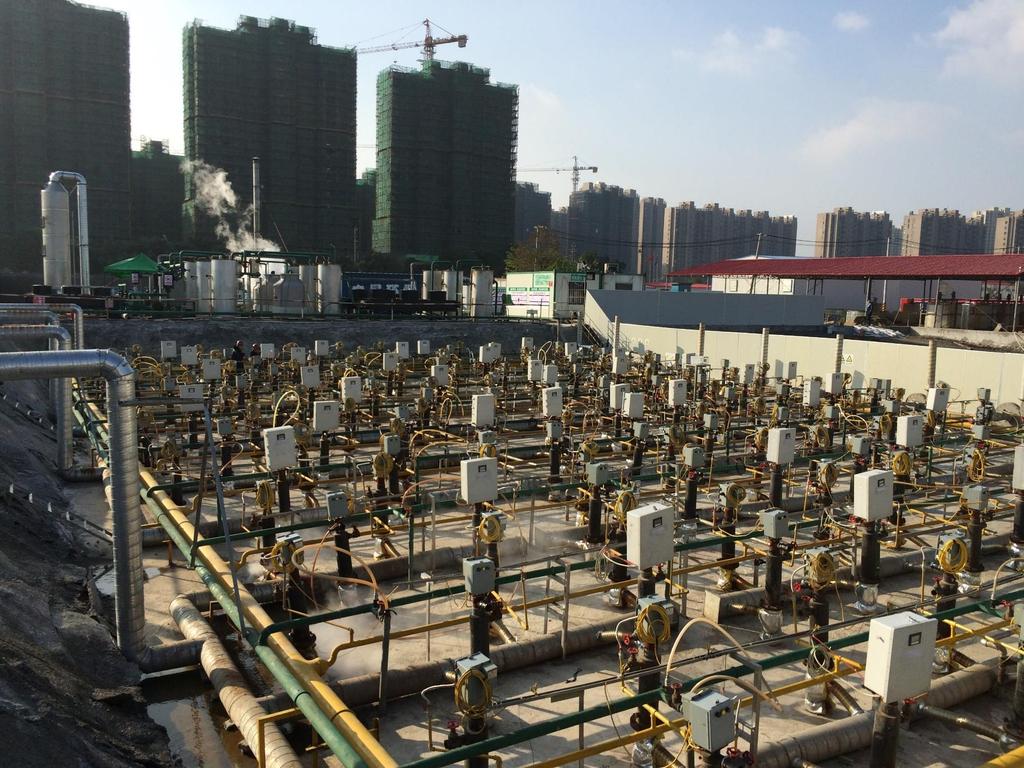
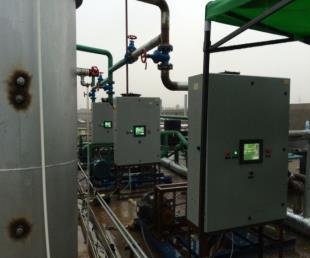
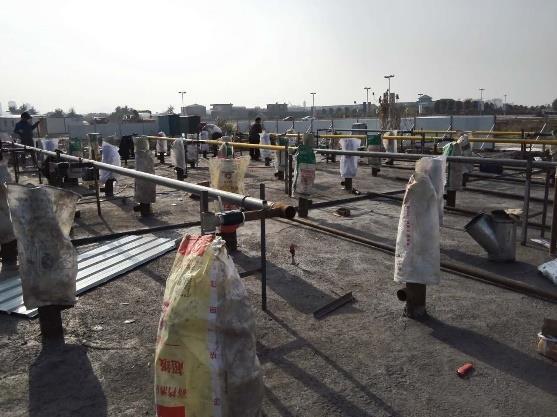
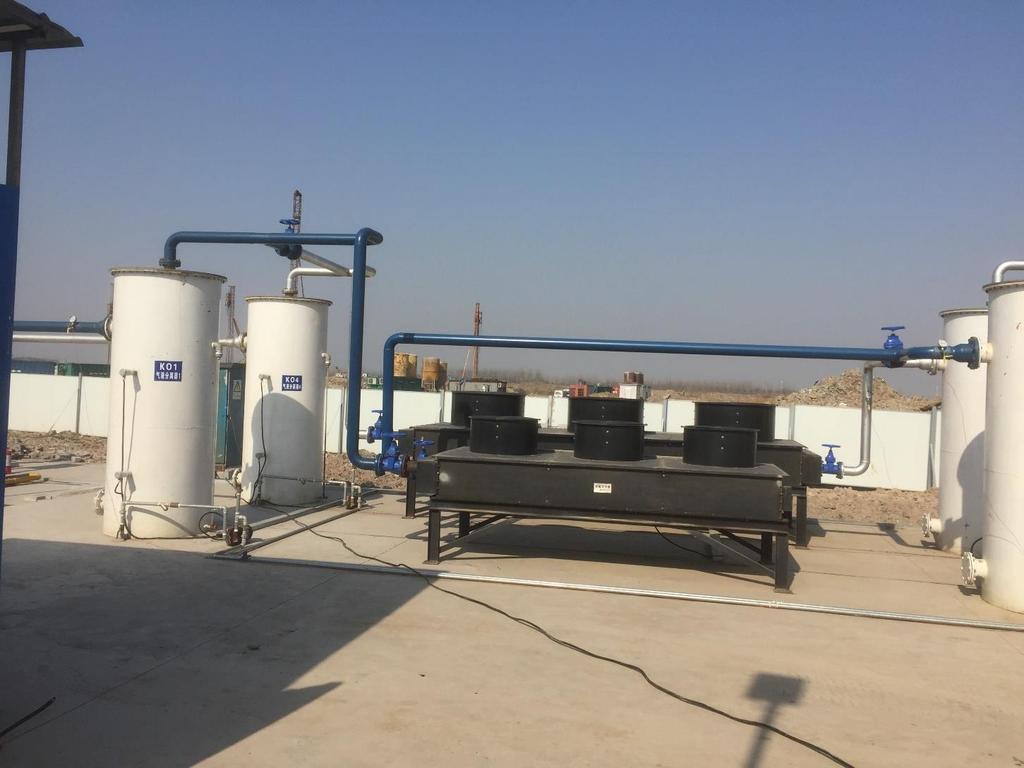
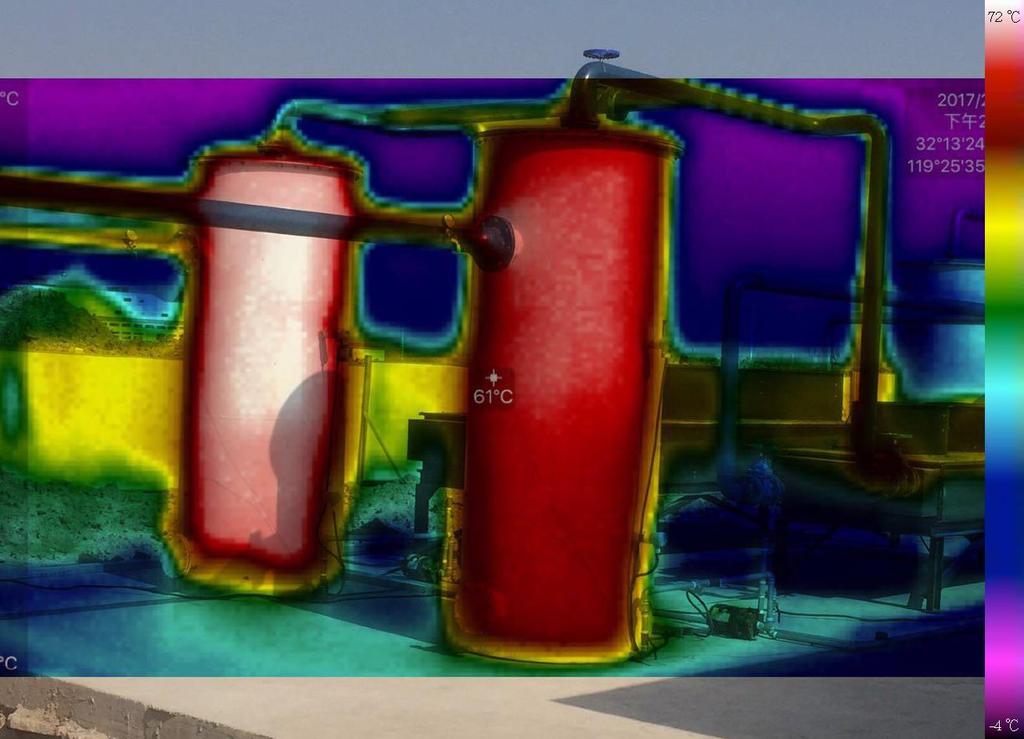
7 GTR= Gas Thermal Remediation Propane/Natural gas/diesel as fuel to heat the thermal conduction heater wells. Soil and groundwater are heated indirectly through conduction. Treatment temperatures from ~100 C to >400 C. Vaporized contaminants collected from extraction wells are routed to the appropriate vapor treatment module. Closed-loop in-situ thermal conduction heating system. No pollution emission into atmosphere. vgac


8 Industrial requirement: 0.8MPa; Business requirement: 0.4MPa; Residential requirement: 0.1~0.2MPa Household stove 1.5~3 Kpa 3.4 Kpa 0.5~2 Kpa KW


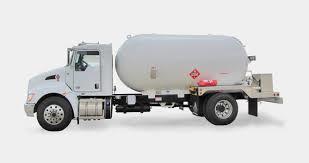
9 Propane Tanks Natural Gas Pipe

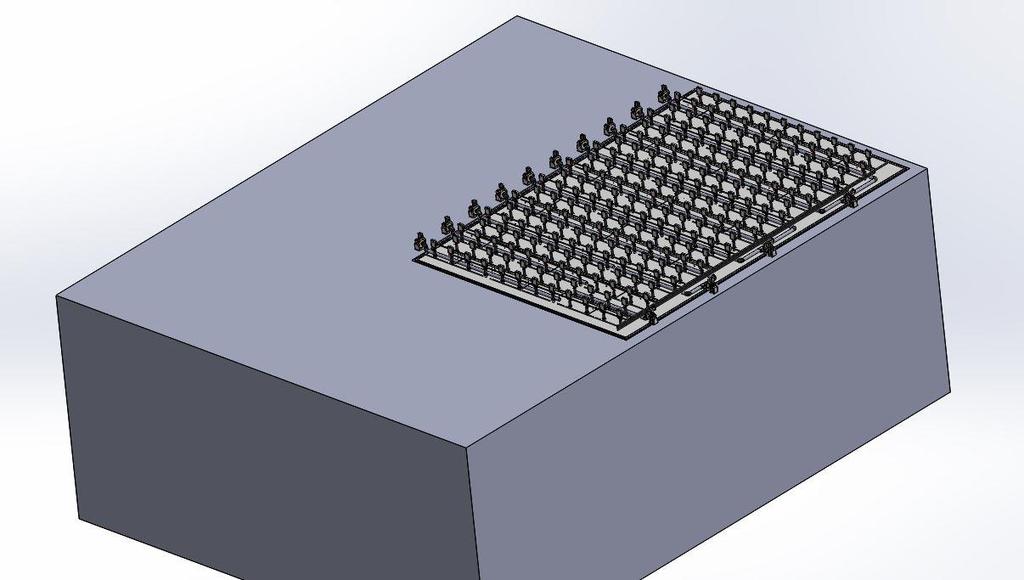
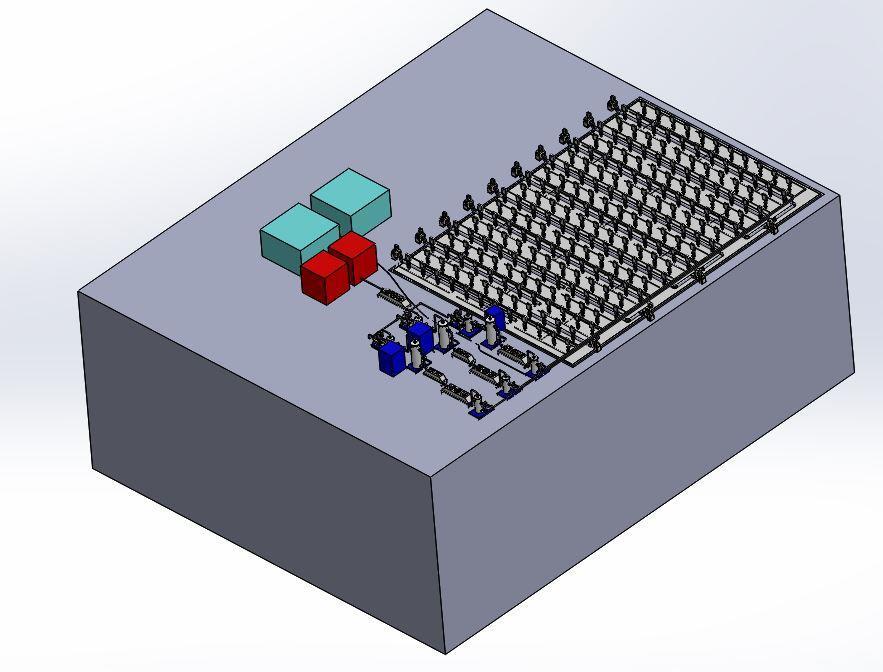
10 In Situ GTR = In Situ Heating +Vapor Extraction and Treatment


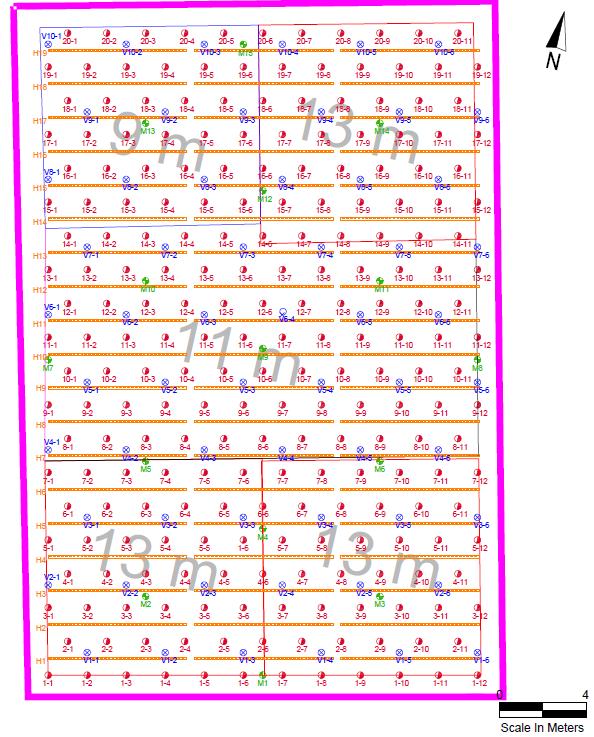
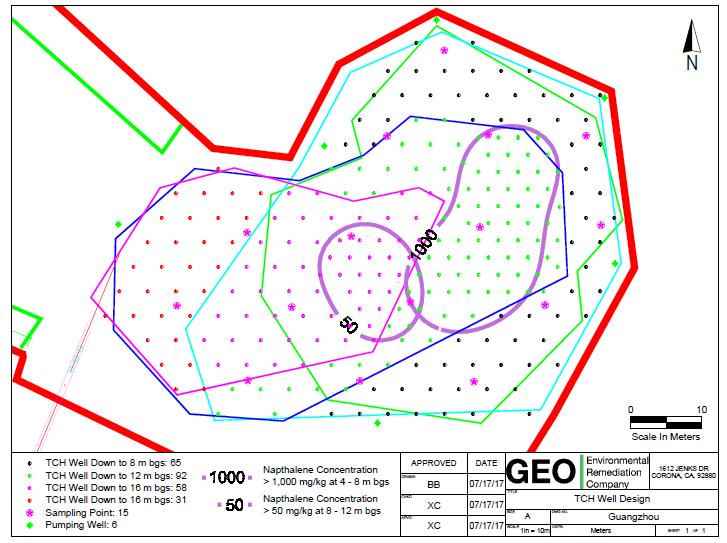
11 0 Treatment zone Sheet pilling 0 0


12 Outer tube Inner tube


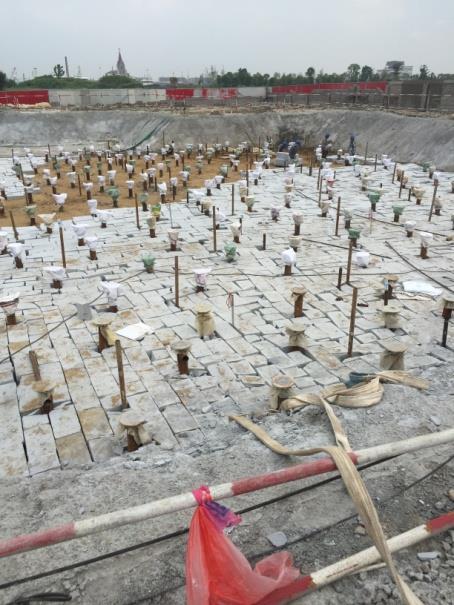
13 Insulation layer

14
15

16


17


18
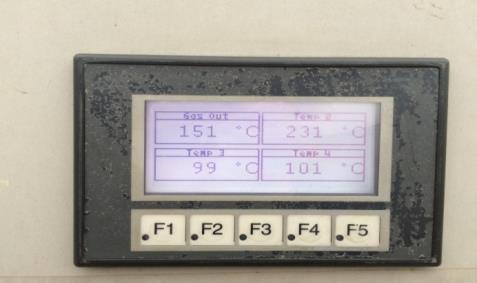
19 under GW affect TTT= 210 C at vadose zone and 100 C at saturated zone With hydraulic control A-A Cross section view 8.5 m bgs Plane view
20
21 150 C Tempreture Curve at 5m depth bgs /7 11/17 11/27 12/7 12/17 12/27 1/6 1/16 M1 M2 M3 M4 M5 M6 M7 M8 M9 M10 M11 M12 M14 M C 125 Tempreture Curve at 8m depth bgs. 150 C Tempreture Curve at 10m depth bgs /7 11/17 11/27 12/7 12/17 12/27 1/6 1/16 M1 M2 M3 M4 M5 M6 M7 M8 M9 M10 M11 M12 M14 M /7 11/17 11/27 12/7 12/17 12/27 1/6 1/16 M1 M2 M3 M4 M5 M6 M7 M8 M9 M10 M11 M12 M14 M15

22 Computer Simulated Water Removal with Temperature Evolution
 Remedial goal (mg/kg) Boiling point ( C) Dinitro-toluene 65 11.43 300 o-toluidine 271 20.")
23 Computer Simulated COCs Reduction with Temperature Evolution COC Max Conc. (mg/kg) Remedial goal (mg/kg) Boiling point ( C) Dinitro-toluene o-toluidine DCE


24 Dinitro-Toluene Conc. changed during heating 100 concentration (mg/kg) 10 1 Remediation goal =11.43 mg/kg C4 C Heating days o-toluidine Conc. changed during heating concentration (mg/kg) Remediation goal =20.77 mg/kg 1 C4 C5 C6 D4 D5 D Heating days DCE Conc. changed during heating concentration (mg/kg) 10 1 Remediation goal =10.65 mg/kg 0.1 D5 D Heating days
25 All soil sampling results suggested remediation goals were achieved in proposed duration soil conc. (mg/kg) DCE removal rate>99.9% pre-treatment post-treatment pre ave. conc.=46 mg/kg post ave. conc.=n.d. soil Samples 70 Dinitro-Toluene removal rate=99.9% 300 O-Toluene removal rate=99.5% soil conc. (mg/kg) pre-treatment post-treatment soil conc. (mg/kg) pre-treatment post-treatment pre ave. conc.=116mg/kg pre ave. conc.=10.6mg/kg post ave. conc.=1.4e-02 mg/kg soil Samples post ave. conc.=0.6 mg/kg soil Samples
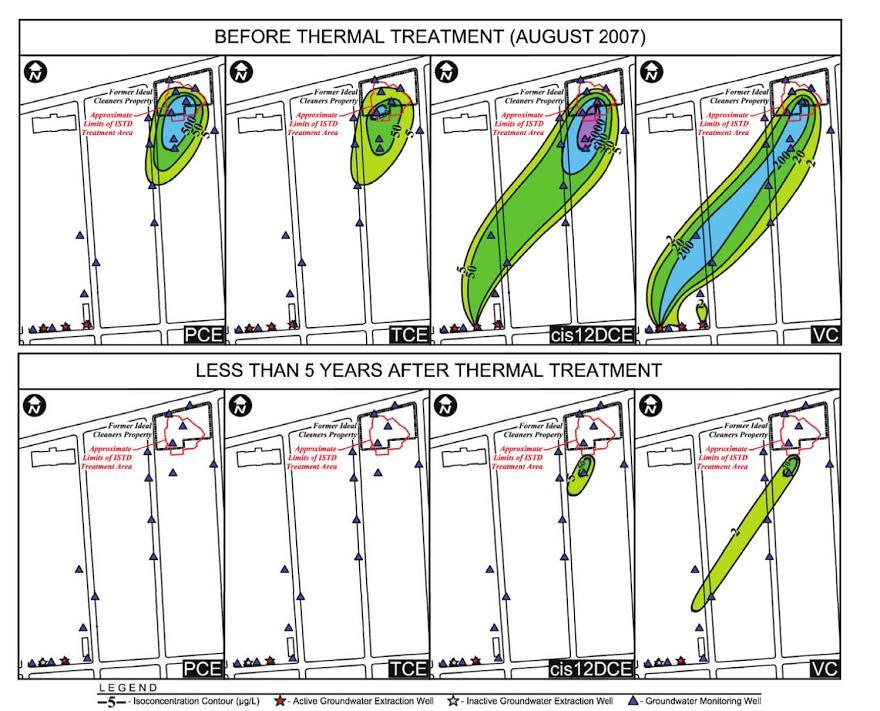
26 All groundwater sampling results suggested remediation goals were achieved in proposed duration Groundwater sampling Pre-treatment (µg/l) Post-treatment (01/19/2016) Remediation goal (µg/l) 2,6-dinitro-toluene 33.3 ND 51 2,4-dinitro-toluene 20.6 ND 58 o-toluidine 28,400 ND 430 DCE 29,800 ND 190 Vinyl Chloride 207 ND 23 5-nitro-o-toluidine 313 ND 3,350 TPH 24,


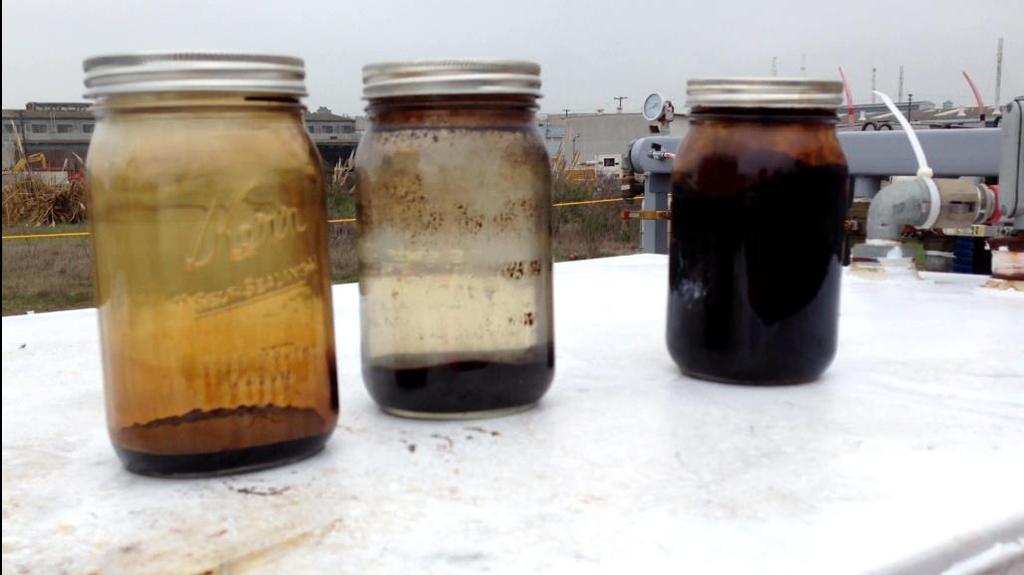
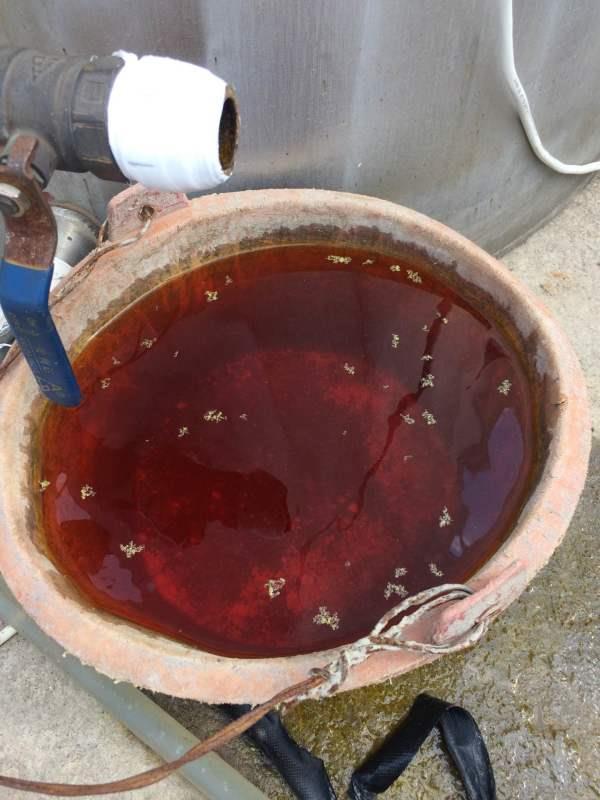
27 Soil before Treatment Soil after Treatment GW before Treatment GW after Treatment
 f s (kpa) Bearing capacity (kpa) Silty clay 0.546 10.2 73 Silty clay 0.")
28 Soil bearing test suggested the soil property was not changed during thermal treatment Pretreatment Post treatment Soil type CPT q c (MPa) f s (kpa) Bearing capacity (kpa) Silty clay Silty clay
29 Thermal Conductivity Hydraulic Conductivity
30 Duration for Different remediation technology In Situ Remediation Thermal Chemical injection flushing Bioremediation pump and treat VOCs (Benzene, DCE, ect) 1~2 3~9 4~12 6~18 12~24 VOCs (BTEX, TCE,PCE,gasoline,partial diesel, ect) 1~3 4~12 6~18 12~24 12~36 SVOCs (motol oil, MPG, PAHs, PCBs, dioxins,etc) 2~6 6~18 9~24 12~36 18~54


31 No Rebound Less long term cost


32 5 Case Studies in China

33 Short Duration (2 months from mob to demob) 10/08/2013 Mobilization and Installation 11/03/2013 Commissioning 11/05/2013 Start Heating 12/08/2013 Stop Treatment 12/12/2013 Confirming Sampling
 No Time (2) No Site")
34 Reach 100 C in less than 1 month Removed >99% of COCs from soil and groundwater Vapor treatment unsuccessful reason: (1) No Time (2) No Site Investigation
 Failure of some small parts of local")
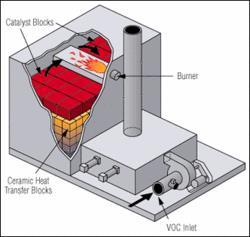
35 Vapor treatment need improvement: (1) Same problem: Unexpected significant higher VOCs concentration than provided site investigation report (2) Failure of some small parts of local equipment
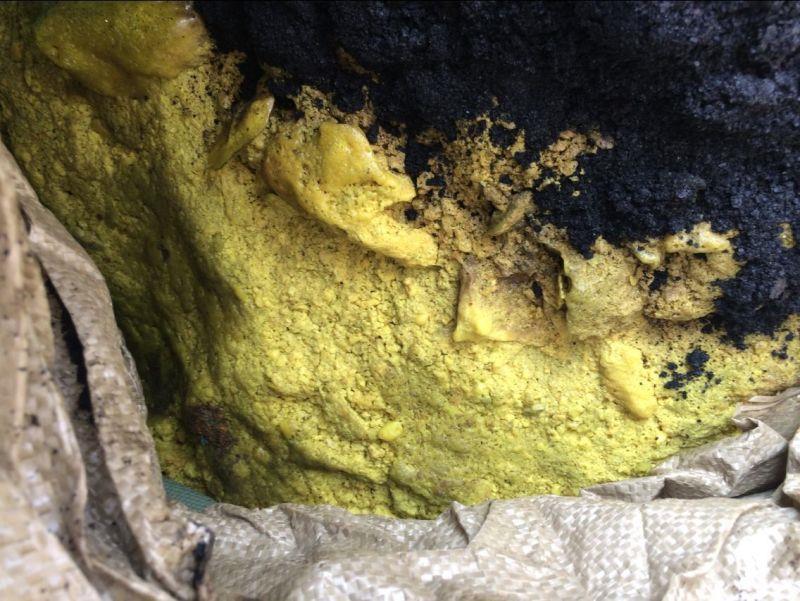
36 Vapor treatment need improvement: One unreported chemical: Sulfide Some adjustment done for this site immediately
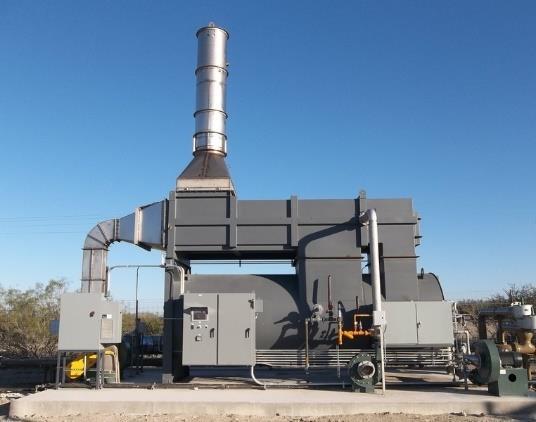
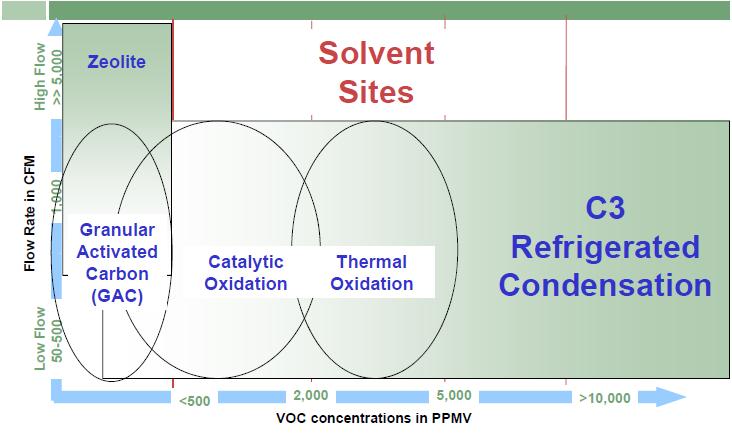
37 (1) Cooling (2) VGAC polishing (1) Cooling (2) Therm oxidation (3) VGAC polishing (1) Cooling (2) C3 (3) VGAC polishing (1) Cooling (2) GTR-O (3) VGAC polishing (1) Cooling (2) Catalytic oxidation (3) VGAC polishing
38
39
40
41


42 Good for SVOCs sites or low VOCs concentration sites
43 (1) Cooling (2) VGAC Polishing (1) Cooling (2) Therm Oxidation (3) VGAC Polishing or (1) Cooling (2) Catalytic Oxidation (3) VGAC Polishing (1) Cooling (2) C3 (3) VGAC polishing (1) Cooling (2) GTR-O (3) VGAC polishing

44
45 chlorinated solvents < 5,000 ppmv petroleum hydrocarbons <10,000 ppmv Potential formation of dioxins and furans and untreated VOCs CO, CO2, and nitrogen / sulfur oxides Uptime is low = high O&M costs Supplemental fuel costs are rising Scrubber maintenance costs are high Moderate carbon footprint can be high

46
47 chlorinated solvents < 2,000 ppmv petroleum hydrocarbons <4,500 ppmv Potential formation of dioxins and furans and untreated VOCs CO, CO2, and nitrogen / sulfur oxides Uptime is low = high O&M costs Supplemental fuel costs are rising Scrubber maintenance costs are high Moderate carbon footprint can be high
48 (1) Cooling (2) VGAC Polishing (1) Cooling (2) Therm Oxidation (3) VGAC Polishing or (1) Cooling (2) Catalytic Oxidation (3) VGAC Polishing (1) Cooling (2) C3 (3) VGAC polishing (1) Cooling (2) GTR-O (3) VGAC polishing


49 Refrigerated cooling compression and condensation combined with regenerative adsorption NO UPPER LIMIT of VOC concentration NO INLET DILUTION! >100 projects completed >20,000,000 pounds of VOCs treated 28 years in service!

50
51

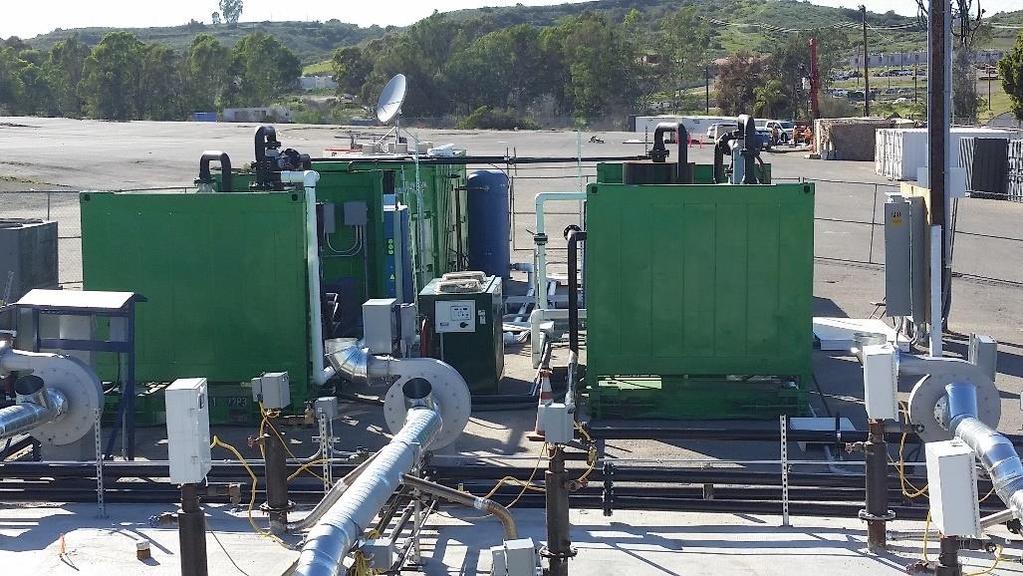

52 Camp Pendleton, CA

53 Flow Rate Power 100 SCFM Pilot test unit 480 VAC 3-ph 100 A & 240 VAC 70 A 200 SCFM 300 SCFM 500 SCFM 480 VAC 3-ph 150 A & 240 VAC 70 A 480 VAC 3-ph 200A & 240 VAC 70 A 480 VAC 3-ph 300 A & 240 VAC 70 A KVA/Hr 45 KVA 75 KVA 105 KVA 170 KVA
54 (1) Cooling (2) VGAC Polishing (1) Cooling (2) Therm Oxidation (3) VGAC Polishing or (1) Cooling (2) Catalytic Oxidation (3) VGAC Polishing (1) Cooling (2) C3 (3) VGAC polishing (1) Cooling (2) GTR-O (3) VGAC polishing
55 Used GTR as Oxidzer


56 800C ~300C Retention time is double of most thermal oxidizer VOCs from >15,000 ppmv to 120 ppmv
57 Case #4
58 Case #4 3-methyl-6-nitrophenol

59 Case #5 GTR-O: simultaneously heating the ground and treating vapor
60 Case #5


61