APPENDIX 3 SAMPLE STATION 3 SLIPPERY ROCK CREEK PA STATE GAME LANDS #95 PROJECT SL
|
|
|
- Della Wiggins
- 5 years ago
- Views:
Transcription
1 APPENDIX 3 SAMPLE STATION 3 SLIPPERY ROCK CREEK PA STATE GAME LANDS #95 PROJECT SL
2
3
4 SAMPLE STATION 3 Discharge Relationships 1. Drainage Area The surface acreage contributing runoff to the monitoring location is estimated to be 4960 acres. 2. Measurement of Discharge The discharge at this monitoring point was observed using two rectangular weirs capable of measuring a discharge range up to 35 c.f.s. Each weir size was 6' opening, 18 inches high. 3. Observed Discharge The observed range of discharge measured at this monitoring point varied from l.38 c.f.s c. f. s. during the sampling. 4. Specific Yield The specific yield of this monitoring point showed the following range: 0.3 c.f.s./1000 acres Minimum yield 6.8 c.f.s./1000 acres man yield The reviewer is directed to refer to the following materials during the discussion of the sample analyses and trends at this monitoring points: a. Sheet 15 - which shows the data plotted-and shows the regression line and field of variance. b. Appendix 3 - which contains the sample data and regression runs 5. ph relationship The ph during the, sampling period varied from Regression analysis of the ph values indicates: An extremely strong relation ship exists where ph values increases as discharge increases. 6. Specific conductance relationship The conductance during the sampling period varied from Regression analysis of the conductance indicates: An extremely strong relationship exists where conductance decreases as discharge increases.
5 Chemical Relationships 1. ph relationship The ph during the sampling period varied from Regression analysis of the ph values showed that An extremely strongrelationship exists where ph values decreases as conductance increases. 2. Acidity/Alkalinity balance (mg/l) The acidity during the sampling period varied from 9-44 Regression analysis of the acidity values indicates: A strong relationship exists where acidity concentration increases as conductance increases. The alkalinity during the sample period varied from 0-l. No regression analysis was attempted as the alkalinity was generally absent. 3. Sulphate relationship (mg/l) The sulphates during the sampling period varied from Regression analysis of. the sulphate values indicates: An extremely strong relationship exists where sulphate concentrations increase as conductance increases. 4. Total iron relationship (mg/l) The total iron during the sampling period varied from Regression analysis of the total iron values indicates: An extremely strong relationship exists where total iron concentrations increase as conductance increases. 5. Ferrous, iron relationship (mg/l) The ferrous iron during the sampling period varied from l.3 Regression analysis of the ferrous iron values indicates A moderate relationship exists where ferrous iron concentration increases, conductance increases. 6. Ferric iron relationship (mg/l) The ferric iron during the sampling period varied from Regression analysis of the ferric iron values indicates: An extremely strong relationship exists where ferric iron concentrations increase as conductance increases.
6
7
8
9
10
11
12
13
14
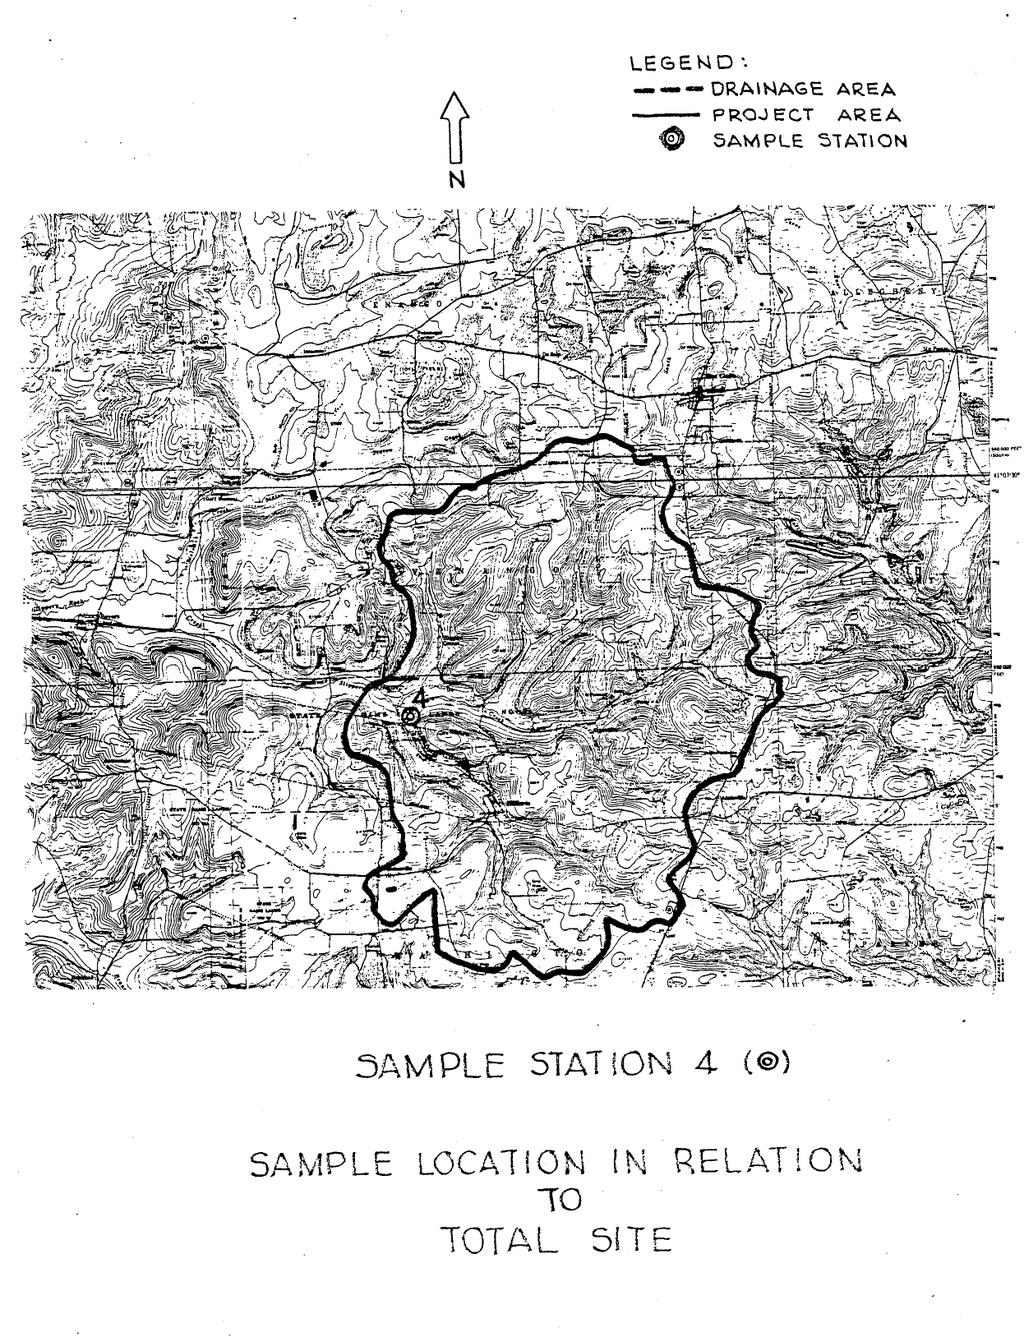
15 APPENDIX 4 SAMPLE STATION 4 DISCHARGE FROM BIG BERTHA ARTESIAN WELL PA STATE GAME LANDS #95 PROJECT SL
16
17
18
19 SAMPLE STATION 4 Discharge Relationships 1. Drainage Area The surface acreage contributing runoff to the monitoring location is estimated to be less than one acre. 2. Measurement of Discharge The discharge at this point was observed using a 90 0 V-notch weir capable of measuring a discharge range up to 0.40 c.f s. Also a continuous recording flag device (bubbler) was used. 3. Observed Discharge The observed range of discharge measured at this monitoring point was.04c.f.s. 4. Specific Yield The specific yield of this monitoring point showed the following range: N.A. c.f.s./1000 acres Minimum yield N.A. c.f.s./1000 acres Maximum yield The reviewer is directed to refer, to the following materials during the discussion of the sample analyses and trends at this monitoring points: a. Sheet.1-4 shows the data plotted and shads the regression line and ield of variance. b. Appendix- which contains the sample data and regression rims. 5. ph relationship ph could not be correlated to discharge since a steady-state, discharge condition exists. 6. Specific conductance relationship Specific conductance could not be correlated to discharge since a steady-state discharge condition exists.
20 Chemical Relationships 1. ph relationship The ph during the sampling period varied from Regression analysis of the ph values showed that: A moderate relationship exists where ph values decreases as conductance increases. 2. Acidity/Alkalinity balance (mg/l) The acidity during the sampling period varied from Regression analysis of the acidity values indicates: An extremely strong relationship exists where acidity concentration increases as conductance increases. The alkalinity during the sampling period varied from Regression analysis of the alkalinity values indicates: An extremely weak relation ship exists where alkalinity concentration decreases as conductance increases 3. Sulphate relationship (mg/l) The sulphates during the sampling period varied from Regression analysis of the sulphate values indicates: An extremely strong relationship exists where sulphate concentrations increase as conductance increases. 4. Total iron relationship (mg/l) The total iron during the sampling period varied from Regression analysis of the total iron values indicates: An extremely strong relationship exists where total iron concentrations increase as conductance increases. 5. Ferrous iron relationship (mg/l) The ferrous iron during the sampling period varied from Regression analysis of the ferrous iron values indicates: A strong relationship exists where ferrous iron concentrations increase as conductance increases. 6. Ferric iron relationship (mg/l) The ferric iron during the sampling period varied from 2-15 Regression analysis of the ferric iron values indicates: A weak relationship exists where ferric iron concentrations increase as conductance increases.
21
22
23
24
25
26
27
28
29
30