Charting the Path to 100% Renewable
|
|
|
- Melvin Adams
- 5 years ago
- Views:
Transcription


1 Charting the Path to 100% Renewable Photo: Luminalt Danielle Murray Renewable Energy Program Manager San Francisco Department of Environment
2 Guiding Climate & Energy Policies in San Francisco Climate Change Goals Ordinance (2008) Set aggressive citywide GHG reduction targets Encouraged pursuit of GHG-free electricity by 2030 SF Climate Action Plan Inventories emissions from waste, transport & energy Outlines strategies to meet local, state & Kyoto targets SF Electricity Resource Plan Achieve GHG-free electricity supply by 2030 Maximize Energy Efficiency Develop Renewable Power Assure Reliable Power Support Affordable Electric Bills Support Environmental Justice Improve Air Quality and Prevent Other Environmental Impacts Promote Opportunities for Economic Development Increase Local Control Over Energy Resources SF GHG Targets 20% reduction by % reduction by % reduction by % reduction by 2050 vs 1990 levels
3 CO2e (MMT) 8.0 SF Citywide CO 2 Emissions Are On Track to Beat Upcoming International and State Targets Kyoto (intl SF target) Actual (14.5%) (7%) AB32 (CA target) (0%) 17.8% (20%) SF target SF target (25%) SF target (40%) (49.3%) SF target (80%) SF (actual) SF (no action) SF (new measures)
4 San Francisco s GHG Profile (2011) BART & MUNI 2% Caltrain & Ferry 1% Waste landfilled 5% Residential Electricity 5% Commercial Electricity 17% Municipal Electricity 0% Emissions Sources: Waste 5% Electricity 23% Natural Gas 32% Transport 45% Private Vehicles 40% Residential Natural Gas 15% Municipal Natural Gas 2% Commercial Natural Gas 13% Total: 5,058,389 tonnes CO 2 (14.5% below 1990)
5 San Francisco s Electricity Supply SF Electricity Providers Direct Access: 8% SFPUC: 15% PG&E: 76% 36% Fossil Fuels (2011) 5% 15% 16% RPS-Eligible Renewables 0.2% 1% PG&E RPS SFPUC RPS DA RPS PG&E Large Hydro SFPUC Large Hydro DA Large Hydro PG&E Nuclear DA Nuclear PG&E Fossil DA Fossil 31% 1% 15% 14% 30% Large Hydro 18% Nuclear 17% 1%
6 SAN FRANCISCO RENEWABLE ENERGY EFFORTS TO DATE
7 San Francisco s Clean Energy Efforts & Accomplishments Closed Fossil Fuel Power Plants Potrero and Hunter s Point Reducing Energy Demand Green Building Ordinance: LEED Gold + required Existing Commercial Buildings Energy Performance Ordinance Residential Energy Conservation Ordinance SF Energy Watch audits and incentives Developing Local Renewables 10 MW Municipal Solar PV & Biogas 16 MW Solar PV on private buildings Streamlined solar permitting GoSolar SF incentive program Addressing Financing PACE financing: GreenFinanceSF Green Tenant Toolkit Aggregated purchasing & financing: Solar@Work, SF SunShares Education & Outreach SF Energy Map ( Solar Water Heating & PV public outreach Free solar site assessments Providing 100% Renewable Power Municipal power:100% hydro, solar, biomass, RPS CleanPowerSF: 100% renewable power for residents and businesses when implemented
 Residential: 3,524 systems; 10.4 MW (DC) Commercial/Non-profit: 202 systems; 5.7 MW (DC) Municipal: 13 systems; 7.")
8 Total # of Systems Installed Installed Capacity (kw DC) San Francisco Solar PV Installations ( ) Capacity (kw DC) Total # of Systems Installed 4,000 3,500 3,000 Current Totals: 3,739 systems; 23.4 MW (DC) Residential: 3,524 systems; 10.4 MW (DC) Commercial/Non-profit: 202 systems; 5.7 MW (DC) Municipal: 13 systems; 7.4 MW (DC) Sunset Reservoir 2,812 3,577 *3,739 25,000 22,500 20,000 17,500 2,500 2,232 15,000 2,000 1,500 GoSolarSF 1,721 12,500 10,000 1, ,017 CSI ,500 5,000 2,500 - Year *As of March 31, 2013

 and Davies Symphony Hall (200 kw) Moscone Center 675")
9 13 projects completed, totaling 7.4 MW Sunset Reservoir: 5 MW Moscone Convention Center: 675 kw San Francisco International Airport: 500 kw Under construction: City Hall (100 kw) and Davies Symphony Hall (200 kw) Moscone Center 675 kw (2004) Sunset Reservoir 5MW (2010)

10 o Awareness building / market development o Technical assistance o Streamlined permitting o Solar for multi-tenant buildings and renters VNM; Community Solar o Targeted outreach & aggregation programs Large commercial roofs Schools BC3 & CCSF Employees o Finance facilitation

11 Local incentive for PV installs (residential, commercial, and non-profit) Began in 2008 $2 to 5 million annual funding Additional incentives for Environmental Justice neighborhoods, low-income applicants, and local installers Installers must participate in the City s Workforce Development Program to be eligible Results to date: 6.2 MW solar power installed or in progress (2,138 systems) $16.9 m in incentives paid out, $11 million to low-income households & non-profits >100 green jobs through workforce development program


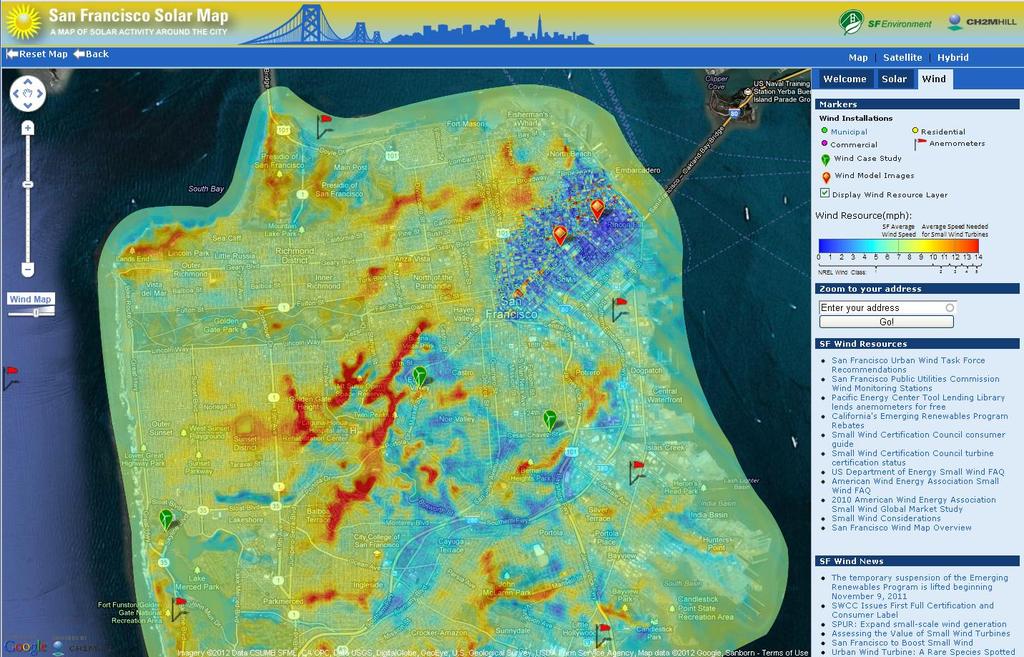
12 Shows users: All PV and SWH installs in city, with case studies Estimated rooftop PV potential (KW and KWh) Estimated electric bill savings Estimated CO2 reduction Rebates & tax credit info Cost estimator / financial analysis Link to local solar installers Developed First US City to Create Solar Map Won 2008 IREC Innovation Award Other city solar maps modeled on SF s Berkeley, Los Angeles, San Diego, Sacramento, Portland sf.solarmap.org
13

14


15


16 National Park Service s Crissy Field Center 5 VAWTs, Solar PV and EV Charging Energy monitoring & public education America s Cup VAWT demo Visible connection between sailing and wind power for 500,000 visitors 5 VAWTs totaling 6.8kW installed last month at NPS Crissy Field Center Randall Museum Energy Garden Demonstration & public education opportunity Currently hosts one VAWT and kinetic sculpture Windy Corona Heights location SF Ports Wind-powered off-grid lighting exploration Randall Museum VAWT


17 Study area: Southwest Ocean Outfall Feasibility study completed fall MW wave farm could produce: 100 gigawatt-hours (GWh) annually cost in the range of 17 to 22 /kwh Completed environmental studies Gray whale & sediment transport


18
19 MOVING FORWARD


20 Goal: 100% Renewable -Meet all of San Francisco s electricity demand with renewable resources by 2020-

21 Comprised of local clean energy leaders, business and community stakeholders, representatives from environmental NGOs, labor, utilities, and relevant city departments Dec 2010 Mayor Newsom announces 100% renewable goal Jan 2011 Mayor Lee establishes Task Force Feb 2011-May 2012 Monthly Task Force meetings September 2012 Task Force report released
22 Task: Provide recommendations to help city achieve 100% renewable electricity supply within 10 years. Barriers & Opportunities Addressed: Policy Regulatory Technical Financial Public Awareness Outlined Recommendations Related to: Energy Efficiency Distributed / Local Generation Utility-Scale Generation
23 Strategies Identified to Meet 100% Renewable Goal Shrink the Pie: Increase Energy Efficiency Encourage Local Renewable Energy Break Down Barriers for Multi-Tenant Buildings & Occupants Expand Access to Local Renewable Energy Provide 100% Renewable Power Purchasing Options Encourage Private Sector Investment in Renewable Energy


24 Shrink the Pie Reducing total electricity demand reduces the amount of renewable energy needed to meet 100% goal. Actions Promote energy audits and retrofits Energy Watch BayREN & EnergyUpgrade CA Tighten building code energy requirements (CalGreen) Strengthen retrofit on resale rules (RECO) Facilitate access to energy data Integrate green building & energy labeling into assessor-recorders database Commercial Building Ordinance Data from utilities for climate planning

25 Encourage Local Renewable Energy Local distributed electricity generation reduces transmission needs, improves local energy security, and keeps our energy dollars in the local economy. Actions Reduce soft-costs Streamlined solar permitting, moved to e-permitting Aggregated purchasing program: SF SunShares PACE financing for commercial Ensure net metering available Provide stable funding for GoSolarSF incentive program Develop feed-in tariff for local renewables under CleanPowerSF Adopt a Solar Ready Policy Address solar system shading


26 Break Down Barriers for Tenants & Expand Access to Local Renewables With >60% households renting, it is critical to reduce disincentives for energy efficiency & renewable energy on multi-tenant properties. Expanding access to off-site renewable energy helps democratize the renewable energy economy and increases local economic development. Actions Expand understanding and use of Virtual Net Metering Support Community Renewable Energy legislation SB43 passed Enable energy efficiency and renewable energy pass-throughs under rent control rules Encourage solar water heating in multi-family buildings


27 Provide 100% Renewable Energy Purchasing Options Renewable power purchasing options are necessary to supply power not generated locally & provide consumer choice. Actions Implement 100% renewable community choice aggregation program, CleanPowerSF Encourage robust utility green power purchasing programs PG&E Green Option Expand deliveries of 100% renewable municipal power Make SFPUC default power provider for city properties & tenants Provide renewable SFPUC power for SF transit providers and new development areas

28 Encourage Private Sector Investment in Renewable Energy Private sector investment is critical to ensuring that renewable energy projects are built to meet new demand. Actions Expand & reduce cost of clean energy financing Utilize low-interest bonds Support crowd funding Support project aggregation Engage pension fund in clean energy investment Leverage CCA to spur renewable energy development PPAs Feed-in tariff On-bill financing Provide cleantech demonstration opportunities


29 Danielle Murray Renewable Energy Program Manager San Francisco Department of Environment (415) SF Environment All Rights Reserved The author of this document has secured the necessary permission to use all the images depicted in this presentation. Permission to reuse or repurpose the graphics in this document should not be assumed nor is it transferable for any other use. Please do not reproduce or broadcast any content from this document without written permission from the holder of copyright.