Albion Park Quarry Annual Environmental Management Report
|
|
|
- Paul Ford
- 5 years ago
- Views:
Transcription
1 DoP SUBMISSION Cleary Bros (Bombo) Pty Ltd Albion Park Quarry Annual Environmental Management Report Period 1 July June 2012 Reference GEN Cleary Bros (Bombo) Pty Ltd 39 Five Islands Road PO Box 210 Port Kembla NSW 2505 Telephone Facsimile
2 CONTENTS 1 INTRODUCTION 1.1 BACKGROUND OBJECTIVES OF THE AEMR 7 2 SITE DESCRIPTION AND ACTIVITIES 2.1 SITE IDENTIFICATION WORKS COMPLETED IN PERIOD WORKS TO BE COMPLETED IN THE NEXT PERIOD QUARRY PRODUCTION 12 3 REVIEW OF ENVIRONMENTAL MONITORING DATA 3.1 GROUNDWATER MONITORING QEMP REQUIREMENT PERFORMANCE TARGETS GROUNDWATER MONITORING RESULTS GROUNDWATER MONITORING INTERPRETATION SURFACE WATER MONITORING QEMP REQUIREMENT QEMP PERFORMANCE TARGETS LICENCE REQUIREMENT SURFACE WATER MONITORING RESULTS SURFACE WATER TESTING RESULTS INTERPRETATION AIR QUALITY MONITORING QEMP REQUIREMENTS LICENCE REQUIREMENTS AIR QUALITY CRITERIA AIR QUALITY MONITORING AIR QUALITY TESTING RESULTS INTERPRETATION NOISE MONITORING QEMP REQUIREMENTS NOISE PERFORMANCE CRITERIA NOISE MONITORING RESULTS NOISE MONITORING RESULTS INTERPRETATION BLAST MONITORING QEMP REQUIREMENTS PERFORMANCE TARGETS BLAST MONITORING RESULTS
3 CONTENTS BLAST MONITORING RESULTS INTERPRETATION METEOROLOGICAL MONITORING QEMP REQUIREMENTS COMPLIANCE ASSESSMENT ECOLOGICAL MONITORING QEMP REQUIREMENTS COMPLIANCE ASSESSMENT 80 4 COMPLAINTS 4.1 QEMP REQUIREMENT TABULATED RESULTS ENVIRONMENTAL COMPLAINTS RESULTS INTERPRETATION 82 5 REVIEW OF QEMP PLANS 5.1 WATER MANAGEMENT PLAN VEGETATION MANAGEMENT PLAN REHABILITATION MANAGEMENT PLAN HERITAGE MANAGEMENT PLAN WASTE MINIMISATION 85 6 CONCLUSIONS 7 RECOMMENDATIONS ANNEXES ANNEX A NSW INDUSTRY AND INVESTMENT (DPI) RETURN ANNEX B ENVIRONMENTAL MONITORING LOCATIONS ANNEX C LETTER FROM PAE HOLMES DATED 12 JULY 2012 ANNEX D INTERIM 6 MONTHLY ECOLOGICAL AND REHABILITATION MONITORING K.MILLS ANNEX E ANNUAL ECOLOGICAL AND REHABILITATION MONITORING K.MILLS - 2 -
4 FIGURES FIGURE 1 FIGURE 2 FIGURE 3 LOCALITY PLAN WORKS COMPLETED ENVIRONMENTAL MONITORING LOCATIONS - 3 -
5 ABBREVIATIONS AEMR CB DC DECCW DP DoP EIS EPA EPL HVAS Annual Environmental Management Report Cleary Bros (Bombo) Pty Ltd Development Consent Department of Environment, Climate Change and Water (now EPA) Deposited Plan Department of Planning Environmental Impact Statement Environment Protection Authority (formerly OEH and DECCW) Environment Protection Licence High Volume Air Sampler L Aeq(15min) Continuous Equivalent Noise Level for a 15 Minute Period LEC MW OEH QEMP WMP Land & Environment Court Monitoring Well Office of Environment and Heritage (now EPA) Quarry Environmental Management Plan Water Management Plan - 4 -
6 - 5 -
7 1 INTRODUCTION 1.1 BACKGROUND Cleary Bros (CB) has extracted and processed hard rock from a succession of quarries in the Albion Park area since the middle of last century. On 21 February 2006 the Land and Environment Court (LEC) granted development consent for the company to extend quarrying into a new area, about 400 metres south east from the then operating quarry. Following negotiations with the intervening land owner, Rinker (now Cemex), Shellharbour City Council on 10 May 2007 granted development consent for an access road linking the quarry extension with the existing haul road to Cleary Bros crushing plant. A short road crossing the approved quarry access road to maintain access to Rinker property from Dunsters Lane was also approved. On 30 June 2009 the Executive Director, Major Projects Assessment of the Department of Planning, as delegate for the Minister for Planning, approved a modification to the LEC consent. The modification increased the maximum production from the quarry to 600,000 tonnes of quarry products per annum. Production quarrying commenced in early August Operation of the hard rock quarry is licensed by the Environment Protection Authority (EPA), formerly the Office of Environment and Heritage (OEH) and the Department of Environment, Climate Change and Water (DECCW). CB operates in accordance with the site s Quarry Environmental Management Plan (QEMP) consistent with the requirements of the court approval and Environment Protection Licence (EPL) as amended by DECCW in January 2011 in consultation with CB with the following amendments: The quarry area has been included and a licensed discharge point (Point 6) added. The watercourse west of the Quarry Manager s office (Point 7) that CB were monitoring for internal purposes in the past has been included for monitoring purposes. The permissible start time window for blasting has been changed to 9:00am. The limits on the Supertreat system have been removed and now noted as part O4.1 as quality limits which still need to be tested and reported, and when reached, require the Supertreat system to be serviced and the effluent to be monitored weekly until the quality limits are achieved
8 Meteorological Monitoring has been included for monitoring purposes (the requirements mirror the Consent Conditions). The location of the property is shown on Figure OBJECTIVES OF THE AEMR The objectives of the AEMR are to satisfy the requirements for an AEMR included in the development consent issued by the Land and Environment Court. The relevant conditions of LEC consent number of 2005 are reproduced below: - 7 -
9 Condition Schedule 3 Condition 9 The Applicant shall: Requirement a) Provide annual production data to the DPI using the standard form for that purpose; and b) include a copy of this data in the AEMR. Schedule 4 Condition 33 Each year, the Applicant shall: a) review the Water Management Plan; b) update each sub-plan; and c) report the results of this review in the AEMR, Including: d) the results of monitoring;. e) details of the review for each sub-plan; f) amendments to the sub-plans; and g) details of the measures undertaken/ proposed to address any identified issues. Schedule 4 Condition 38 The Applicant shall include a progress report on the implementation of the Vegetation Management Plan in the AEMR. Schedule 4 Condition 44 The Applicant shall include a progress report on the Rehabilitation Management Plan in the AEMR. Schedule 4 Condition 53 The Applicant shall include a progress report on the Heritage Management Plan in the AEMR Schedule 4 Condition 60 The Applicant shall describe what measures have been implemented to minimise the amount of waste generated by the development in the AEMR
10 Schedule 5 Condition 5 The Applicant shall.prepare and submit an Annual Environmental Management Report (AEMR) to the Director-General and the relevant agencies. This report must: (a) identify the standards and performance measures that apply to the development; (b) describe the works carried out in the last 12 months; (c) describe the works that will be carried out in the next 12 months; (d) include a summary of the complaints received during the past year, and compare this to the complaints received in previous years; (e) include a summary of the monitoring results for the development during the past year (f) include an analysis of these monitoring results against the relevant: impact assessment criteria; monitoring results from previous years; and predictions in the EIS; (g) identify any trends in the monitoring results over the life of the development; (h) identify any non-compliance during the previous year; and (i) describe what actions were, or are being, taken to ensure compliance
11 - 10 -
12 2 SITE DESCRIPTION AND ACTIVITIES 2.1 SITE IDENTIFICATION The site comprises Lot 1 DP (active quarry) and Lot 23 DP (processing plant, site entrance product storage and sale). The haul road connecting the quarry to the processing plant traverses Lot 2 DP Lot 1 is owned by Bridon Pty Ltd, a member of the Cleary Bros group of companies. Lot 23 is owned by CB and Lot 2 is owned by Rinker Australia (now Cemex). The site is located within the City of Shellharbour. Access to the extraction area is from East-West Route via the processing plant. The land approved for extraction has an area of hectares. The quarrying process involves removing overburden from the hard rock resource, loosening the rock by blasting, excavating the broken basalt and loading to off-road trucks for delivery to the processing plant. At the processing plant hard rock is crushed, screened and classified into various products for stockpiling on site prior to sale and delivery. There are two layers of hard rock in the extraction area over a sandstone base. When sufficient area of the sandstone base has been exposed, backfilling will commence using overburden extracted during the quarrying process. 2.2 WORKS COMPLETED IN PERIOD Normal quarry production was carried out during the reporting period of July 2011 to June 2012 and has continued across the base of the extraction area as shown on Figure WORKS TO BE COMPLETED IN THE NEXT PERIOD In the period July 2012 to June 2013 quarry extraction will continue in the current excavation which will be progressively deepened to expose the sandstone base and extended to the north, as shown on Figure
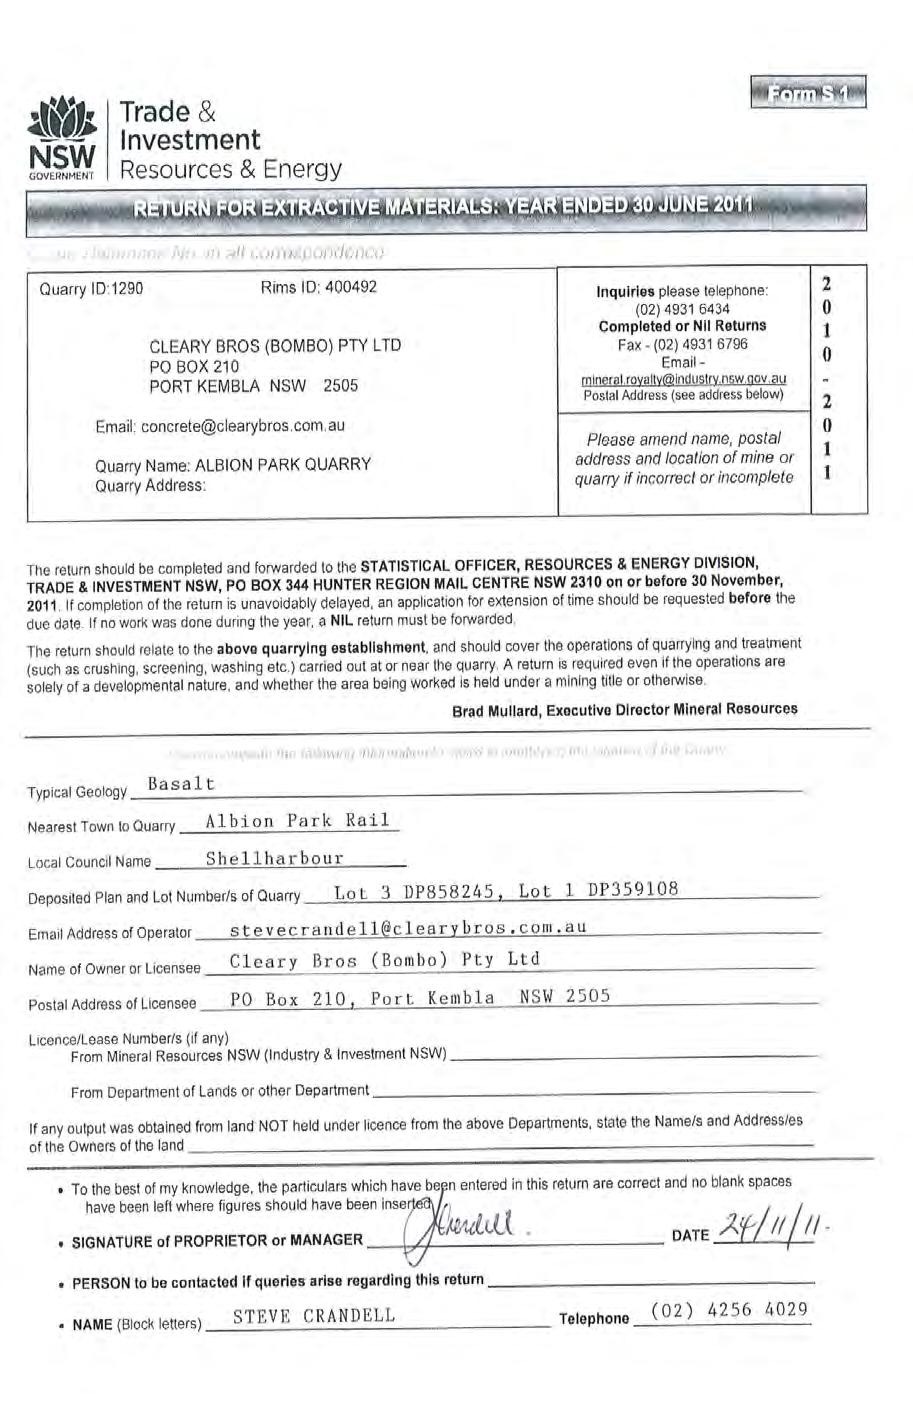
13 2.4 QUARRY PRODUCTION During the reporting period covered by this AEMR, one annual return was forwarded to NSW Industry and Investment (formerly Department of Primary Industries), covering the 12 months ending 30 June This return indicates a total of 510,113 tonnes of quarried basalt was produced and sold. This figure indicates that the annual production was below the target of 600,000 tonnes. The annual production in the 12 month period up to 30 June 2012 indicates 558,308 tonnes of basalt was extracted from the extended quarry area which is the subject of this consent. Approximately 273,000 tonnes of overburden was removed from other areas of the site. A copy of the return up to 30 June 2011 to NSW Industry and Investment is included as Annexure A. The next annual return to NSW Industry and Investment is due by 30 September

14 Figure 2: Works Completed
15 3 REVIEW OF ENVIRONMENTAL MONITORING DATA This is the third AEMR submitted for the Albion Park Quarry following its extension into Lot 1 DP Monitoring data refers primarily to the reporting period from 1 July 2011 to 30 June GROUNDWATER MONITORING QEMP REQUIREMENT Three groundwater monitoring stations were established prior to the quarry being developed. Two of the monitoring locations (MW1 & MW2) contain shallow and deep monitoring wells while the third, MW3, contained only a deep well. The wells are located down gradient to the south of the quarry as shown on Annexure B. The QEMP refers to the source document for water monitoring, Surface Water and Groundwater Management/Monitoring Plan (Golder Associates 2005) and reproduces the requirements for groundwater monitoring. The Golder document is part of the Water Management Plan referred to in the development consent. Golder proposed in the plan that groundwater be sampled three monthly for the first two years (from 2004) and six monthly thereafter. Production quarrying commenced in early August There is no groundwater monitoring requirement in the EPL PERFORMANCE TARGETS Golder (and the QEMP) reports that the initial purpose of groundwater quality monitoring is to establish, over several years, the normal range of variability in the parameters being monitored. This is to be used as a base to observe any unusual variation in subsequent years. Consequently there are no performance targets. The analytes for measurement, recommended by Golder, are listed below:
16 Field measuremen t Laboratory analysis Analyte Water level Conductivity ph Units m µs/cm ph Temperature C ph Total Dissolved Solids (TDS) Total Suspended Solids (TSS) Sodium Potassium Calcium Sulphate Chloride Nitrate Nitrite Alkalinity Total Kjeldahl Nitrogen (TKN) Bicarbonate Oil and grease Biochemical Oxygen Demand (BOD) Total organic carbon (TOC) Ammonia Total phosphorus Dissolved metals ph mg/l mg/l mg/l mg/l mg/l mg/l mg/l mg/l mg/l mg/l mg/l mg/l mg/l mg/l mg/l mg/l mg/l mg/l Golder recommends that the analytes and monitoring frequency should be revised after the first three years. This AEMR provides the opportunity for that revision GROUNDWATER MONITORING RESULTS Groundwater monitoring sampling is scheduled to occur every six months. One of the monitoring wells, MW3D, was located within the quarrying area and was destroyed by quarry development prior to the reporting period
17 Historical data from the Golder report refers to a 12-month period prior to any works commencing on the quarry site (Lot 1 DP ). Monitoring results are summarised by analyte to assist graphical presentation. a) Depth (m) Borehole Dec-11 Jun-12 Historical Range* MW1D MW1S MW2D MW2S MW3D * Sept 2004 to Sept 2005 (Golder) Depth means the vertical distance from the (surveyed) ground surface to the water level within the monitoring well. In two of the shallow boreholes water level has remained fairly static with MW2S displaying an increasing trend which is within the historical ranges. The level of the water from the top of the bore to the top of the water has progressively declined in the deep boreholes MW1D and MW2D which means the water level height in the bore is increasing. However similar variability has already been
18 established for well MW2D prior to the commencement of quarrying. Golder monitored the wells from Sept 2004 to Sept 2005 and reported water level in MW2D ranging from 8.76 m to m. The historical results for MW1D for this same period were 21.52m to 24.35m. This is consistent with Golders October 2005 report that identified that the site model comprises groundwater flow in two aquifers; (1) Perched (shallow) groundwater within the thin residual zone (soil and weathered bedrock overlying the fresh bedrock mass, and (2) The regional bedrock (deep) aquifer developed with the latite, agglomerate and sandstone sequence which is regionally dominant. In addition, Golder s report also states the two shallow groundwater monitoring wells (MW1S and MW2S) show that this aquifer is not generally supplied by the deep (bedrock) aquifer. The site monitoring results indicate that whilst there has been an increase in the water table height in the deep boreholes, the shallow monitoring wells have remained fairly static (as predicted by Golder). b) Conductivity (µs/cm) Borehole Dec-11 Jun-12 Historical Range* MW1D MW1S MW2D MW2S * December 2004 to September 2005 (Golder)
19 Conductivity is essentially a measure of salinity. Groundwater conductivity has ranged between the typical level of fresh drinking water (100 µs/cm) and brackish water (about 2,000 µs/cm). Conductivity has shown a fairly stable trend fluctuating in this range over the reporting period and trending below the historical range. c) ph Borehole Dec-11 Jun-12 Historical Range* MW1D MW1S MW2D MW2S * December 2004 to September 2005 (Golder)
20 The ph of groundwater has remained stable during the reporting period, ranging from slightly acidic (6.4) to slightly alkaline (7.4). The maximum movement in any monitoring well has been 0.8 of a ph unit and the range is generally trending slightly below historic data collected prior to quarrying. d) Temperature ( C) Borehole Dec-11 Jun-12 Historical Range* MW1D MW1S MW2D MW2S
21 * December 2004 to September 2005 (Golder) As expected water temperature has fluctuated according to the season and remains consistent with the historical range. e) Total Dissolved Solids (mg/l) Borehole Dec-11 Jun-12 Historical Range* MW1D MW1S MW2D MW2S * December 2004 to September 2005 (Golder)
22 The concentration of total dissolved solids is generally trending slightly below the historical averages, with the exception of MW2S which is trending marginally above the historical range. The shape of the curve for each borehole has similarities to those presented for conductivity, sodium and calcium, as expected. f) Total Suspended Solids (mg/l) Borehole Dec-11 Jun-12 Historical Range* MW1D MW1S MW2D MW2S * December 2004 to September 2005 (Golder)
23 Total suspended solids were generally low and within the historical ranges. It is noted that borehole MW2S reported a reading of 1,660 mg/l in December 2011, however this returned to low levels in June g) Sodium (mg/l) Borehole Dec-11 Jun-12 Historical Range* MW1D MW1S MW2D MW2S * December 2004 to September 2005 (Golder)
24 Sodium levels are a further indicator of groundwater salinity and have remained within a consistent band during the reporting period which are generally trending lower than the historical range. Results are consistent with the historical range. h) Potassium (mg/l) Borehole Dec-11 Jun-12 Historical Range* MW1D MW1S 1 < MW2D MW2S <1 < < means less than the limit of detection. * December 2004 to September 2005 (Golder)
25 Potassium levels have generally remained very low. Results are generally less than the historic maxima (noting MW1D) was 1.1 mg/l above the historical maximum for this analyte and in some cases are lower than the previous minima. i) Calcium (mg/l) Borehole Dec-11 Jun-12 Historical Range* MW1D MW1S MW2D MW2S * December 2004 to September 2005 (Golder)
26 Calcium results have remained fairly stable for the sampling occasions. Results are generally trending lower than the historical range. j) Sulphate (mg/l) Borehole Dec-11 Jun-12 Historical Range* MW1D MW1S MW2D MW2S <5-70 * December 2004 to September 2005 (Golder) The sulphate concentrations for MW1D and MW2D are all below the historical range and for MW1S is within the historical range. The sulphate concentration for MW2S is
27 marginally above the historical range, however has remained stable during the past four years. k) Chloride (mg/l) Borehole Dec-11 Jun-12 Historical Range* MW1D MW1S MW2D MW2S * December 2004 to September 2005 (Golder) The current chloride results show a stable trend, with levels that are below the historical range for MW1D and MW2D. The chloride levels for MW2S are within the historical range. The chloride level of MW1S is only slightly above the historical ranges and displays a stable trend. l) Nitrate (mg/l) Borehole Dec-11 Jun-12 Historical Range* MW1D MW1S <0.05 MW2D <0.05 MW2S m) < means less than the limit of detection. * December 2004 to September 2005 (Golder)
28 Nitrate results in all boreholes are consistently low this reporting period. The nitrate results for MW2D and MW2S were both trending upwards in the previous reporting period ( ), however they have returned to low levels during this reporting period. n) Nitrite (mg/l) Borehole Dec-11 Jun-12 Historical Range* MW1D <0.01 <0.01 <0.06 MW1S <0.01 <0.01 <0.06 MW2D <0.01 <0.01 <0.06 MW2S <0.01 <0.01 <0.06 o) < means less than the limit of detection. * December 2004 to September 2005 (Golder) The results for nitrite are negligible and not able to be meaningfully graphed. The historic range is based on limited samples. p) Alkalinity (mg/l) Borehole Dec-11 Jun-12 Historical Range* MW1D MW1S MW2D MW2S * December 2004 to September 2005 (Golder)
29 Analytical reports for alkalinity provide the sum of hydroxide alkalinity, carbonate alkalinity and bicarbonate alkalinity. The first two components have been less than the detectable limit, meaning that the alkalinity results are a measure of bicarbonate alkalinity. The results have remained within a band and below the historic maxima. q) Total Kjeldahl Nitrogen (mg/l) Borehole Dec-11 Jun-12 Historical Range* MW1D MW1S MW2D MW2S * December 2004 to September 2005 (Golder)
30 Total nitrogen at high levels could lead to enhanced algal growth when the groundwater eventually surfaces and enters the creek system. Levels of nitrogen recorded have been consistently low, with levels below or equal to the minima of the historical range. r) Bicarbonate (mg/l) The results for bicarbonate are identical to the results for alkalinity. s) Oil and Grease (mg/l) Borehole Dec-11 Jun-12 Historical Range* MW1D <5 <5 <5-7 MW1S <5 <5 <5-5 MW2D <5 <5 <5 MW2S <5 <5 <5 < means less than the limit of detection. * December 2004 to September 2005 (Golder) Oil and grease is not able to be meaningfully graphed. The concentration of oil and grease has been very low and is consistent with the historical range, which is based on limited results. t) Biochemical Oxygen Demand (mg/l) Borehole Dec-11 Jun-12 Historical Range* MW1D 3 <2 <4-6.0 MW1S <2 <2 <2-2.0 MW2D 3 <2 <2 MW2S <2 <2 <2 u) < means less than the limit of detection. * December 2004 to September 2005 (Golder) The results for BOD are mostly negligible and not able to be meaningfully graphed. Historical results are also negligible. v) Total Organic Carbon (mg/l) Borehole Dec-11 Jun-12 Historical Range* MW1D < MW1S MW2D MW2S * December 2004 to September 2005 (Golder)
31 The concentrations of Total Organic Carbon are low this reporting period and within or below the historical averages. The trend is stable. w) Ammonia (mg/l) Borehole Dec-11 Jun-12 Historical Range* MW1D < MW1S < MW2D < < MW2S < < < means less than the limit of detection. * December 2004 to September 2005 (Golder) The results for Ammonia are negligible and not able to be meaningfully graphed. x) Total Phosphorus (mg/l) Borehole Dec-11 Jun-12 Historical Range* MW1D MW1S MW2D MW2S * December 2004 to September 2005 (Golder) phosphorus was not analysed
32 Concentrations of phosphorus in the groundwater have remained low. The trend is stable. y) Total Dissolved Metals (mg/l) Total dissolved metals includes the concentrations of arsenic, cadmium, chromium, copper, iron, lead, mercury, nickel & zinc. Each of these analytes is tabulated separately below. Many of the metals were not detected in the analysis until the June 2010 samples where the lower level of detection resulted in a trace being identified for some metals. The absence of continuity means the results are not able to be meaningfully graphed
33 Groundwater Monitoring Results for Dissolved Metals (mg/l) Borehole MW1D MW1S MW2D MW2S Historical Dec-11 Jun-12 Dec-11 Jun-12 Dec-11 Jun-12 Dec-11 Jun-12 Highest* Arsenic <0.001 < <0.001 <0.001 <0.001 <0.001 < Cadmium < < < < < < < < ND Chromium <0.001 <0.001 <0.001 <0.001 <0.001 <0.001 <0.001 < Copper Iron <0.05 < <0.05 <0.05 <0.05 < Lead <0.001 <0.001 <0.001 <0.001 <0.001 <0.001 <0.001 < Mercury < < < < < < < < ND Nickel Zinc * highest reading in any borehole from December 2004 to September 2005 (Golder). ND = not previously detected
34 Arsenic is detected in one sample in MW1S in December 2011, however at very low (almost negligible levels). Cadmium, Chromium and Mercury are at levels below the level of detection. Copper, lead, nickel and zinc have remained consistent at very low levels. The highest concentration occurred for dissolved iron and was below the historical highest value, which is likely to be sourced from the geological strata. The results indicate that metal concentrations are very low. The concentration of dissolved metals measured during the reporting period are all below the historically highest concentration, except for iron and copper GROUNDWATER MONITORING INTERPRETATION The purpose of groundwater monitoring is to determine a baseline for groundwater parameters and then observe whether there is any unusual variation over the life of the quarry. Monitoring commenced in 2004 at quarterly intervals and subsequently reduced to six-monthly intervals. During the period covered by this AEMR groundwater parameters have remained within a satisfactory range generally consistent with the historical data for from the Golder report. Groundwater levels are relevant for: determining the quantity of water to be reinjected downslope of the quarry; and assessing the findings of ecological monitoring of the vegetation downslope of the quarry. Groundwater levels have remained generally stable in the two shallow boreholes MW1S and MW1D, however for the two deep boreholes MW2D and MW2S a progressive downwards trend in the readings has occurred which indicates that the water table is increasing as the readings are a measure from the top of casing to the top of water level. As described above, this is consistent with Golders October 2005 report that identified that there are two aquifers; (1) Perched (shallow) groundwater overlying the fresh bedrock mass, and (2) The regional bedrock (deep) aquifer developed with the latite, agglomerate and sandstone sequence which is regionally dominant
35 In addition, Golder s report also states the two shallow groundwater monitoring wells (MW1S and MW2S) show that this aquifer is not generally supplied by the deep (bedrock) aquifer. The site monitoring results indicate that whilst there has been an increase in the water table height in the deep boreholes, the shallow monitoring wells have remained fairly static (as predicted by Golder). A review of the depth data for the boreholes indicates that the shallow boreholes (MW1S and MW2S) are stable and that future readings will continue to be stable. The deep boreholes (MW1D and MW2D) have shown a downwards trend which indicates that the water table has increased. It is predicted that the deep boreholes will stabilise at this increased water table in future readings. The chemical analytes of all boreholes tested to date show that the readings are generally within the historical ranges. It is expected that this trend will continue for future readings. A number of analytes have demonstrated concentrations that suggest continued monitoring is not necessary. It is recommended that analysis be discontinued for the following analytes: Bicarbonate ( results identical to alkalinity) Nitrite (negligible results) Ammonia (negligible results) Mercury (not detected) Arsenic, cadmium, chromium and lead. The need to replace deep monitoring well MW3D has been reviewed. considered a number of factors in this review: Golder A record of historic data has been obtained from MW3D, that may not be reliable as a before quarrying case for comparison with data obtained from a replacement well in a nearby location MW3D was difficult to install because of local conditions, which is the reason a second shallow well was not installed at the time The remaining wells at the MW1 and MW2 sites should be adequate to monitor the groundwater effects of the quarry. Golder recommended that MW3D not be replaced at this time, but considered that should future monitoring results from the other wells indicate deteriorating
36 conditions, an additional well be further considered in a suitable location at that time Consequently it is recommended that a deep monitoring well to replace the destroyed MW3D not be installed at this time
37 3.2 SURFACE WATER MONITORING QEMP REQUIREMENT The QEMP specifies two surface water monitoring sites within the quarry extension land, located at stream gauging stations established prior to the quarry extension being developed. The monitoring points are outside the extraction area as shown on Figure 3: Watercourse 1 the small watercourse draining the extraction area; Watercourse 2 the larger watercourse entering the property from the west and flowing along the southern property boundary. The source of water for Watercourse 1 will be eventually removed by the expanding quarry. The monitoring point on Watercourse 2 samples water entering the site from the adjacent property. It is unlikely to be affected by overland flow from disturbed areas on Cleary Bros property. The QEMP refers to the source document for water monitoring, Surface Water and Groundwater Management/Monitoring Plan (Golder Associates 2003) and reproduces the requirements for surface water monitoring. The Golder document is part of the water management plan referred to in the development consent. Golder proposed that surface water be sampled fortnightly for a year (from 2004), then three monthly for a year and six monthly thereafter. Fortnightly samples were to be tested for a small range of analytes with a larger range of testing for the three monthly and six monthly samples. After review of the results, it is a recommendation of this report that sampling now be done on a six monthly basis. Golder proposed that water flow in the watercourses be continuously logged at the gauging stations using installed automatic data loggers powered by a solar panel. This information was to assist in interpreting water quality testing results and for reference when assessing any observed alteration to the riparian vegetation and rehabilitation areas downslope of the quarry. The water loggers have proved problematic and Cleary Bros is currently investigating alternative methods or equipment
38 3.2.2 QEMP PERFORMANCE TARGETS The QEMP reports that the initial purpose of water quality monitoring is to establish, over several years, the normal range of variability in the parameters being monitored. This is to be used as a base to observe any unusual variation in subsequent years. Consequently there are no performance targets. The analytes for measurement are listed below: Fortnightly sampling for one year Three monthly and later, six monthly sampling Analyte Electrical Conductivity ph Units µs/cm ph Temperature C Turbidity as above plus Total Dissolved Solids (TDS) Total Suspended Solids (TSS) Sodium Potassium Calcium Sulphate Chloride Alkalinity Carbonate/Bicarbonate Oil and grease Dissolved metals NTU mg/l mg/l mg/l mg/l mg/l mg/l mg/l mg/l mg/l mg/l mg/l Continuous Water flow Litres/sec Golder indicates that the analytes and monitoring frequency should be revised after the first three years. This AEMR provides the opportunity for that revision. Historical water monitoring data from commencement to October 2005 is available in the Golder report LICENCE REQUIREMENT Environment Protection Licence No 299 contains additional requirements for surface water monitoring at the processing plant site, described as follows:


39 These monitoring locations are associated with the processing plant, the stockpile area and the quarry extension floor. Analytes to be measured are as follows:

40 Concentration limits specified in Licence No 299 for the specified monitoring points are reproduced below SURFACE WATER MONITORING RESULTS Surface water monitoring data are available as follows: Watercourses 1 and 2 fortnightly sampling results are available for the reporting period, including results for conductivity, ph, temperature and turbidity, consistent with above. Watercourses 1 and 2 quarterly sampling results are available for the reporting period, consistent with the range of analytes indicated in section above. Stream at the site exit, west of the quarry manager s office monthly surface water testing results for ph, oil and grease and total suspended solids. Supertreat monitoring results available generally quarterly for oil and grease, total suspended solids and biochemical oxygen demand. Water flow data are not available during the reporting period, although historic data are available from the Golder report
41 (i) Watercourse 1 and 2 Fortnightly Sampling a) Conductivity Conductivity in the surface water has generally remained within the same range as groundwater. Higher levels are recorded in the larger watercourse (WC 2) entering from the adjoining property than in the smaller watercourse sourced within the quarry lands (WC 1). The historical range reported by Golder for Sept 2004 to Oct 2005 is µs/cm for Watercourse 1 and µs/cm for Watercourse 2. The current results are within this range
42 b) ph The ph of water within the two creeks has remained within a relatively neutral band. In the minor watercourse, WC1, ph has ranged between 6.6 and 7.9. In watercourse 2, ph has ranged between 7.2 and 8.4. Historically, Golder reported a range of 6.6 to 7.3 for WC1 and 7.1 to 8.0 for WC2 for the period Sept 2004 to Oct 2005, prior to quarrying. There is no significant variation in the current results from the historical trend
43 - 42 -
44 Watercourse 1 and 2 Fortnightly Sampling Analyte 5/07/ /07/2011 2/08/ /08/ /08/ /09/ /09/ /10/ /10/2011 8/11/ /11/2011 5/12/ /12/2011 Conductivity WC (µs/cm) WC ph WC WC Temperature WC ( C) WC Turbidity WC (NTU) WC Analyte 3/01/ /01/2012 1/02/ /02/2012 1/03/ /03/ /03/ /04/ /04/2012 9/05/ /05/2012 5/06/ /06/2012 Conductivity WC (µs/cm) WC ph WC WC Temperature WC ( C) WC Turbidity WC
45 (NTU) WC
46 c) Temperature Water temperature has been consistent in the two watercourses, showing a typical seasonal fluctuation. d) Turbidity
47 Turbidity has generally remained low. Historically, Golder reported a range of 1.8 to 340 NTU for WC1 and 1.2 to 1400 NTU for WC2 for the period Sept 2004 to Oct 2005, prior to quarrying by Cleary Bros. The historical results indicate occurrence of occasional spikes in turbidity, similar to current observations. (ii) Watercourse 1 and 2 quarterly sampling Quarterly sampling has been undertaken for a wider range of analytes. a) Oil and Grease Location 5/09/2011 5/12/2011 7/03/2012 5/06/2012 Historical Range* WC 1 <5 <5 <5 <5 <5 WC 2 <5 <5 <5 <5 <5 < means less than the limit of detection. * December 2004 to September 2005 (Golder) The results for oil and grease are negligible and not able to be meaningfully graphed. Concentration of oil and grease in the watercourses was not able to be measured in any of the historic samples, where the limit of detection was 5 mg/l. b) Total Suspended Solids Location 5/09/2011 5/12/2011 7/03/2012 5/06/2012 Historical Range* WC 1 <5 7 <5 <5 <5-190 WC 2 63 <5 <5 30 <5-160 * December 2004 to September 2005 (Golder)
48 Total suspended solids have been relatively low for the reporting periods and well within the historical range. c) Total Dissolved Solids Location 5/09/2011 5/12/2011 7/03/2012 5/06/2012 Historical Range* WC WC * December 2004 to September 2005 (Golder)
49 Total dissolved solids have been relatively low for the reporting periods and well within the historical range. d) Sodium Location 5/09/2011 5/12/2011 7/03/2012 5/06/2012 Historical Range* WC WC * December 2004 to September 2005 (Golder)
50 Sodium levels have generally shown a stable trend and are within the historical range this reporting period. e) Potassium Location 5/09/2011 5/12/2011 7/03/2012 5/06/2012 Historical Range* WC 1 <1 <1 < WC 2 1 < * December 2004 to September 2005 (Golder)
51 Potassium levels have remained low throughout the reporting period and are trending lower or at the low end of the historical range. f) Calcium Location 5/09/2011 5/12/2011 7/03/2012 5/06/2012 Historical Range* WC WC * December 2004 to September 2005 (Golder)
52 Calcium concentrations have remained stable within the reporting period and are generally trending at the low end of the historical range. g) Sulphate Location 5/09/2011 5/12/2011 7/03/2012 5/06/2012 Historical Range* WC 1 <1 < WC * December 2004 to September 2005 (Golder)
53 Sulphate concentrations demonstrate a clear difference between the two watercourses. Results for watercourse 1 have remained low while those for watercourse 2 have fluctuated with other analytes tested. These results are consistent with the historical data. h) Chloride Location 5/09/2011 5/12/2011 7/03/2012 5/06/2012 Historical Range* WC WC * December 2004 to September 2005 (Golder) Chloride concentrations have remained stable within the reporting period and are generally trending lower or at the low end of the historical range
54 i) Alkalinity Location 5/09/2011 5/12/2011 7/03/2012 5/06/2012 Historical Range* WC WC * December 2004 to September 2005 (Golder) Alkalinity values differ in the two watercourses, however are following the same trends. Watercourse 1 is providing significantly lower results than water entering the site via Watercourse 2. With the exception of watercourse 2 in June 2012 (which is marginally above the historic maxima), the fluctuation in results is within the maxima in the historical range but minima are trending below the historical range. j) Bicarbonate Location 5/09/2011 5/12/2011 7/03/2012 5/06/2012 Historical Range* WC WC * December 2004 to September 2005 (Golder) The results for bicarbonate are the same as the results for alkalinity. k) Total Dissolved Metals
55 Total dissolved metals includes the concentrations of arsenic, cadmium, chromium, copper, iron, lead, mercury, nickel and zinc. Each of these analytes is tabulated separately below. Apart from the trace levels of iron and copper, metals are not detected even with the lower level of detection now available. The results are not able to be meaningfully graphed. Cadmium, chromium, lead, mercury, nickel and zinc were not detected in any surface water sample. Of these, cadmium, mercury and nickel have also not been detected in any historic sample reported by Golder. A recommendation for this report is to cease testing for these analytes. The results indicate that metal concentrations in the two watercourses are very low
56 Surface Water Monitoring Results for Dissolved Metals (mg/l) Location Watercourse 1 Watercourse 2 Historical 5/09/2011 5/12/2011 7/03/2012 5/06/2012 5/09/2011 5/12/2011 7/03/2012 5/06/2012 Highest 1 Arsenic <0.001 <0.001 <0.001 <0.001 <0.001 <0.001 <0.001 <0.001 ND Cadmium < < < < < < < < ND Chromium <0.001 <0.001 <0.001 <0.001 <0.001 <0.001 <0.001 < Copper Iron <0.05 <0.05 < Lead <0.001 <0.001 <0.001 <0.001 <0.001 <0.001 <0.001 < Mercury < < < < < < < < ND Nickel <0.001 <0.001 <0.001 <0.001 <0.001 <0.001 <0.001 <0.001 ND Zinc <0.005 <0.005 <0.005 <0.005 <0.005 <0.005 <0.005 < Highest reading in either watercourse from December 2004 to September 2005 (Golder). ND = not previously detected
57 (iii) Stream west of quarry manager s office monthly testing Three analytes have been measured in the north flowing stream near the processing plant. Date ph Oil and Grease TSS 5/07/ <5 5/08/ <5 <5 5/09/ <5 <5 5/10/ <5 14 4/11/ <5 <5 5/12/ <5 9 6/01/ <5 <5 7/02/ <5 <5 7/03/ <5 <5 5/04/ <5 <5 4/05/ <5 <5 5/06/ <5 36 a) ph Creek water ph has remained in a neutral band between 7.5 and
58 b) Oil and Grease Oil and grease has been generally low and the majority of readings were below the level of detection. c) Total Suspended Solids
59 Total suspended solids has remained at a low level
60 (iv) Supertreat outlet monthly testing Three analytes have been measured at the supertreat outlet, corresponding to Point 5 in the EPL. Date Oil and Grease TSS BOD5 5/09/2011 < /12/2011 < /03/2012 < /06/ /06/2012 (re-test following service) < a) Oil and Grease Oil and grease concentration has remained low over the reporting period and is well below the objective level of 30 mg/l specified in the EPL
61 b) Total Suspended Solids Total suspended solids peaked above the EPL objective level of 50 mg/l on 5 June 2012 and in accordance with the EPL, the Supertreat system was serviced on 21 June 2012 and then re-tested on 25 June The total suspended solids returned to low levels following this service. c) Biochemical Oxygen Demand Biochemical Oxygen Demand has generally remained less than 100 mg/l which is below the EPL objective limit of 150 mg/l
62 (v) Quarry Extension Discharge As required by the EPL, two analytes have been measured at the quarry extension when discharge occurred corresponding to Point 6 in the EPL. Date ph TSS Comments 27/09/ Water discharged 13/01/ Water discharged 25/06/ Water discharged a) ph The ph levels were within the EPL required range of 6.5 to 8.5. b) Total Suspended Solids
63 The total suspended solids were below the EPL limit of 50mg/L. (vi) Main holding and sedimentation pond discharge There was no discharge from the main holding and sedimentation point, corresponding to Point 5 in the EPL and therefore there was no requirement for any analyte testing SURFACE WATER TESTING RESULTS INTERPRETATION (i) Watercourse Monitoring quarry site a) Water quality monitoring The purpose of surface water quality monitoring specified in the QEMP is to determine a baseline for water quality in the two watercourses at the quarry and then observe whether there is any unusual variation over the life of the quarry. The original intention was that surface water be sampled fortnightly for a year (from 2004), then three monthly for a year (with a larger range of analytes) and six monthly thereafter. Fortnightly samples and three monthly samples have continued to the present and should now be reviewed with a view to moving to six monthly sampling. The opportunity is also available to consider if the range of analytes are relevant for future monitoring. Results of monitoring have shown that water quality is generally better in watercourse 1, the minor watercourse draining the quarry land, than in watercourse 2 which receives its flow from the adjoining property to the west. The results have indicated that the concentration of most analytes in the two watercourses is within or close to the historical range and the water is improving in quality. A baseline range for surface water parameters has now been determined. Following receipt of each future set of monitoring results, consistency with the baseline range will be confirmed and any significant variation investigated. A number of analytes have demonstrated concentrations that suggest monitoring should be discontinued. It is recommended that analysis be discontinued for the following analytes: Bicarbonate (results the same as alkalinity) Oil and grease (negligible results) Cadmium, mercury and nickel (not detected in any sample or historically) Arsenic, chromium, lead and zinc (not detected in any sample this reporting period or the previous reporting period of 2010/2011)
64 It is also recommended that monitoring be reduced to six monthly intervals as proposed in Golder s Water Management Plan. b) Flow monitoring The QEMP refers to flow monitoring in watercourses 1 and 2 using installed gauges connected to an automatic data logger. This apparatus was installed and flow monitoring initially undertaken as reported in Surface Water and Groundwater Management/Monitoring Plan (Golder Associates 2003). Golder collected data from the logger when the watercourses were visited for sampling and recorded the information as a data file. However, the devices have subsequently proved problematic, with one site being destroyed by cattle. As a result watercourse flow data is not available for the reporting period of this AEMR. Cleary Bros would like to have watercourse flow or depth information available for each sampling event to assist in explaining observed variations in water quality within the watercourses. This matter has been discussed with Golder with the advice that there are various methods available for obtaining relevant data from the watercourses, including direct measurement at the time of sampling. It is recommended that an alternative method of direct measurement using a v-notch weir (or similar) at the time of sampling for collecting flow data in the watercourses be implemented during the reporting period. (ii) Water quality monitoring processing plant The environment protection licence requires monitoring at four locations at the processing plant and the quarry extension (two points during overflow only). The creek flowing near the quarry manager s office has been sampled monthly and tested for three analytes. The results show normal ph levels, low oil and grease and low TSS levels. The second monitoring location is at the Supertreat outlet. The oil and grease and the biochemical oxygen demand were below the EPL objective limits. However, the total suspended solids peaked above the EPL objective level of 50 mg/l on 5 June 2012 and in accordance with the EPL, the Supertreat system was serviced on 21 June 2012 and then re-tested on 25 June The total suspended solids returned to low levels following this service. It should be noted that water from the Supertreat is pumped out as irrigation onto grassed areas. The limits on the Supertreat were removed and moved to part O4.1 of the EPL in January 2011 as quality limits which still need to be tested
65 and reported, however when exceeded the Supertreat needs to be serviced and the effluent monitored weekly until the quality limits are achieved. The water stored in the quarry extension was sampled for two analytes prior to discharge (Point 6 in the EPL). The results showed normal ph levels and low TSS levels. There was no discharge from the main holding and sedimentation point, corresponding to Point 5 in the EPL and therefore there was no requirement for any analyte testing
66 3.3 AIR QUALITY MONITORING QEMP REQUIREMENTS The source for air quality monitoring requirements specified in the QEMP is the Dust Management Plan for the quarry (Heggies Australia 2006) prepared pursuant to the LEC development consent. The QEMP requires that dust deposition be measured at four locations by the use of deposition gauges and dust concentration be monitored at one location using a high volume sampler. Dust deposition gauge locations are shown on Figure 3 and are as follows: West of the administration area (dust gauge 1) Rinker property, north west of Kyawana (dust gauge 2) Dunsters Lane, south west of The Cottage (dust gauge 3) Northern boundary, east of the gate to Belmont (dust gauge 4) The high volume air sampler is located on the ridge top south of Belmont and is fitted with a PM 10 size-selective inlet. On 11 August 2009, during the current reporting period, the Department of Planning advised Cleary Bros that the Director-General had approved an amendment to the QEMP to remove the requirement for PM 10 dust to be measured with a real time light scattering monitor, located adjacent to The Cottage. The original requirement for this device was contained in the Dust Management Plan LICENCE REQUIREMENTS The EPL requires that dust deposition be measured at four locations as indicated in the extract below. These locations are considered to be included within the four locations described in the QEMP requirements above


67 Monitoring required to be carried out at the designated locations is described as follows
68 3.3.3 AIR QUALITY CRITERIA The air quality criteria specified in the QEMP and derived from the development consent are reproduced below. Pollutant Averaging Period Criterion Total suspended particulate matter (TSP) Particulate matter < 10 µm (PM 10 ) Particulate matter <10 µm (PM 10 ) Annual 90 µg/m 3 Annual 30 µg/m 3 24-hour* 50 µg/m 3 Maximum increase Total Deposited Dust Annual 2 g/m 2 /month 4 g/m 2 /month *Note: For continuous PM 10 monitoring purposes, the Dust Management Plan derives a one-hour average PM 10 limit of 125 µg/m 3. The EPL does not specify limits for dust deposition monitored at the locations identified in the licence AIR QUALITY MONITORING (i) Dust Deposition Monthly monitoring records are available for the four dust deposition monitoring stations for the reporting period. Data has been recorded for ash, combustible solids and total insoluble solids. Deposited dust is assessed as total insoluble solids, which includes ash and organic material, the latter likely to be present regardless of whether the quarry is operating or not. Ash is the relevant analyte for measuring mineral dust. Units are grams per square metre per month
69 Location 1 Location 2 Location 3 Location 4 Analyte Ash Total Insoluble Solids Ash Total Insoluble Solids Ash Total Insoluble Solids Ash Total Insoluble Solids Jul Aug ^aug3 ^aug Sep Oct Nov Dec ^dec3 ^dec Jan Feb Mar Apr May Jun Average ^aug 3 Funnel missing (subsequently replaced) ^dec3 Funnel missing and glass present In bottle As can be seen in the table, the average deposition of total insoluble solids over the 12 month period has been less than 4 g/m 2 /mth at all monitoring stations. The monitoring results for dust are presented in graphical form below. The quarry is considered to be in compliance with the requirements of the development consent
70 (i) Dust Concentration Dust concentration samples have been collected from the high volume air sampler (HVAS) every six days for the reporting period. While the analysis reports indicate that the results are for Total Suspended Particulates (TSP) in µg/m 3, the results are a measurement of PM 10, owing to size selective inlet fitted to the HVAS. Results are tabulated below. Date TSP Date TSP Date TSP 1/07/ /11/ /03/ /07/ /11/ /03/ /07/ /11/ /03/ /07/ /11/ /03/ /07/ /11/ /04/ /07/ /12/ /04/ /08/ /12/ /04/ /08/ /12/ /04/ /08/ /12/ /04/ /08/ /12/ /05/ /08/ /01/ /05/ /09/ /01/ /05/ /09/ /01/ /05/
71 17/09/ /01/ /05/ /09/ /01/ /06/ /09/ /02/ /06/ /10/ /02/ /06/ /10/ /02/ /06/ /10/ /02/ /06/ /10/ /02/ Average /10/ /03/ The HVAS is configured to run for 24 hours every six days, so each result indicates a 24- hour dust concentration. No single result exceeded the 50 µg/m 3 limit applicable over a 24-hour averaging period. As shown in the table, the average of all of the results is well below the annual 30 µg/m 3 limit specified in the QEMP AIR QUALITY TESTING RESULTS INTERPRETATION Air quality monitoring results indicate that for the parameters measured, the quarry is operating without exceeding the dust limits specified in the QEMP
72 3.4 NOISE MONITORING QEMP REQUIREMENTS There are three specified noise monitoring locations: Belmont, within the quarry property The Cottage, on the adjoining property to the north Greenmeadows residential estate (north of the processing plant) Noise monitoring is required to be carried out each quarter for the first year and thereafter at annual intervals, except for Greenmeadows estate, where quarterly monitoring needs be carried out only for the first quarter before switching to annual monitoring, provided compliance is established. Each monitoring event requires unattended noise logging for seven days and operatorattended logging for one day. There are no specific requirements for noise monitoring in the sites EPL NOISE PERFORMANCE CRITERIA Noise limits apply to operational noise under conditions of wind speeds (10 m above ground) of up to 0.5 m/s and temperature gradients of up to 0 C per 100 metres. Receiver Locations Noise Limits L Aeq15minute Stages 1-2 Stages 3-4 Stages 5-6 The Hill residence (Dunster premises) The Cottage residence (Dunster premises) Approved rural worker s dwelling (Dunster premises) Greenmeadows residential estate The Belmont residence is owned by Cleary Bros and the Company has no operational noise issue with its own operations
73 3.4.3 NOISE MONITORING RESULTS A noise survey was conducted in August Construction activities were continuing during the initial surveys. During the survey, prevailing weather conditions were outside those nominated in the development consent, with the consequence that the limits indicated do not apply. Subsequently, extra measurements were taken in the Stage 1 quarry area. Information gathered was used for modelling to determine the contribution of noise from the quarry and processing plant at the relevant residences. The results for the no-wind case are indicated below. All results are LAeq(15 minute), measured in db(a). Calculated Noise Contribution of the Quarry for No Wind (Calm) Monitoring Location Aug 11 Criteria Belmont The Cottage The Hill Greenmeadows estate Note 1: Belmont is owned by Cleary Bros and the Company has no operational noise issues relative to its own operations. All noise levels predicted by the modelling based on actual measurements in the quarry and the processing plant are below the relevant criteria, except for Belmont which is owned by Cleary Bros. Noise monitoring is required on an annual basis. In July 2012, SLR Consulting (formerly Heggies) were awarded the contract to carry out the annual noise monitoring for This work is scheduled to be carried out in September NOISE MONITORING RESULTS INTERPRETATION On the occasion when noise measurements were undertaken, ambient wind conditions exceeded those nominated in the QEMP (and development consent) for determining compliance. The revised methodology developed by the acoustic consultant of measuring noise close to the source and then computing its effect at the residences under calm conditions has demonstrated compliance with criteria at all locations except Belmont where Cleary Bros has no operational noise issues with its own operations. It is recommended that this revised methodology be used for all future noise monitoring. On each occasion when the acoustic consultant undertook operator-attended measurements at the Greenmeadows estate, the actual measuring location was closer to the source, within Cleary Bros property. This gave greater security for the unmanned logger and for convenience, was used for operator-attended measurements. Accordingly,
74 the contribution of the Albion Park Quarry at Greenmeadows Residential Estate is estimated to be 5 dba to 6 dba lower than predicted. The consultant made the following observations: Noise emissions from the quarry extension area were not discernible at both the Cottage and Greenmeadows Estate and the processing plant were barely audible. The main CB noise discernible was the trucks entering and exiting of the quarry. It is noted that Greenmeadows Residential Estate comprises mainly single storey houses and is shielded by the noise wall. The measurements were conducted on the CB private road next to Greenmeadows Residential Estate at the closest house to the CB quarry. However, the measurements were conducted in a location which is not shielded by any noise wall for comparison with the original noise model which did not incorporate a noise wall (as well as for reasons of security). The contribution of the CB quarry is therefore expected to be lower than the prediction. The CB quarry noise contribution calculated at the residences show that the CB quarry complies with the Consent Conditions under the nominated meteorological conditions at all locations
75 3.5 BLAST MONITORING QEMP REQUIREMENTS A permanently installed blast monitor is located next to The Cottage residence on the neighbouring Figtree Hill property. Every blast is required to be monitored at this location, which is the closest residential receptor not owned by Cleary Bros. When blasting is to occur within 40 metres of the northern boundary of the quarry property, a portable blast monitor is to be located at the property boundary at the point closest to the blast. Results of blast monitoring are required to be included in the AEMR. The EPL also requires each blast to be monitored at The Cottage location PERFORMANCE TARGETS Airblast overpressure and peak particle velocity from blasting must be consistent with the limits below, reproduced from the QEMP. Blasting may only take place between 9 am and 5 pm Monday to Friday and is limited to one blast per day unless approved by DECCW. Blast requirements are set out in more detail in the Blast Management Plan (Heggies 2006) Maximum Airblast Overpressure db(lin Peak) Maximum Peak Particle Velocity mm/s Allowable Exceedence 1. At any point located at least 3.5 metres from any residence on privately owned land % of the total number of blasts over any 12 month reporting period % 2. At the southern boundary of the Figtree Hill land % The EPL contains the same airblast overpressure and peak particle velocity limits as indicated above. Under the EPL, the airblast limit is applicable to a measuring instrument with a lower cut off frequency of 2 Hz or less
76 3.5.3 BLAST MONITORING RESULTS Blast monitoring results are reported on the following pages for the period from July 2011 to June 2012 during which production blasting was taking place
77 Blast Number Date Scheduled Time Albion Park Quarry Blasting Summary Time Fired Results Comment Sound Pressure Ground Vibration Level (db Linear) (mm/sec) 08/ am - 12pm 11:07am DECCW/Dunsters advised prior to blast. 09/ am - 12pm 10:18am DECCW/Dunsters advised prior to blast. 10/ am - 12pm 11:23am DECCW/Dunsters advised prior to blast. 11/ am - 12pm 09:27am DECCW/Dunsters advised prior to blast. 12/ am - 12pm 09:46am DECCW/Dunsters advised prior to blast. 13/ am - 12pm 11:49am DECCW/Dunsters advised prior to blast. 14/ am - 12pm 10:11am DECCW/Dunsters advised prior to blast. 15/ am - 12pm 09:51am DECCW/Dunsters advised prior to blast. 16 & 17/11 18 & 19/ am - 12pm 11:19am DECCW/Dunsters advised prior to blast. Fired together for safety reasons am - 12pm 09:03am DECCW/Dunsters advised prior to blast. Fired together for safety reasons. 01/ am - 12pm 10:28am DECCW/Dunsters advised prior to blast. Fired together for safety reasons
78 02/ am - 12pm 09:20am DECCW/Dunsters advised prior to blast. Due to technical difficulties, blast wave form data could not be retrieved 03/ am - 12pm 09.22am DECCW/Dunsters advised prior to blast. Blast Number Date Scheduled Time Time Fired Results Comment Sound Pressure Ground Vibration Level (db Linear) (mm/sec) 04/ am - 12pm 10.27am DECCW/Dunsters advised prior to blast. 05/ am - 1pm 12:18pm <95.0 <0.500 DECCW/Dunsters advised prior to blast. Blast monitor did not trigger due to low level of vibration. Monitor was tested and found to be working OK. 06/12 & 07/ am - 1pm 12:01pm DECCW/Dunsters advised prior to blast. Fired together for safety reasons. 08/ am - 1pm 11:12am DECCW/Dunsters advised prior to blast. 05/12a 01/05/12 9am - 1pm 12:38pm DECCW/Dunsters advised prior to blast. Blast from misfire on / am - 1pm 10.35am DECCW/Dunsters advised prior to blast
79 3.5.4 BLAST MONITORING RESULTS INTERPRETATION All blast monitoring results have been below the levels specified in the QEMP. The highest sound pressure level recorded at the blast monitor was db (lin) and the highest peak particle velocity was 1.58/mm/sec. There have been no blasts carried out within 40 metres of the northern boundary so the portable blast monitor has not been required at the property boundary. 3.6 METEOROLOGICAL MONITORING QEMP REQUIREMENTS The QEMP requires that the following parameters be continuously monitored at the site and averaged over one-hourly intervals. Parameter Temperature at 2 metres Temperature at 10 metres Total Solar Radiation at 10 metres Wind direction at 10 metres Wind speed at 10 metres Sigma theta at 10 metres Rainfall Units K K W/m 2 Compass points m/s degrees mm/hr The weather station is located near Belmont and has been in operation since There EPL now mirrors the Consent Conditions regarding the requirement to for meteorological monitoring COMPLIANCE ASSESSMENT Meteorological data was being continuously recorded at the commencement of this reporting period at the site, transferred via telemetry and retained in a permanent log which is stored electronically at Cleary Bros Port Kembla office, however the weather station meteorological station at Cleary Bros Albion Park quarry began malfunctioning in October 2011, giving erroneous values, as well as a failure in the remote data
80 downloads. PAE Holmes were engaged in October 2011 to repair the meteorological system and they determined that the data logger was corrupt and required an upgrade. It was also decided that the telemetry system should be upgraded from the existing dialin-modem system to a 3G system including internet data hosting. The data logger and the 3G system were installed in March 2012, however there has been ongoing technical issues since installation. Repeated site visits have been required to diagnose various potential issues, including on one occasion to remove the logger and send it back to the supplier for repair. On almost all occasions when a site visit was conducted, communication was re-established and the system appeared to the working effectively, only to fail within a few hours of the technicians leaving site. In addition, a new solar panel has been ordered and is due to be installed in late August It is expected that the weather station will be operational following this installation. To satisfy Cleary Bros obligations in regard to environmental reporting, PAE Holmes has obtained Bureau of Meteorology data from the Automatic Weather Station at Illawarra Regional Airport to supplement the missing data. This station is approximately 3 kilometres from the Cleary Bros Albion Park Quarry, and the meteorological conditions are likely to be consistent with those at the quarry. A copy of PAE Holmes letter dated 12 July 2012 is included as Annexure C
81 3.7 ECOLOGICAL MONITORING QEMP REQUIREMENTS Once per year a qualified ecologist is required to inspect: The revegetation/rehabilitation areas shown on Appendix 1 of the LEC consent; The strip of riparian bushland immediately downhill from the quarry that could be potentially be affected by changes to groundwater or surface water. With regard to the first point the ecologist is to comment upon progress with implementing the quarry s Vegetation Management Plan (Mills 2007). In relation to the second point the ecologist is to consult the quarry manager and consider whether quarryrelated variations to ground water or surface water could be responsible for any observed change in the riparian vegetation. In addition, a qualified ecologist is also required to carry out a biannual inspection to provide information to CB relating to the successful maintenance of the restoration areas and planted maintenance. The ecologists reports including any recommendations are to be included in the AEMR. There is no requirement in the EPL for ecological monitoring COMPLIANCE ASSESSMENT Kevin Mills and Associates inspect the site regularly (generally once per month) to report on the progress of implementing the vegetation Management Plan. Kevin Mills interim six monthly inspection report is included as Annexure D and states that the intent of the Albion Park Vegetation Management Plan has been carried out effectively. Over this period, plant species selection and planting, and weed spraying have been carried out across management zones 1 and 2. Kevin Mills annual report is included as Annexure E. The report found that, considerable progress has been made on works in Zone 1 and Zone 2. Plantings in zones 1 and 2 are being maintained. This work includes spraying grass around the plantings, replacing dead plants and, most recently, trialling planting seeds of appropriate species and Given the works that have been completed to date, we believe that the conditions of consent for the Albion Park Quarry are being met
82 - 81 -
83 4 COMPLAINTS 4.1 QEMP REQUIREMENT The AEMR is to include a summary of complaints received during the past year comparing this to complaints received in previous years. The EPL requires a legible record of all complaints relating to pollution incidents. Both the QEMP and the EPL specify a protocol to be followed in relation to complaints including recording action taken regarding the complaint. 4.2 TABULATED RESULTS Six (6 No.) environmental complaints were received during the reporting period from 1 July 2011 to 30 June Comparison with previous years complaints is summarised below: Year Environmental Complaints 2007/ / / / / ENVIRONMENTAL COMPLAINTS RESULTS INTERPRETATION A summary of the five complaints received is provided below: Date Description of Complaint Status August 2011 September 2011 Resident called to complain about blast vibration. Cleary Bros advised resident that the noise and vibration limits were below the OEH and DoP limits. Anonymous complaint received from OEH regarding alleged work outside of approved hours. CB investigated and found that CB had not worked outside approved hours with the exception of maintenance shifts which is Closed out Closed out
84 December 2011 January 2012 May 2012 May 2012 permissible. OEH advised that they were concerned with some material at the roundabout at Cleary Bros front entrance. CB organised the street sweeper noting that the material was negligible. Resident called to complain about blast vibration. Cleary Bros advised resident that the noise and vibration limits were below the OEH and DoP limits. Anonymous complaint received from OEH regarding alleged dust from CB quarry. CB investigated and ensured that jaw crusher sprays were operational during works. Anonymous complaint received from EPA regarding alleged work outside of approved hours. CB investigated and found that CB had not worked outside approved hours with the exception of maintenance shifts which is permissible. Closed out Closed out Closed out Closed out
85 5 REVIEW OF QEMP PLANS 5.1 WATER MANAGEMENT PLAN As indicated in the LEC consent, the Water Management Plan comprises: a) a Water Balance; b) an Erosion and Sediment Control Plan; c) a Surface Water Monitoring Program; d) a Ground Water Monitoring Program; and e) an Integrated Water Management Strategy, if the water balance shows a potential demand for water above that which can be collected from rainfall. The various requirements of the WMP were addressed in the QEMP and associated documents. Parts a) and e) refer to the water balance, which predicted that the quarry could operate within a water budget capable of being satisfied from rainwater collected on site. The quarry has operated throughout the reporting period with a surplus of water. The Erosion and Sediment Control Plan was implemented during the construction phase of the quarry. Erosion and sediment controls will be monitored and maintained throughout the life of the quarry. Appropriate modifications will be made in future years as quarrying progresses across the property. The surface water and ground water monitoring programs were included within the document by Golder Associates Surface Water and Groundwater Management/Monitoring Plan (2005). Monitoring should continue in accordance with those plans subject to recommendations in this AEMR. 5.2 VEGETATION MANAGEMENT PLAN The VMP applies primarily to the revegetation and restoration areas to the south of the quarry. These locations will be the subject of management and maintenance throughout the quarry life. The VMP will be progressively implemented and does not require any modification at this stage
86 5.3 REHABILITATION MANAGEMENT PLAN At this early stage of quarrying there is no completed area of extraction where rehabilitation works could be carried out. Detailed rehabilitation proposals will be developed as the quarry progresses and extracted areas become available for commencement of rehabilitation. This is expected to occur in about three years. The annexed reports from Kevin Mills and Associates reports that based on inspection in December and July 2012, the revegetation and conservation works are well established. 5.4 HERITAGE MANAGEMENT PLAN The Heritage Management Plan prepared in accordance with the LEC development consent and approved by the Department of Planning provided for the following to occur: Archival recording of Kyawana Archival recording of Belmont Archival recording of dry stone walls and other heritage elements Salvage and reconstruction of dry stone walls A and B Conservation and maintenance of dry stone wall C Baseline dilapidation surveys for The Hill and Belmont The archival recordings were undertaken and included in the heritage management plan. Kyawana is no longer affected by the development and Belmont was always intended to be retained. It is considered that all essential works required at this time under the heritage management plan have been carried out. 5.5 WASTE MINIMISATION Waste management at the quarry has been carried out as indicated in the QEMP. Waste generation has been minimised as far as possible. Quarry overburden is not considered waste and has been stockpiled for placement in the base of the excavation as soon as sufficient space is available. Other waste including workshop waste, office waste and waste from personnel (food scraps etc) is separated where appropriate and separately
87 removed for recycling or disposal. Waste oil from machinery and equipment used on site is collected and recycled through a specialist waste oil recycling contractor
88 6 CONCLUSIONS This AEMR can report that during the relevant reporting period from July 2011 to June 2012 and subject to comments below, activities at Albion Park Quarry have remained within the conditions of approval. The AEMR records that during the preceding twelve month period ( ), for which an annual return to DPI is available, quarry production was below the 600,000 tonne limit. The production figures for this reporting period ( ) indicates 558,308 tonnes of basalt was extracted from the extended quarry area which is the subject of this consent. Approximately 273,000 tonnes of overburden was removed from other areas of the site. It has been necessary to test noise measurements close to the source and then model the result at residential receptors because of prevailing weather conditions. This modelling predicts that compliance has been achieved. Dust and blasting have been within consent limits. Water quality in streams and groundwater has been monitored and found generally within or trending below the historical range, recorded prior to the quarry activity commencing on the site. Monitoring of groundwater levels downslope of the quarry has not to date demonstrated any drawdown to date in the shallow wells as a result of the quarry operations, which is consistent with Golder s predictions in their 2005 report. Golders October 2005 report identified the two aquifers at the site; (1) Perched (shallow) groundwater overlying the fresh bedrock mass, and (2) The regional bedrock (deep) aquifer developed with the latite, agglomerate and sandstone sequence which is regionally dominant. In addition, Golder s report also identifies that the two shallow groundwater monitoring wells show that the shallow aquifer is not generally supplied by the deep (bedrock) aquifer. In addition, Golder s report identifies that a drawdown of less than 10m would be observed in the deep aquifer. The site monitoring results indicate that whilst there has been an increase in the water table height in the deep boreholes, the shallow monitoring wells have remained fairly static (as predicted by Golder)
89 The various management plans required to be considered in the AEMR are all being implemented. Further consideration of the heritage management plan should not be necessary in future years because all relevant matters have been completed
90 7 RECOMMENDATIONS The following recommendations derive from the findings of this AEMR: Groundwater monitoring Discontinue analysis for the following analytes: Bicarbonate (results identical to alkalinity) Nitrite (negligible results) Ammonia (negligible results) Mercury (not detected) Arsenic, cadmium, chromium and lead. Reduce the frequency of the groundwater monitoring Do not install a replacement for destroyed deep monitoring well MW3D at this time (as recommended by Golder), but keep the matter under review for consideration during review of future groundwater monitoring results. Surface Water Monitoring Discontinue analysis for the following analytes: Bicarbonate (results identical to alkalinity) Oil and grease (negligible results) Cadmium, mercury and nickel (not detected in any sample or historically) Arsenic, chromium, lead and zinc Reduce the frequency of surface water monitoring to six monthly as proposed in Golder s Water Management Plan Conduct future water flow data for the two watercourses using measurements made at the time of sample collection
91 Noise Monitoring Owing to the practical difficulty in obtaining valid noise measurements at the designated locations where the wind has to be less than 0.5 metres per second, future noise monitoring should follow the practice trialled in 2009 and carried out in 2010 and 2011 of monitoring source noise in the quarry and calculating using modelling during calm conditions at the receptors
92 Annexure A NSW Industry and Investment (DPI) Return
93 - 92 -
94 - 93 -
95 Annexure B Environmental Monitoring Locations
96
97 Annexure C Letter from PAE Holmes dated 12 July 2012
98
99
100 Annexure D Interim 6 Monthly Ecological and Rehabilitation Monitoring K.Mills
101
102 Annexure E Annual Ecological and Rehabilitation Monitoring K.Mills
103

104

105