Global freshwater demand for electricity generation under low-carbon scenarios
|
|
|
- Barbra Jackson
- 5 years ago
- Views:
Transcription


1 Global freshwater demand for electricity generation under low-carbon scenarios Michela Bevione, Laurent Drouet, Massimo Tavoni 35 th International Energy Workshop 1 st June 2016, Cork, Ireland
2 Summary Introduction Overview on global water use Water and energy nexus Implementation of the water module in WITCH Results Data Methodology Baseline scenario Policy and technology constraint scenarios Conclusions 1
3 Introduction: Global water withdrawal by sectors All economic sectors need water: agriculture, industry and most forms of energy production are not possible without water. Municipal 11% Industry 19% Agriculture 70% Electricity generation: 15% of world s total water withdrawal (IEA,2010) Source: FAO Aquastat Database (2010) 2
4 The energy and water nexus Energy and water are strongly interdependent, as water is required throughout the whole electricity generation process. Electricity demand has been rapidly increasing in the last decades, and a further electric-sector expansion could intensify the intersectoral competition for freshwater. On the other hand, a lack in water supply would negatively affect the power generation sector, e.g. in the 2009-summer one third of the French nuclear power plant were put out of action because of water shortages caused by a heat wave. 3

5 The WITCH model WITCH (World Induced Technical Change Hybrid) is an integrated assessment model designed to evaluate the impacts of climate policies on global and regional economic systems. CAJAZ OLDEURO TE NEWEURO USA MENA CHINA SASIA SSA INDIA LACA EASIA KOSAU The WITCH regions strategically interact using a game theoretic set-up. For each region the model generates the optimal mitigation and adaptation strategies to 2100, by maximizing the welfare of each region. 4

6 The production function In each region the final good (Y) is produced using capital (K), labor (L) and energy services (ES). Capital and labor are aggregated using a Cobb- Douglas production function. This nest is then aggregated with energy services with a CES production function. Each coalition will choose the optimal inter-temporal mix of technologies and R&D investments in a strategic way.
7 The implementation of the water module The water module has been implemented outside the optimization process, by associating water demand intensities to the energy technologies modeled in WITCH. Water demand has been evaluated in terms of: Water withdrawal: the amount of water taken from a water body. Water consumption: the amount of water withdrawal that is not returned to the source and no longer available for reuse (consumed through evaporation) Both freshwater and seawater demand is modeled in WITCH. 6
8 Water demand in the power generation sector Water is required throughout the whole electricity generation process, but only the operational water demand is considered in this analysis. Fuel acquisition Plant construction Plant operation Wind and solar energy: Cleaning processes Boiler feed and cooling (CSP only) Hydroelectric generation: Electricity generation Reservoir storage Fuel disposal Thermoelectric and nuclear generation: Boiler feed Cleaning flue gases Steam cooling and condensing 7


9 Thermoelectric and nuclear generation: cooling systems Water demand of thermoelectric and nuclear plants varies according to cooling technologies. Once-through system Freshwater Saline water Recirculating tower Freshwater Cooling pond Freshwater Dry tower - 8


10 Data: Cooling system breakdown Kyle (2013) provides data on regional cooling system shares for: : assigned to the base year plant stock in WITCH; - future periods: assigned to new installations from 2010 on. 9
11 Water intensities in thermoelectric and nuclear power Water intensity = Water demand Net electricity generation m 3 MWh Nuclear Hydropower Oil & Biomass Coal Nuclear Oil & Biomass Gas Gas Coal Source: Macknik (2012) 10
12 Calculation methodology Non-biomass renewables: W with,cons = Q el Intensity net electricity where: Q el is the net electricity generation Withdrawal and consumption intensities are expressed in m3/mwh of net electricity Thermoelectric and nuclear power plants: W with,cons = Q exc ( Intensity excess heat, jcool share jcool ) jcool where: Q exc is the plant excess heat to be removed Withdrawal and consumption intensities expressed in m3/mwh of excess heat Cooling systems shares An improvement in the energy efficiency of the plant implies a lower excess heat to the condenser, and then a reduction in the cooling water demand. 11


13 Baseline: Global water demand by technologies Seawater cooling Wet tower Hydropower 12


14 Baseline: Uncertainty on global freshwater demand FAO estimates Without hydro 13

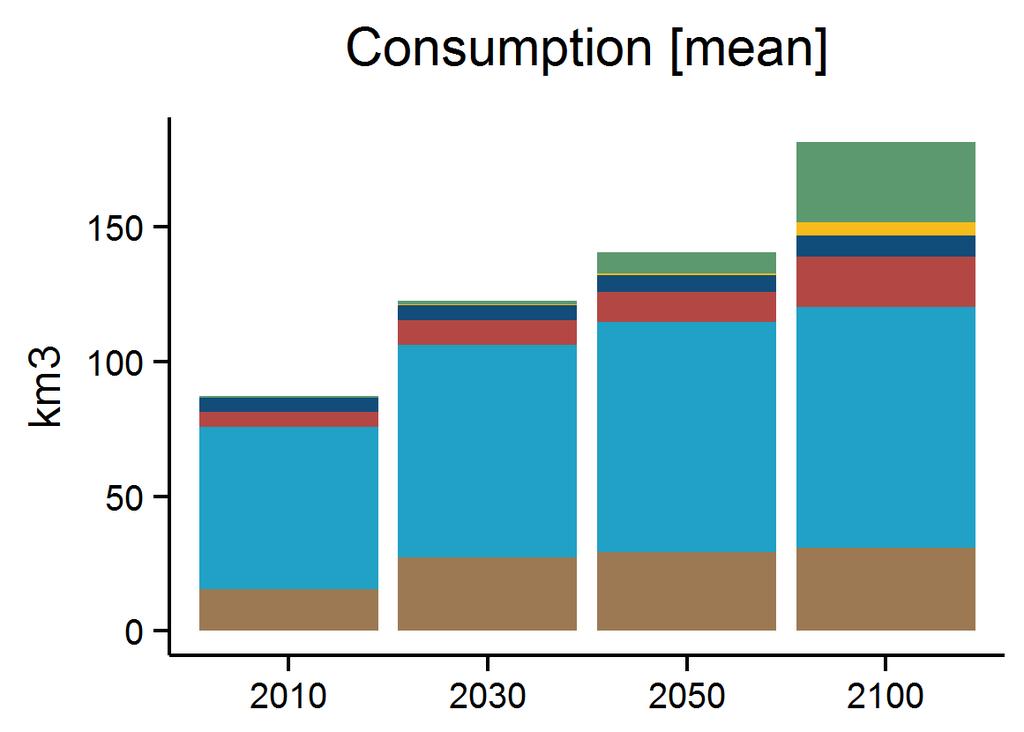
15 Baseline: Global freshwater demand by energy sources 14

16 Baseline vs RCP37: Global freshwater demand Climate policy: radiative forcing target at 3.7 W/m 2 in % -33% -16% -18% -24% -30% 15
17 Baseline, RCP37 and RCP37_NukePO: Water demand Technological constraint: nuclear phase-out obtained by assuming no further investment into nuclear capacities after % -7% -40% -42% 16

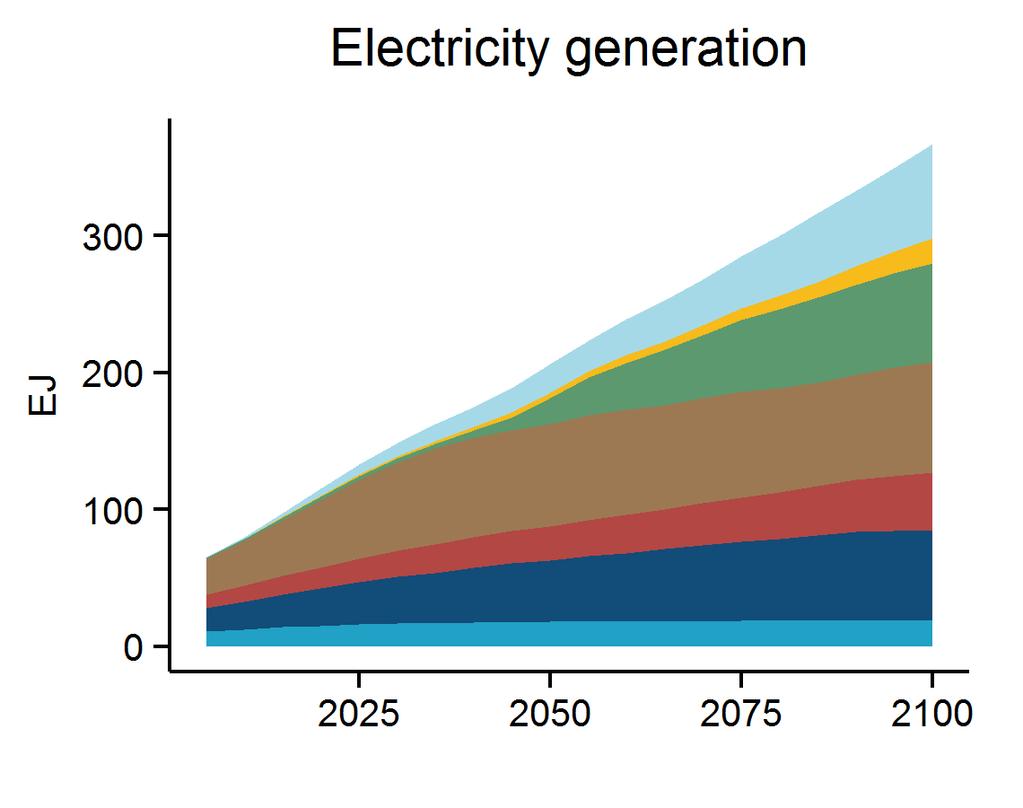
18 Baseline, RCP37 and RCP37_NukePO: Electricity mix 17
19 Conclusions (1) Water withdrawal and consumption strongly depend on the global electricity demand and generation mix. The renovation of the power plant stock produces reductions in global freshwater demand as new plants have higher efficiencies in both energy and water usage. Hydropower plays a dominant role in water consumption and the uncertainty on its consumption coefficient drastically intensify the uncertainty on global water consumption estimation. 18
20 Conclusions (2) The introduction of a mitigation policy (RCP37) generates a reduction on both freshwater withdrawal and consumption, as a consequence of the reduction in the energy demand. The combination of the RCP37 policy and the nuclear phase-out generates a reduction in freshwater withdrawal and consumption, due to the higher share of electricity produced through low waterdemanding energy sources (gas, wind and solar). 19


21 Thanks for your attention! The research leading to these results has received funding from the European Union s Seventh Framework Programme [FP7/ ] under grant agreement n