CLEMSON U N I V E R S I T Y
|
|
|
- Emil Garrison
- 5 years ago
- Views:
Transcription
1 Urban Growth on the South Carolina Coast: Modeling and Predicting the Future Coastal Carolina University - November 20, 2003 Strom Thurmond Institute CLEMSON U N I V E R S I T Y
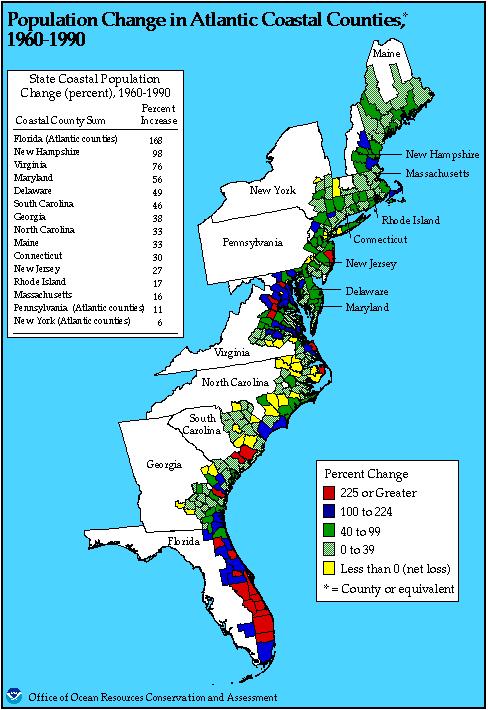
2 Population Changes Population Change in South Carolina from Population 1950 Population 1960 % Change 2,117,027 2,382, Population 1960 Population ,382,594 2,590,713 9 Population 1970 Population ,590,713 3,121, Population 1980 Population ,121,820 3,486, Population 1990 Population ,486,703 4,012, South Carolina population estimate ,885,736 Census Bureau predicts 1 million increase by 2025
3
4 Population Change in South Carolina Coastal Counties from County Population 1970 Population 1990 Population 2000 Beaufort 51,136 86, ,937 Berkeley 56, , ,651 Charleston 247, , ,969 Colleton 27,622 34,377 38,264 Dorchester 32,276 83,060 96,413 Georgetown 33,500 46,302 55,797 Horry 69, , ,629 Jasper 11,885 15,487 20,678 South Carolina 2,590,713 3,486,703 4,012,012
5 Total Acres of Land Conversion by State, (thousand acres) Rank STATE Acres converted to developed land (1,000 acres) 1 Texas Pennsylvania Georgia Florida North Carolina California Tennessee Michigan South Carolina Ohio Source: (London and Hill, 2000) -- USDA, 1997 National Resource Inventory Summary Report
6 South Carolina: Population Growth and Increase in Developed Land South Carolina: Comparison of Population Grow Increase in Developed Land % 30% 25% 20% 15% 10% 5% 0% 5.3% 30.2% Developed Land Population Source: (London and Hill, 2000) -- USDA, US Census Bureau and Jim Self Center on the Future, Clemson University.
7 Urban Sprawl Problems Uncontrolled growth - urban sprawl results in many problems such as: Increased cost of living Rising taxes and pressure on infrastructure and urban services Traffic congestion and increased (travel) time Environmental pollution/degradation Loss of farm/forest land, habitats and rural (natural) landscape Downtown declines and community segregation Increased dependence on the automobile Loss of sense of place - undifferentiated landscape
8 Benefits of Urban Sprawl Increased standard of living Generation of wealth Increase in amenities Production of affordable housing Increase in tax base New business opportunities New job opportunities Increased freedom with the automobile It is what we desire - Freedom of Choice

9
10 Charleston Area Urban Extent 1973
11 Charleston Area Urban Extent 1994

12

13
14 Urban Growth Trends (Past) Population Growth by 41% Population (in Thouthands) Population Growth ( ) Population : Persons in Persons in 1994 Net Growth: persons Average Net Growth: 9000 Persons per Year Annual Growth Rate: 2% Years Taken for Double: Year Urban Area Growth by 266% Sprawl Index 6 : 1 (ratio of urban area growth to population growth Urban Area (in Square Miles) Urban Area (in Square Feet per Person) Urban Growth ( ) Urban Area: Square Miles in Square Miles in 1994 Net Growth: Square Miles Average Annual Net Growth: 8.59 Square Miles Annual Growth Rate: 7% Years Taken for Double: Change in Per Capita Urban Area ( ) Urban Area: 5790 Square Feet in Square Feet in 1994 Net Change: 7297 Square Feet Average Annual Net Change: 347 Square Feet Annual Change Rate: 4% Years Taken for Double: Year Year
15 The urban growth prediction model assumes a 5:1 growth ratio out to the year It assumes no significant changes in policy.
16 Examples of Predictor Variables Slope Population Density Cost Distance Previous Urban Wetland Water Lines Roads Protected Land
17 Logistic Regression Prediction Focus Group Prediction Rule-Based Prediction Urban 1973 Urban 1994 Urban 2030 Non-Urban 2030 Water Interstate Hwy Secondary Hwy Comparison of Predicted Results of Four Models Integrated GIS Prediction

18 Charleston Area Urban Extent 1973

19 Charleston Area Predicted Urban Extent 2030

20 Beaufort Area Urban Growth Trends Urban Area Grows by 67% Population Grows by 20.6% Sprawl Index 3 : 1 (ratio of urban area growth to population growth)

21 Results---Predicted Urban Growth Beaufort County
22

23
24

25 Georgetown 2010 ratio 1:1
26 Georgetown 2030 ratio 1:1
27 Georgetown data Georegetown County: Predicted population and land use urban population land use(km2) Ratio 0.48:1 urban land use(km2) Ratio 1:1 urban land use(km2) Ration 2:1 urban land use(km2) Ration 3:

28 Horry 2010 r 3:1
29 Horry 2030 r 3:1
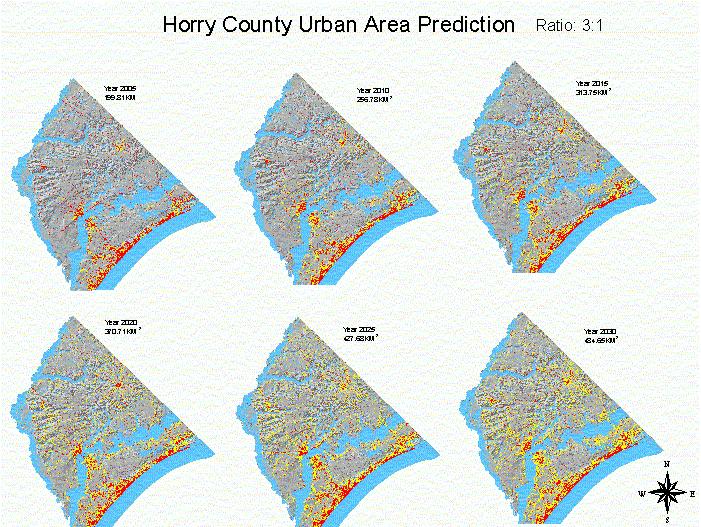
30 R 3:1
31 Horry County data Horry County: Predicted population and land use urban land use(km 2 ) Ratio 1.02:1 urban land urban land use(km 2 ) use(km 2 ) population Ratio 2:1 Ration 3:
32 Past Policies/Actions Encouraging Sprawl U.S. Mantra - Manifest Destiny - Growth is Good Zoning Policies - Separate Uses Regional Planning - Lacking, Fragmented Municipal Planning Highway Building - Currently Highway Maintenance Housing Policies - FHA - Mortgage Insurance National Flood Insurance Program - Coastal Competition for Tax Revenue - SPD s - More Fragmentation Lifestyle Choices - Expectation of Country Living with Urban Infrastructure
33 Number of Parcel Transactions Year Land (Parcel) Transaction in Murrells Inlet, The total number of parcels is 4107 of which 618 parcels have no transaction date and were thus excluded from the above chart. Calculated using only the data for years with at least one parcel transaction. 30 of 73 years during have no transaction at all.
 5.")
34 Government Policy Solutions for Growth Problems 1. Education for Local Decision-makers 2. Local Tax and Revenue Programs 3. Conservation Easements 4. Purchasable Development Rights (PDR s) 5. Federal and State Regulation/Protection

35