Bitterroot River Nutrient TMDL Technical Report WASTEWATER TREATMENT
|
|
|
- Ashlynn Young
- 5 years ago
- Views:
Transcription


1 Bitterroot River Nutrient TMDL Technical Report WASTEWATER TREATMENT Prepared By: Watershed Management Section Montana DEQ April 9, 2010 Technical Advisory Group Draft
2 1.0 INTRODUCTION This is a technical report prepared to support the nutrient Total Maximum Daily Load (TMDL) process in the Bitterroot Watershed. This report will investigate the current wastewater conditions in the area of concern. Information from this report will be used to construct a water quality model which will be used for TMDL source assessment and creating TMDL allocations. The water quality model will assess the potential significance of nutrient loading from all sources within the watershed. Wastewater is defined as any water that has been adversely affected in quality by anthropogenic influence. It comprises liquid waste discharged by domestic residences, commercial properties, industry, and/or agriculture, and can encompass a wide range of potential contaminants and concentrations. In its most common usage, it refers to the municipal wastewater that contains a broad spectrum of contaminants resulting from the mixing of wastewaters from different sources including household, industrial and commercial sources connected to a drainage system and routed to a treatment facility. There are numerous processes that can be used to treat wastewaters depending on the type and extent of contamination. Most wastewater is treated in mechanical or biological wastewater treatment plants (WWTPs) systems which may include physical, chemical and biological treatment processes. This report reviews past and current wastewater treatment conditions in the Bitterroot Watershed. Septic systems, or onsite household treatment systems, will be reviewed in a separate report. 2.0 Regulatory Overview Authority for permitting wastewater discharges is provided in the Federal Water Pollution Control Act (FWPCA) Title IV, Section 402. The wastewater permit program is known as the National Pollutant Discharge Elimination System (NPDES). Under NPDES, all facilities which discharge pollutants from any point source into waters of the United States are required to obtain a permit. The permit provides two levels of control: technology-based effluent limits and water quality-based effluent limits developed to protect the receiving water (if technology-based effluent limits are not sufficient to provide protection of the receiving water body). EPA provides authority to the State of Montana by a certification program in which Montana must meet specific programmatic requirements in order to hold FWPCA permitting authority under EPA supervision. A Montana Pollution Discharge Elimination System (MPDES) which is equivalent to an NPDES permit or a Montana Ground Water Pollution Control System permit (MGWPCS not an NPDES permit) is required from the Montana Department of Environmental Quality (DEQ) to construct, modify or operate a disposal system or to construct or use any outlet for discharge of sewage, industrial or other wastes into state surface or ground water. A permit is not required for the discharge of certain wastes under specific circumstances (see ARM , (1)(b) and (5), MCA). The following sections will review each permitted surface water wastewater discharge source in the Bitterroot Watershed. 1
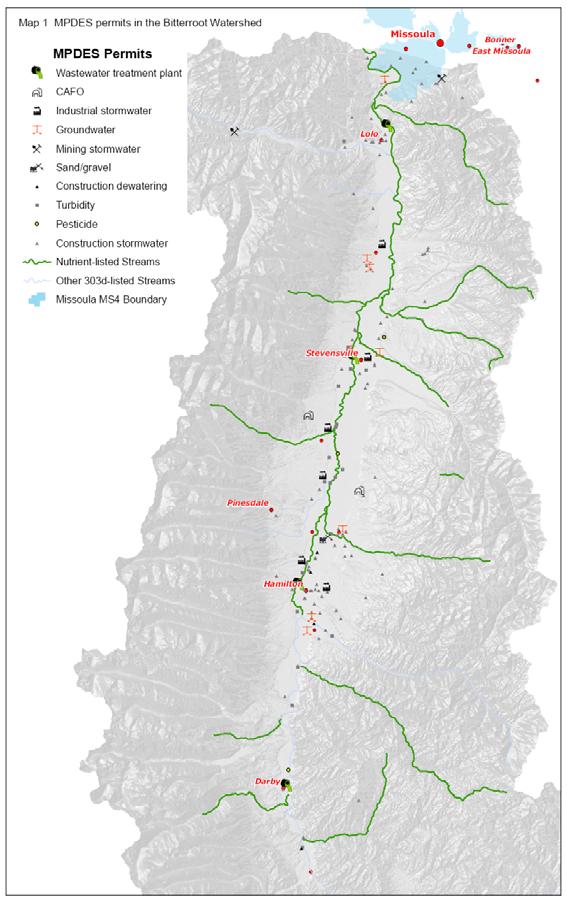
3 3.0 Municipal Wastewater Treatment Facilities with Permitted Surface Water Discharge WWTP point source flows from the sources identified in this paper are a small percentage of the total flow, about one percent of the seven-day consecutive low flow with a 10-year return frequency (7Q10) flow at Missoula. This analysis is based on previous studies and the Environmental Protection Agency s (EPA) National Pollutant Discharge Elimination System (NPDES) database. Alternatively, nutrient concentrations in effluents can be orders of magnitude higher than ambient in-stream conditions. 3.1 Darby (MTG580011) Darby is the most upstream WWTP in the watershed (Map 1) and operates a 3 cell facultative lagoon system that essentially works as a double cell lagoon. Approximately 710 people live in are serviced by the WWTP. Two initial cells are operated in parallel and both flow into the third cell for polishing prior to discharge. The facility was built in 1979 with a design capacity of million gallons per day (MGD). The outfall consists of a pipe discharging directly to a side channel of the Bitterroot River near river mile 78. The current mixing zone is 2000 feet long. The discharge is intermittent and discharges once a year for about four months, usually May-August but times vary each year. Monthly monitoring of discharge (Q), biological oxygen demand (BOD 5), total suspended solids (TSS), Fecal Coliform bacteria, total phosphorus (TP), Total Ammonia as N, NO 2 +NO 3 as N, total Kjeldahl nitrogen (TKN), and total nitrogen TN are required when discharge occurs. Currently there are effluent limits set for BOD 5 and TSS. A few noncompliance issues have been reported and were related to monitoring and data reporting. The city reports that inflow and infiltration (I/I) into the lagoons is estimated at 102,000 gallons per day (gpd) and average discharge is 52,000 gpd. According to the reported conditions, the lagoons may be leaking water to the local groundwater and are located near the stream. The current 7Q10 used in the permit for limit development is 120 cfs. Nondegradation based TN loads are 31 lbs/d and TP loads are 8 lbs/d which are based upon the third revision of guidelines for existing POTWs (10/19/94). There are also nondegradation loads provided in the permit for ammonia, chlorine, fecal coliform, BOD 5, and TSS. Typical summer time TN concentrations in the effluent range from 5-15 mg/l and typical total phosphorus concentrations range from mg/l. Typical TN loading ranges from 7-30 lbs/d when the town is discharging during the summer time. Typical total phosphorus loading ranges from 2-15 lbs/d when the town is discharging during the summer time. Both nitrogen and phosphorus loading per capita is high compared to other WWTPs, which is a characteristic of small lagoon systems (Figure 1). 2

4 3
5 3.2 Hamilton (MT ) Hamilton is located about 16 miles downstream of Darby on the Bitterroot River, below the confluence of Skalkaho Creek (Map 1). Hamilton s WWTP consists of an oxidation ditch with retrofitted BNR, clarifiers, and aerobic digesters. The current system was originally built in 1984 and was upgraded in 1998 to include an anoxic selector basin along with aeration and mixers in the oxidation ditch. Nitrogen loads subsequently dropped significantly in 1999 after the BNR treatment went online. The current design flow capacity is mgd, while recent operation is at approximately 0.7 mgd on average and maximum flows are near 1.35 mgd. The system currently services a population of about 5,200. Various upgrades are planed in the coming years. Rocky Mountain Laboratories and significant commercial and institutional facilities are present in the town. 4
6 Total Nitrogen Load Per Capita (lbs/day/person) Total Nitrogen (mg/l) Total Nitrogen Load (lbs/day) Quartiles Min/Max Median Darby Hamilton Stevensville Lolo Darby Hamilton Stevensville Lolo Max 0.14 Darby Hamilton Stevensville Lolo Figure 1. Existing summertime effluent concentrations and waste loads in the Bitterroot Watershed. Monthly monitoring includes Q, BOD 5, TSS, fecal coliform bacteria, TP, Total Ammonia, NO 2 +NO 3 as N, TKN, and TN. Effluent limits are set for BOD 5, TSS, Fecal Coliform, chlorine, oil and grease and ph. TN and TP nondegradation daily loads are indicated in the permit: TN=146 lbs/d and TP=36 lbs/d. The current mixing zone is 6,500 feet long but mixing zone studies will likely be performed in the near future. The 7Q10 of 152cfs used for the permit is calculated using the Darby USGS gauge plus adding Sleeping Child and Skalkaho creeks low flow conditions. A few noncompliance issues have been reported and were related to monitoring and data reporting. Total Phosphorous Load Per Capita (lbs/day/person) Total Phosphorous (mg/l) Total Phosphorous Load (lbs/day) Data: ICIS Reporting: Darby and Hamilton, Lolo ; Stevensville Max 13.1 Darby Hamilton Stevensville Lolo Max Darby Hamilton Stevensville Lolo Darby Hamilton Stevensville Lolo 5
7 Significant I/I occurs during the summer months when local groundwater tables are higher. Higher than normal influent BOD 5 loading per capita occurs. During portions of May, 2007 through March 2009 TP loads in the effluent were above the nondegradation daily loads likely due to a side-stream source. The permittee identified the side-stream source of the TP and changed operations to eliminate the source from the treatment process. A treatment pond used during previous design contains historically deposited sludge. The pond is located in an old oxbow of the river and is likely not lined. It is located on a city-owned rightof-way. Currently, treated bypass flows can be diverted to the pond although this has rarely occurred in recent decades. The city intends to eliminate the bypass capability and the use of this pond in the future. It is likely a source of nutrients to the Bitterroot River and may be included within a wasteload allocation. Typical summer time TN concentrations in the effluent range from 2-8 mg/l and typical TP concentrations range from 2-7 mg/l. Typical TN loading ranges from lbs/d when the town is discharging during the summer time. This facility is a state of the art system for nitrogen removal. Typical TP loading ranges from lbs/d when the town is discharging during the summer time. Nitrogen loading per capita is lowest of all the WWTPs in the watershed yet phosphorus loading per capita is the highest of the mechanical plants in the watershed (Figure 1). 3.3 Stevensville (MT ) Stevensville s current MPDES permit was renewed on August 10 th, 2006 and expires August 9 th, A modification of the permit was completed December 1, The facility consists of an oxidation ditch, clarification, UV disinfection with final treatment in a polishing cell (an old treatment lagoon with sludge still in place). Stevensville completed a project in 2000 that included construction of new secondary clarifiers, return/waste activated sludge pumping system (RAS/WAS), aerobic digestion and sludge drying bed expansion. This likely did not affect nutrient treatment. Also, some of the biosolids were removed from the polishing pond at this same timeframe, which might have slightly affected nutrient levels in the effluent. The polishing cell will likely be decommissioned prior to The design flow for the facility is mgd. The system was designed for servicing 2800 people, while currently there are about 2000 people serviced. The outfall discharges to an intermittent side channel of the Bitterroot River and the side channel enters the Bitterroot River near the Stevensville Cutoff Road crossing. The estimated 7Q10 of the Bitterroot River near Stevensville is 159 cfs. The current mixing zone is 1070 feet long but a permit modification will likely alter the permit to have no mixing zone in the near future. The polishing pond is unlined and some of the removed sludge from prior use as the primary settling pond is now part of the berms around the pond. Water levels rise and fall with the seasonality of river flows, irrigation, and wet weather groundwater recharge in the area of Stevensville [SOB dated June 14, 2006]. A review of DMR flow data for the 24-month period commencing June 2007 and ending May 2009 showed average monthly raw sewage influent flows to the facility of mgd. However, treated wastewater flows at the internal discharge site PLT, into the polishing pond for the same period showed average monthly flows of
8 mgd. At this point in the treatment process 70% of the waste stream appears to consist of groundwater infiltrated into the physical WWTP. As the wastewater flows through the polishing pond to Outfall 001, approximately mgd is lost, presumably exfiltrated into the groundwater. For the 24-month period reviewed, the average discharge from Outfall 001 was mgd, which is 92% higher than the average raw sewage influent flow to the plant for the same period. Significant I&I may occur within the treatment process although Stevensville indicates the flow measures at Outfall PLT may be inaccurate. Therefore, all of this may be due to a failure to monitor flow at PLT A accurately, not exfiltration. Effluent limits are provided for BOD5, TSS, Fecal Coliform bacteria, oil and grease, TN and TP at the outfall to the polishing lagoon. Future limits will be required by August, 2010 for E. coli bacteria and total residual chlorine. Monthly TP, Total Ammonia as N, NO 2 +NO 3 as N, TKN, and TN monitoring is required at the influent and effluent of the polishing lagoon. Acute WET tests are required quarterly during the third year of the permit cycle. Total Recoverable Metals monitoring is required during the 1 st and 3 rd quarters of calendar years 2 and 3 of the permit cycle. The permit requires a groundwater study of the polishing lagoon, a feasibility study to determine how to move the effluent to the Bitterroot River and a future action plan to be completed by The current permit modification identifies that the City will decommission the polishing lagoon and will continue to discharge to the intermittent side channel with no mixing zone. All limits will apply at the end of pipe. A decommissioning ground water study for abandoning the lagoon is needed and will be conducted in the near future. The polishing lagoon may be a source of nutrient loading to the groundwater. The modification also states the following: Nutrient limits were established in the existing permit that apply during the growing season, defined as June through September of each year. The limits are based on the performance of the WWTP from 2000 through 2005 and were established in accordance with the TSD procedures. The limits do not increase the nutrient load to the Bitterroot drainage. No additional WQBELs are required. The limits will serve as an interim wasteload allocation for the POTW until the TMDL is completed. Additional reductions in nutrients may be necessary in the future as part of a basin-wide TMDL. These limits are set at average monthly loads of 41.2 lb/d TN and 9.1 lb/d TP and maximum daily loads of 60.3 lb/d TN and 12.3 lb/d TP. These loads were set to assure no increased load prior to TMDL formation. Typical summer time TN concentrations in the effluent range from 3-6 mg/l and typical TP concentrations range from mg/l. Typical TN loading ranges from lbs/d during the summer time. Typical TP loading ranges from 7-11 lbs/d during the summer time. Both nitrogen and phosphorus loading per capita is about median when considering each of the three mechanical plants in the watershed (Figure 1). These values are from the polishing cell effluent, and are likely low due to dilution when comparing to future concentrations after the cell is removed. Alternatively, accurate flow measurements from the mechanical plant are not available. 7
9 3.4 Missoula County Commissioners, Lolo Rural Sewer Improvement District #901 (MT ) Lolo s current MPDES permit (MT ) was renewed on August 1 st, 2007 and expires July 31, Lolo is located on the Bitterroot River downstream of the Lolo Creek confluence. The facility consists of an activated sludge system with chlorine disinfection and aerobic sludge digestion and was built in The system was designed for servicing 2500 people, while currently there about 2300 people being serviced. In the past there were upsets from commercial uses and subsequently a pretreatment program was initiated. An upgrade was completed during 2002 which added a clarifier, upgraded the headworks and provided an aeration basin retrofit. An alum flocculation retrofit trial was conducted at one point and was found to significantly reduce phosphorus nutrient loading. I/I in the collection and treatment system are estimated at mgd. The facility will be upgraded during 2010 with a UV disinfection system. The design flow was originally for mgd and the latest renewal application indicated the 2002 upgrade could service mgd. The continually discharging effluent is located on the left bank about two miles below Lolo Creek s confluence in the Bitterroot River. The chronic mixing zone is 1291ft. Acute mixing zones will need to be developed for some parameters. A few noncompliance issues have been reported and were related to BOD5 exceedances, quality assurance and control (QA/QC) record keeping issues, and data reporting delinquency. Monthly monitoring of Q, BOD 5, TSS, Fecal Coliform bacteria, TP, Total Ammonia as N, NO 2 +NO 3 as N, TKN, and TN are required. Weekly nutrient (TP, NO 2 +NO 3, TKN, and TN) monitoring is required from June though September. Currently there are effluent limits set for BOD 5, TSS, E. coli bacteria TN, TP, oil and grease, ph, and total residual chorine. The current 7Q10 used in the permit is 392 cfs and calculated based on USGS gauge five miles downstream. Nondegradation loads were provided for TN and TP but are not relevant to the TMDL process as they are higher than ensuing limits. Both average monthly limits and maximum daily limits are provided for TN and TP based upon the premise that there shall be no increase in total loading prior to TMDL formation. These loading limits were provided because of an application to increase discharge volume from mgd to 0.32 mgd. A method outlined by EPA (Technical Support Document for Water Quality-based Toxics Control, EPA/505/ ) was used to determine Maximum Daily and Maximum Average Monthly TN and TP limits based upon the DMR data for the facility. These nitrogen limits are set at 45.0 lbs/d for the Average Monthly Limit and 61.1 lbs/d for the Maximum Daily Limit. The phosphorus limits are set at 8.2 lbs/d for the Average Monthly Limit and 10.2 lbs/d for the Maximum Daily Limit. Typical summer time TN concentrations in the effluent range from mg/l and typical TP concentrations range from mg/l. Typical TN loading ranges from lbs/d during the summer time. Typical TP loading ranges from 4-10 lbs/d when the town is discharging during the summer time. Monitoring data indicates that the TN and TP load limits in the permit are likely exceeded periodically. Nitrogen loading per capita is the highest and phosphorus loading per capita is the lowest of the three mechanical plants in the watershed (Figure 1). 8
10 4.0 UPGRADE SUMMARY Significant WWTP upgrades that may affect nutrient concentrations in the effluent from 1993 to present are provided in Table 1. Note that this table does not include all upgrades, only those likely to affect nutrient concentrations in the effluent. Table 1. Recent treatment plant upgrades in the Bitterroot Watershed which may affect effluent nutrient loads City Year of upgrade Upgrade Type Darby None None Hamilton 1998 Biological Nutrient Removal added anoxic selector basin along with aeration and mixers in the oxidation ditch. Stevensville 2000 Construction of new secondary clarifiers, RAS/WAS pumping, aerobic digestion and sludge drying bed expansion. Some sludge was removed from the polishing pond. Lolo 2002 A clarifier and aeration basin retrofit was added. 5.0 MONITORING DATA An Excel spreadsheet with all nutrient monitoring data from the above facilities has been compiled from the EPA NPDES database, the Integrated Compliance Information System (ICIS) (Appendix A). Data from 1993 to 2009 is included in this file because the modeling timeframe covers most of this time period. 6.0 SOURCE ASSESSMENT STRATEGY 6.1 ICIS and USGS Data Analysis Effluent nutrient concentrations, discharge and loading data may be analyzed using graphical, statistical and other summary approaches for displaying source information in the TMDL document. Simple source assessment approaches will be used which will include mixing calculations and load comparisons using existing effluent conditions, permitted loads according to existing permits, existing instream 15 or 30Q10 flow conditions and the loads which the TMDL will allow at 15 or 30Q10. This information will be useful for TMDL development along with the SWAT model WWTP scenario output. 6.2 Wastewater Point Source Soil and Water Assessment Tool (SWAT) Model Development 9
11 Sediment and nutrient loading data from point source WWTPs within the Bitterroot consist of four sites that include Darby, Hamilton, Stevensville, and Lolo. Loading from these WWTPs will be read into SWAT as point sources from 1993 to Monthly ICIS results will be interpolated to represent daily conditions. An online report produced from ICIS (ICIS, 2010) will be used to provide nutrient constituent values for these four treatment plants. The available period of record for each plant is shown in Table 2. For a number of years, however, portions of this database are unavailable. From the available ICIS records, various approaches will be used to fill in missing monthly data for the WWTP sites. For the Darby WWTP, monthly discharge versus nutrient data from 2000 to 2002 were used to develop linear regression models for TN and TP. These models will be used to estimate nutrient data from January 1993 to December 1999 based on known monthly values of discharge for this period. Nutrients are reported quarterly at the Hamilton (January 1993 to December 1995) and Lolo sites (January 1993 to June 2007). These quarterly values will be used to estimate monthly values by interpolation. For the Stevensville site, values of TN and TP reported from July 1996 to December 1998 were averaged to represent respective values for the January 1993 to June 1996 period. Also, the only data prior to mid 2006 for Stevensville was collected after their mechanical system treatment process but before the water flowed through a polishing pond. Recent data in the effluent and the pre-polishing pond indicate nutrients are not treated in the pond and the pre-2006 data are representative of Stevensville s WWTP loads. SWAT model results will compare the WWTP loads with all other significant sources in the watershed, including natural and other nonpoint sources. Loads from each individual WWTP will be reported in a Bitterroot SWAT Results Report on an average monthly basis (a daily load). WWTP loads (from all cities) may be combined in some graphics within the report. Model calibration or validation reporting will be provided to represent current effluent conditions post 2002 when the last WWTP upgrade that was likely to affect nutrient levels was completed. Table 2. Data sources and potential estimation techniques for computing monthly nutrient and sediment values from the four Bitterroot WWTP sites 10
12 Treatment Period of Nutrient Sediment Plant Record Data Source or Method of Estimation Data Source or Method of Estimation Darby 1/1993 to 12/1999 Monthly discharge known for period; N and P Monthly discharge known for period; constant estimated from regression analysis of monthly sediment conc value assumed from 2000 to discharge versus nutrient data from 2002 data; sediment load estimated from conc 2000 to 2002 reported in ICIS value and known monthly discharge for period Darby 1/2000 to 11/2009 Data reported from ICIS Data reported from ICIS Hamilton 1/1993 to 2/1996 N and P reported quarterly for period based on Monthly discharge known for period; sediment DEQ DMR 2002: N and P estimated on monthly estimated from regression analysis of monthly basis by interpolation from quarterly values discharge versus sediment data from March 1996 to Dec 2000 reported in ICIS Hamilton 3/1996 to 12/2009 Data reported from ICIS Data reported from ICIS Stevensville 1/1993 to 6/1996 Values of N and P reported in ICIS from July 1996 Values of sediment reported for July 1996 to to Dec 1998 used to compute average of N and Dec 1998 used to compute average value of P for period sediment for period Stevensville 7/1996 to 12/2009 Data reported from ICIS Data reported from ICIS Lolo 1/1993 to 6/1993 N and P reported quarterly in DEQ DMR 2002; July 1993 to Dec 1993 data reported in ICIS N and P estimated on monthly basis by used to estimate average load for Jan 1993 interpolation from quarterly values to June 1993 Lolo 7/1993 to 12/2009 N and P reported quarterly in ICIS; these values Sediment reported quarterly in ICIS; these were used to estimate N and P on a monthly values were used to estimate sediment on a basis by interpolation monthly basis by interpolation 6.3 Wastewater Allocation Scenarios for SWAT Model Development Once the SWAT model is calibrated to the available ambient water quality data in the Bitterroot Watershed, and the wastewater and all other likely significant source categories are verified within the SWAT model, scenarios for restoration approaches will be run within the model framework. Baseline WWTP conditions will represent effluent levels from 2002 to present due to recent upgrades in the facilties. An economic feasibility study for each municipality with a WWTP discharge will be completed and will include alternative nutrient reduction treatment analyses. These assessments will provide a framework for wastewater treatment scenarios within the SWAT model framework. Scenarios include characterizing existing conditions, increasing treatment plant nutrient reduction capabilities and increasing wasteloads due to population increases and septic conversion (Table 3). Spatial consideration for SWAT nutrient reporting will consider end-of-pipe loads and loads that are likely to reach the Clark Fork River. The economic feasibility studies, alternative nutrient reduction treatment analyses, subsequent SWAT scenario results and data analysis approaches provided in Section 6.1 will be used to develop nutrient TMDL wasteload allocations in the Bitterroot Watershed. Table 3. WWTP SWAT Scenarios Scenario Basis Number of Model Runs Comparisons Needed 11
13 Scenario 1. Existing (2002-present) 2. Increased Treatment Capabilities 3. Load increased to existing permit conditions 4. Increased Load from Population Growth 5. Increased Load From Converting Nearby Septic 6. Combinations of Growth and Treatment Capabilities Basis Calibration may capture timeframe of old infrastructure and not accurately depict current loads. Certain municipalities may be able to add nutrient reduction process to facilities. Determine via economic feasibility and alternative nutrient reduction treatment analyses. Test how protective current permit conditions may be. Increase flow of effluents based upon estimated population growth Increase flow of effluents based upon # of potential septic conversions near city Number of Model Runs Comparisons Needed 10 Runs: All WWTP All WWTP discharging discharging, all WWTP to all WWTP off; Each off, each WWTP individual WWTP discharging, each discharging to each WWTP off. WWTP off. Number of model runs Nutrient treatment will depend upon capabilities will be economic feasibility and compared to existing alternative nutrient conditions for each reduction treatment facility and for all analyses. Projected facilities combined. number of model runs ~ 5 ~5 model runs Compare load increases to existing conditions ~10 Five runs (each plant and all plants) each for two population growth timeframes ~5 Five runs (each plant and all plants) for one timeframe See scenarios 4 and 5. ~10 Five runs (each plant and all plants) for possibly two population timeframes and treatment capabilities combined. Compare load increases to existing conditions Compare load increases to existing and to septic scenarios (in different technical report) Compare to existing conditions and increased treatment scenarios 12