Uncertainty and Sustainable Energy Investments
|
|
|
- Baldwin Butler
- 5 years ago
- Views:
Transcription

1 Uncertainty and Sustainable Energy Investments Michael J. Kelleher Executive Director Energy and Sustainability SUNY College Of Environmental Science and Forestry
2 Energy Inelastic Demand Price p 2 Inelastic Demand Large price change leads to relatively small quantity change (price goes up quantity demanded goes down) p 1 q 2 q 1 Quantity
3 Energy Price Response Why is energy demand relatively inelastic? Price Information Technology Alternatives Other Why would industrial customers be more price responsive than residential or commercial customers? Why should utilities and regulators care if customers are responsive to prices? What could be done to make customers more price responsive? What makes it hard to develop price responsiveness?
4 Energy Resources Depletable take a very long time to be replaced (i.e. growth rate of stock is essentially zero). Renewable self renew within a time frame relevant to economic decision making. Storable Most energy resources are storage, petroleum, natural gas and coal, but electricity is not (except in limited amounts batteries) Renewable resources such as biomass, some hydro, and some geothermal are storable.
5 Resource Value Questions Are depletable resources more or less valuable than renewable resources? Why? Are storable resources more or less valuable than non-storable resources? Why?
6 Economic Scarcity Natural resources have economic and geologic dimensions. The geologic stock of a natural resource (oil) is based on the amount of that resource within the earths crust. The economic analysis of the amount of the resource can be extracted depends not only with what is physically available, but the marginal extraction costs and what people are willing to pay for it.
7 Rational Decisions Access to information Make good choices Bounds to the extent that people are rational. Do markets reflect social optimal results?
8 Net Present Value (NPV) or Discounted Cash Flow (DCF) Cash flow (FCF)= operating cash flow minus capital expenditures Operating cash flow means ignore financing (interest) costs. Financing costs are captured in the return ( r). Cash flow is the difference between dollars received (cash inflows) and dollars paid (cash out-flows) Estimate operating cash flows on an incremental basis. Incremental cash flow = cash flow with project cash flow without the project Sunk Costs are not included because they are not future cash flows.
9 Which is Better DCF or Payback Analysis? Advantages DCF? Advantages Payback Analysis?
10 DCF If net present value is positive (cash inflows exceed outflows), accept the project. When resources are limited, and only one investment can be made, choose the investment with the highest net present value. DCF recognizes the time value of money DCF makes cash flows over time comparable by converting the cash flows into the same time frame (usually the present)
11 Now consider two mutually exclusive investments You walk into todays session and are handed $10,000 (but must stay for the entire class in order to keep it, and any returns you make during the class). During the session you are given two choices: Investment A: You give me the $10,000 and I immediately give you back $15,000. or Investment B: You give me the $10,000 and one hour later I give you $16,000 back. Which do you choose? Why?
12 If you had $10,000 to invest, and were considering two possible investments. 7 kw Photovoltaic system with a $6,000 net present value and a 12 year payback period, New wood boiler with a $5,000 net present value and a 7 year payback period, Which investment would you choose? Why?
13 Investment Question How many of you would like to buy a 30 year bond (investment grade) today that paid 12% interest (after tax). A 12% after tax return Current municipal bod yields for 30 years are 3-4% yields (at best)
14 Residential Photovoltaic Example
 and physical supply (biomass).")
15 Energy Project Risk Issues Fuel Choice (biomass, solar, efficiency and natural gas) Risk of price variation, physical supply and correlations Renewable fuels (biomass and solar), technology performance, intermittent supply issues (solar) and physical supply (biomass). Can Mitigate some risks with Technology and Fuel diversity (with a cost) Risk management (technology failure) Choice of uncorrelated fuels Redundancy of supply Economic Analysis Scenario variation Discount rate Externalities Environmental Impacts Current and future emission regulations.
16 Campus Steam Distribution System Gateway Moon Illick Baker Jahn Marshall Steam originally supplied by Syracuse University Steam distributed at high pressure (110 psi) Annual campus steam use is 56,000 MMBtu
17 Campus Electrical Distribution System Illick Gateway Moon Baker Jahn Marshall
18 Power Requirement, kw Campus 4,160 kw Electric Load Profile Electric Load Profile 2,750 2,500 2,250 2,000 Peak Demand 1,750 1,500 1,250 Avg "On Peak" 1,000 Avg "Off Peak" Jul-07Aug-07Sep-07Oct-07Nov-07Dec-07Jan-08Feb-08Mar-08Apr-08May-08Jun-08 Month
19 Why Combined Heat & Power? Conventional Energy Systems High Pressure Steam 83 Units 70% of Energy Wasted as Heat to Atmosphere 100 BOILER STEAM TURBINE DISTRIBUTION Units 35 GENERATOR (Efficiency = 83%) (Eff. = 42%) (Eff. = 94%) Units Units Units SYSTEM (Eff. = 90%) Electrical Efficiency 30% Distribution Efficiency 90% CONDENSER Heat to Campus 45 Units 165 Fuel Source units yields: 30 Units of Electricity, and 45 Units of Thermal Energy 65 Units BOILER (Efficiency = 78%) Thermal Efficiency 70% Overall Efficiency: 45%
20 Why Combined Heat & Power? Topping Cycle Cogeneration System 95 Units GAS TURBINE 34 Units GENERATOR (Eff. = 94%) 30 Units 95 Fuel Source units yields: 30 Units of Electricity and 45 Units of Thermal Energy HEAT RECOVERY STEAM GENERATOR 45 Units Steam to Campus Overall Efficiency: 78%
21 Why Combined Heat & Power Bottoming Cycle Cogeneration System High Pressure Steam 80 Units 100 Units BOILER BACKPRESSURE STEAM TURBINE GENERATOR 8 Units 70 Units 100 Fuel source units yields: 8 units of electrical, and 70 units of thermal To Campus Heating System Overall Efficiency: 78% 21


22 Technologies Considered Biomass gasification / combustion with backpressure steam turbine Biomass gasification to power gas turbine or reciprocating engine Liquid biofueled gas turbine or reciprocating engine Natural gas fired gas turbine or reciprocating engine with heat recovery

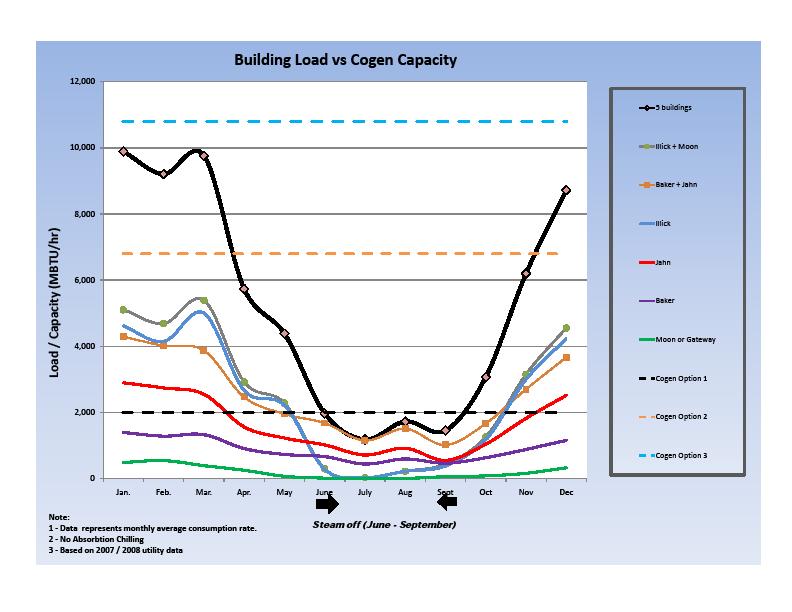
23 3 Scale Options Power
24 SUNY ESF Fuel Costs Fuel Cost/Unit Cost/MMBtu Thermal Efficiency Delivered Thermal Cost/ MMBtu Electricity $ 0.13 / kwh $ 44 98% $ 45 Gas $ 0.75 / ccf $ % $ 9 Wood Pellets $ 180 / ton $ % $ 12 Wood Chips $50 / ton $ % $9 Steam (present) Steam (future) $16.50 / Mlb $ % $ 17 $ 25 / Mlb $ 25 98% $ 26 Biodiesel $ 3.00 / gal $ 25 80% $ 30
25 Operating Cost and Efficiency: By System Cost vs. Value (component) Component Input Cost $/hr Output Value $/hr Gas Pellets Biodiesel Total Electric Thermal Total Output/ Input Pellets (medium size) $ 0 $ 75 $ 0 $ 75 $ 13 $ 156 $ Natural gas micro turbine $ $ 0 $ 0 $ $15.60 $ $ Biodiesel micro turbine $ 0 $ 0 $ 7.50 $ 7.50 $ 3.90 $ 5.20 $ Thermal Input vs. Value (component) Component Input MMBtuh Output Value MMBtuh Gas Pellets Biodiesel Total Electric Thermal Total Output/ Input Pellets (medium size) Natural gas micro turbine Biodiesel micro turbine
26 Chilled Water Production Costs Cost per ton hour Energy Rate Existing electric chillers $.08 $ 0.13 / kwh Highest efficiency electric chillers $.06 $ 0.13 / kwh Absorption chiller (single effect, low pressure/temp) Absorption chiller (single effect, low pressure/temp) Absorption chiller (double effect, high pressure/temp) Absorption chiller (double effect, high pressure/temp) Absorption chiller (single effect, low pressure/temp) $ $ / MMBtu $ $25 / MMBtu $ $16.50 / MMBtu $ $25 / MMBtu $ $150 / ton $ 0.13 / kwh 26

27 Wood Pellets preferred due to: Higher energy density (reduced storage volume) Can be generated from a variety of wood products Simplified material handling Reduced operation and maintenance requirements Higher reliability in an unsupervised operation Wood Pellets v Wood Chips Simplified delivery approach 27
28 Wood Pellet Delivery Wood Pellet Delivery Cogen Option S.S. Mass Flow Lbs/hr Tons 3 Day Storage 5 Day Storage 7 Day Storage Cubic Ft Sq. Ft Tons Cubic Ft Sq. Ft Tons Cubic Ft Sq. Ft Small Scale Medium Scale Large Scale Delivery Frequency (20T per load) Small Scale Medium Scale Large Scale 10 days 2 days Daily NOTE: Sq. Ft is based on 15 ft. bin height 28
29 Steam Use, LB Summary of Monthly Consumption Monthly Campus Steam Consumption FY ,000,000 9,000,000 8,000,000 7,000,000 6,000,000 5,000,000 4,000,000 3,000,000 2,000,000 1,000,000 0 Jul- 07 Aug- 07 Sep- 07 Oct- 07 Nov- 07 Dec- 07 Jan- 08 Feb- 08 Mar- 08 Apr- 08 May- 08 Jun- 08 Month
30
31 Final Plant Configuration lb/hr Chip Tec Wood Pellet Boiler Operating at 150 psi lb/hr Cleaver Brooks Gas Boiler operating at 150 psi lb/hr Cleaver Brooks Boiler operating at 30 psi 1 Carrier Micro-steam Backpressure Steam Turbine 250 kw at 10,000 lbs/hr, 150 psi inlet, 30 psi outlet 3 65 kw Gas Fired Capstone Microturbines 1 Cain Heat Recovery Steam Generator 800 lb/hr, 30 psi

32 CHP Equipment Air Quality Thermal Power Generation Air Delivery

33 CHP in the Gateway Building
34 CHP Plant Performance CHP Plant will Produce: - 62% of Total Campus Thermal Load - 20% of Total Campus Electrical Load CHP Plant will Save: - 54 Trillion Btu Fossil Fuel Per Year - $350,000 year in Operating Costs - Plant will reduce total campus emissions by > 30%

35 CHP Emissions 55 Chimney w/ ESP
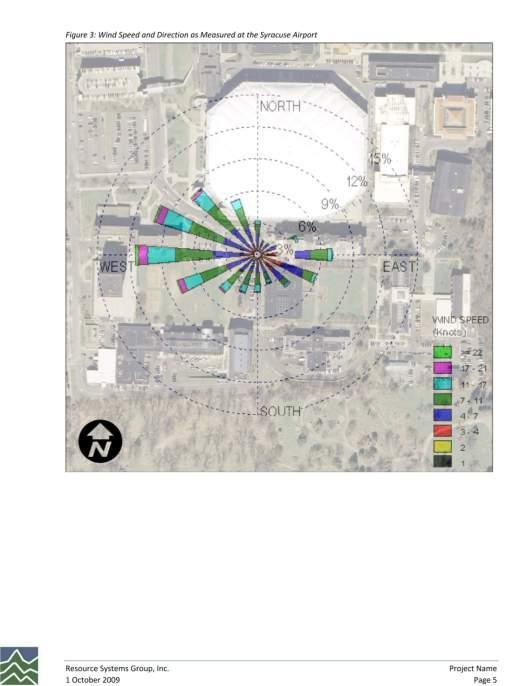
36 Emissions / Permitting Challenges -Urban Location -Close Proximity to Taller Buildings -Nearby Outside Air Intakes and Operable Windows -Real / Perceived Issues with Biomass Emissions -Federal Permitting Requirements are in Flux -RSG Engaged to do Emissions Study 36

37 Air Quality National Ambient Air Quality standards Carbon Monoxide Lead Nitrogen Dioxide Particulate Matter PM10 Particulate Matter PM2.5 Ozone Sulfur Dioxide

38 PM2.5 Concentration at Equipment 0.60 lb/mmbtu NYS Code lb/mmbtu Electrostatic Precipitator reduces concentration of PM2.5 by 90% lb/mmbtu 0.03 lb/mmbtu (MACT Rule*) Electrostatic Precipitator 0 Pre ESP Post ESP Regulations * MACT Rule has not yet been adopted

39 Stack Height
40 Modeled CHP Emissions meet Ann. Ave. Standard 15 µg/m³ 132,356 µg/m³ Current EPA NAAQ Standard for PM µg/m³ 9.4 µg/m³ 10.3 µg/m³ 9 µg/m³ Background (Annual Avg) Carrier Dome Air Intake Carrier Dome Roof High Illick Windows
41 Questions Why is energy demand relatively inelastic? Are storable resources more or less valuable than non-storable resources? Why? What are advantages/disadvantages of DCF and Payback Analysis?
42 Summary Risks are part of all investment choices Can model risks financially with scenario analysis and by adjusting discount rate. Renewable technologies offer often missed risk mitigation benefits by providing fuel source that isn t correlated with fossil fuels.