On Southern Timber Markets: A Case Study of North Carolina. Key factors driving renewable energy demand are state and federal policies requiring the
|
|
|
- Amy Park
- 5 years ago
- Views:
Transcription
1 1 2 3 Effect of Policy-based Bioenergy Demand On Southern Timber Markets: A Case Study of North Carolina Robert C. Abt a, Karen L. Abt b, Frederick W. Cubbage c and Jesse D. Henderson d 4 5 Abstract Key factors driving renewable energy demand are state and federal policies requiring the use of renewable feedstocks to produce energy (renewable portfolio standards) and liquid fuels (renewable fuel standards). However, over the next decade, the infrastructure for renewable energy supplies is unlikely to develop as fast as both policy- and marketmotivated renewable energy demands. This will favor the use of existing wood as a feedstock in the first wave of bioenergy production. The ability to supply wood over the next decade is a function of the residual utilization, age class structure, and competition from traditional wood-users. Using the North Carolina Renewable Portfolio Standard as a case study, combined with assumptions regarding energy efficiency, logging residual utilization, and traditional wood demands over time, we simulate the impacts of increased woody biomass demand on timber markets. We focus on the dynamics resulting from the interaction of short run demand changes and long term supply responses. We conclude that logging residuals alone will be unable to meet bioenergy demands from North Carolina s Renewable Portfolio Standard. Thus, small roundwood (pulpwood) will be a Corresponding author: Professor, Department of Forestry and Environmental Resources, North Carolina State University, Raleigh, NC ; bob_abt@ncsu.edu; (919) b Research Economist, Southern Research Station, US Forest Service, PO Box 12254, Research Triangle Park, NC 27709; kabt@fs.fed.us c Professor, Department of Forestry and Environmental Resources, North Carolina State University, Raleigh, NC ; fred_cubbage@ncsu.edu d Graduate student, Department of Forestry and Environmental Resources, North Carolina State University, Raleigh, NC ; jdhende2@ncsu.edu 1
2 used to meet remaining bioenergy demands, resulting in increased timber prices and removals; displacement of traditional products; higher forest landowner incomes; and changes in the structure of the forest resource Keywords: renewable electricity portfolio standard, biomass supply, timber markets, logging residuals, timber supply projections 2
3 Introduction Interest in renewable sources of energy has historically been correlated with the price of oil. More recently, the recognition of carbon s role in climate change and a national security interest in reducing dependence on imported oil has solidified interest in renewable energy. The policy response includes renewable portfolio standards (RPS) (or renewable electricity standards) for electricity and renewable fuel standards (RFS) for liquid transportation fuels at both state and national levels. However, limited infrastructure to use solar, wind or other renewables, the potential to co-fire wood in coal plants, and a seemingly plentiful supply of forest residues, has led to a focus on woody biomass as a key renewable feedstock in the short run. At the same time, a decade of reduced forest planting and the current recession are reducing the availability of residuals in the short run and the supply of pulpwood in the longer run. We use the term pulpwood to refer to roundwood of insufficient size or quality to be used for sawtimber Many studies of using wood for energy focus on the use of wood residuals from logging and manufacturing [1, 2, 3, 4, 5, and 6]. This focus has minimized concern about the impact of wood-for-energy on traditional wood-using industries. However, in a supply analysis evaluating the effect of national RPS and RFS on North Carolina, Virginia and South Carolina, Galik et al. [7] estimates that considerably less logging residual volume is available than was assumed in previous studies, partly due to differing estimates of available residuals (residuals are only produced when harvest occurs), and partly due to differing assumed levels of utilization of these logging residuals. Galik et al. [7] also 3
4 found that residuals alone will meet biomass energy demand in the presence of a national RPS or RFS only until 2012 in the Mid-Atlantic region. These analyses have not addressed the impacts of increased bioenergy demand on traditional wood-using industries or focused on the differences between short-run and long-run impacts North Carolina was the first southeastern state to enact an RPS [8], and while North Carolina s RPS is less ambitious than many of the federal proposals; it nevertheless has the potential to affect the traditional wood-using industry, long a mainstay of the state s economy. In this paper, we developed a hypothetical portfolio of renewable energy for the State, and estimated the proportion of renewable demand that is likely to be met by woody biomass, either through residuals or pulpwood. We then modeled the effects of the RPS on wood prices and traditional wood users in North Carolina Modeling Approach Woody biomass supply was modeled using the Sub Regional Timber Supply (SRTS) model [9], which has been used in assessments of forest resources in the US South ([9, 10, 11,] and the US Northeast [12]. SRTS is currently supported and used by a consortium of 19 forest resource-based companies, energy firms, and consultants who are members of the Southern Forest Resource Assessment Consortium at NC State University. The model develops supply estimates from a supply function based on local harvest and inventory, and an exogenous demand scenario. In this paper, demand 4
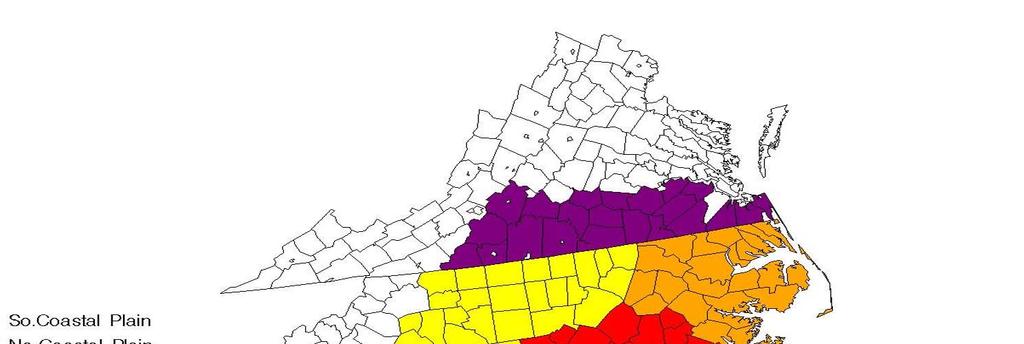
5 72 73 scenarios were developed using demands from existing traditional users and potential bioenergy users SRTS uses the U.S. Forest Service, Forest Inventory and Analysis (FIA) dataset of inventory, growth, removals, and acreage by forest type, private ownership category, species group, and age class to model inventory change by product for small areas (typically the 58 FIA survey units in the southern region) [13]. The product inventory is assumed to shift a resource supply curve by owner and region. This detailed subregional supply is equilibrated with a regional demand curve. In each year, product demand is shifted based on the user-defined scenario and supply is shifted by the biological accounting module. The market clearing price and harvest are calculated; harvest is passed to the biological accounting module; and inventory is updated for the next period s equilibrium calculation. Product inventory and harvest are estimated by applying diameter distributions and cull factors to harvest and inventory by age class Existing Forest Product Demand In order to model the effect of increased energy demand, the model was first solved for an assumed base level of demand for the Piedmont and Coastal Plain regions of North Carolina and the border counties of in Virginia and South Carolina as shown in Figure 1. Inclusion of border counties allows the model to draw resources from these areas, but also includes demand for wood from those counties. 94 5
6 Initial demand for standing timber was based on the most recent FIA growing stock removal levels derived from the annual surveys in each state in the South. We assume a drop in demand for all wood products of 30 % from 2005 to 2009, with a rebound occurring from 2010 to 2013 of equal magnitude. Existing demands return to the average levels and stay at that level throughout the projection period NC RPS Biomass Demand The policy-driven demand for woody biomass to generate energy is in addition to the demands from the existing traditional wood users. North Carolina s RPS legislation requires that the renewable energy proportion of total energy supply increases in a series of steps that achieve 12.5% of the total energy portfolio by For this analysis, we focus solely on the already-enacted NC RPS. We develop a hypothetical renewable energy portfolio by making pragmatic assumptions regarding the role of energy efficiency, the role of residuals in meeting that demand, and the outlook for traditional wood markets. We do not consider the impacts of national renewable electricity or fuels standards on North Carolina The North Carolina Renewable Portfolio Standard requirements are summarized in Table 1. The requirements designate a percentage of retail electricity sales that must come from renewable sources, and this percentage changes over time in discrete steps. Sources of energy that qualify as part of this portfolio include solar electric, solar thermal, wind, biomass, hydropower, geothermal, ocean current, and wave energy, in addition to energy 6
7 efficiency measures and combined heat and power facilities. A renewable facility is only eligible if it was placed into service after January 1, This requirement will ensure the development of renewable energy beyond the 4.5% capacity already in place in North Carolina [16]. The final requirement of the RPS is 12.5% of 2020 retail sales in 2021 and thereafter. As such, the size of the portfolio is assumed to remain unchanged after In order to construct a hypothetical portfolio, electric power generation data was retrieved from the Energy Information Administration [16]. The average generation for was used as a baseline estimate for 2005, and future power generation was projected with an annual growth rate of 1.9% as suggested by La Capra Associates [17]. The renewable requirement in the RPS is amplified by the increases in demand. For example, if growth in demand occurs 1.9% per year between 2012 and 2015, the 6% RPS requirement requires more than a doubling of renewable capacity Conversely, increased energy efficiency reduces retails and lowers requirements for future renewable capacity. CEO Jim Rogers of North Carolina-based Duke Energy recently proclaimed that energy efficiency is the key to his company s ability to change to cleaner sources of energy [18]. Prior to 2021, no more than 25% of RPS requirements for electric public utilities can be met with energy efficiency measures, and after 2021, up to 40% of the portfolio can stem from energy efficiency. The energy efficiency requirements for independent producers are different; there is no cap for energy efficiency s share, and efforts that exceed the requirements of one year can be used as 7
8 credits for the following year. Energy efficiency was treated as an annual reduction in consumption, resulting in a dampened growth rate of 0.4% This analysis assumes that energy efficiency constitutes the maximum allowable 25% of the hypothetical renewable portfolio up to After this date, we opted to hold efficiency at 25% of the renewable portfolio, since these levels already represent unprecedented efficiency success. Because the RPS legislation only lays out requirements for specific years, the size of the portfolio is constant in the intervening years. Still, we assume utilities steadily build renewable capacity in anticipation of future increases in renewable requirements The RPS also includes minimum requirements for electricity generated from solar as well as swine and poultry waste biomass as shown in Table 1 and Figure 2. The listed percentages are taken on retail sales. The set-asides for solar and swine equate to approximately 2% each of the RPS by 2018, whereas poultry waste accounts for 6% of the RPS in In addition to these set-asides, we used the North Carolina Biomass Roadmap [19] to make assumptions about the proportion of biomass that will be supplied by other agricultural (waste and energy crops) and municipal waste biomass. We assume that 50% of the available agriculture and municipal wastes are available for energy by the end of the forecast period (2036), starting from 0% in The remainder of the biomass is assumed to come from forest biomass, including both logging residuals and pulpwood harvested to meet bioenergy demands
9 The role of pulpwood in meeting the NC RPS will depend on how the North Carolina Utilities Commission defines renewable biomass. In March of 2008, the Commission established rules to implement the RPS [20]. The precise definition of renewable biomass, however, was left undecided. The Commission effectively put off the decision on which kinds of timber would qualify as biomass by allowing the decisions on qualified biomass to be made on a case-by-case basis. Potential definitions could include only residuals and waste, or could include any, all or none of the following: roundwood harvested through thinning, roundwood harvested from pine plantations, and roundwood harvested from all stands Although we assume the recession does not directly reduce renewable energy demands, it does affect future pulpwood supply. For example, the reduction in demand for housing and paper products lowers price and delays harvest and subsequent planting. This creates a smaller cohort of young trees and will affect the prices and harvest quantities for years after the recession. Also, because the beginning of the RPS demands in 2012 coincides with the recovery, price increases will be exacerbated by the sudden increase in overall timber demands Timber Supply The SRTS model was used to simulate the impact of renewable energy demand on forest product markets and land use change [9]. In addition to demand scenarios over time for each product, the SRTS simulation framework requires supply and demand price 9
10 elasticities. Empirical studies have shown that timber supply and demand are price inelastic [21]. For these projections we assumed a supply-price elasticity of 0.3 for all products and owners. We assumed demand-price elasticities of -0.5 for all products. Bioenergy demand was assumed to be insensitive to price in the short run, since wood is likely to be a small proportion of input costs for large utilities. Regulated utilities may also have the ability to pass higher costs on to consumers Moving from the wood requirements shown in Figure 2 to pulpwood market impacts requires assumptions about the availability of logging residuals to meet bioenergy demand. Estimates of logging residuals are calculated by applying FIA logging residual factors by species and residual size class to growing stock removals from the SRTS model. These factors are based on state-level field studies of typical logging jobs conducted by FIA [14]. For North Carolina, these studies suggest that residuals constitute approximately 21 % of total harvest for pine and 36 % for hardwood. For both species groups, approximately 60 % of logging residuals is non-growing stock, or less than 10.2 cm in diameter. Applying these factors to harvest provides a gross estimate of residuals from every harvest in the region Because logging residual utilization response to demand is unknown, we assumed increasing utilization over time, starting at 10% for pine and 8% for hardwoods in 2012, the first year of the portfolio. This initial rate is far lower than utilization rates used in previous studies [1, 2, 3, 4], which assume rates of 60 to 70% in the short run. We assume these higher utilization rates will be observed only after higher pulpwood prices 10
11 provide an incentive to improve efficiency. Our utilization rate peaks at 66% for pine and 50% for hardwoods in 2025, staying at that level through the end of the projection. This difference in utilization rates by species group reflects both different growing conditions (often wetter or steeper sites) and harvesting technologies for hardwoods. These percentages reflect averages over all harvested sites in each subregion. In reality, sites near energy producers may experience higher utilization rates, while more distant sites may continue using existing practices We calculate net available residuals from the base run by multiplying the utilization rate times the gross estimate of residuals. After netting base residuals from biomass demand, the split between hardwood and pine pulpwood markets was made by assuming that each species group would receive the same percentage increase in harvest. Because hardwood harvests generate a higher level of residuals, the net increase in hardwood pulpwood harvest was lower than the increase needed in pine Once available base residuals from existing harvest have been fully utilized (to the extent possible by current technologies and industries) by the bioenergy producers, the model allows pulpwood harvest from standing timber to meet bioenergy demand. Residuals from this additional energy harvest are assumed to have a utilization level of 14% in 2012 rising to 90% by This assumes that harvests conducted for the sole purpose of bioenergy demand will be located closer to energy plants, and thus utilization will be higher. The increased level of residual utilization will be driven by pulpwood price 11
12 increases, but these price increases will also lead to reduced residuals from conventional logging as traditional users harvest less The implementation of SRTS used here also includes endogenous land use change by linking to a an updated version of Hardie et al. [22]. This model includes county level timberland reductions due to urbanization and allows rural land to move between forest and agriculture uses based on relative rents. We allowed the model to react to pine pulpwood prices, but held agriculture rents constant. Because the land use model does not describe changes across forest types, in these scenarios we assume that land is converted into forestry through the addition of pine plantations when pulpwood prices rise, and that land is converted out of all forest types proportionately when pulpwood prices decline [9] Results Based on the market interactions between timber supply and demand, the SRTS model develops estimates of stumpage price change, growing stock removals, and inventory for 4 products (pine pulpwood, pine sawtimber, hardwood pulpwood, and hardwood sawtimber) for each of the 4 subregions included in the supply region. Market results are presented by setting the initial year of the projection, 2006, to an index value of 100. From this starting point the model moves through time based on demand scenarios and supply shifts from inventory changes due to harvest, growth, age class distributions and land use change. The selected demand scenarios were (1) base demands derived from 12
13 average removals from , a recession, and recovery to previous demand levels, and (2) the base demand scenario, including the recession, plus the RPS demands derived from the hypothetical portfolio, where woody biomass is assumed to supply approximately 55% of the biomass portion of the renewable portfolio in the long run and even higher percentages in the short run Base demand projections, shown in Figures 3a-3d, do not include any new demand from the RPS policy. In the base model run, post-recession demand by product is constant over time. Prices and harvest shift by product and region over time due to supply shifts induced by inventory changes. The four markets show decreases in removals and prices from the base year due to the recession, with prices returning to pre-recession levels in all but the pine sawtimber market. In the pine pulpwood market (Figure 3a), price, inventory and removals all decline during the recession, with prices returning to 2006 levels by Pine pulpwood inventory and removals remain below 2006 levels due to reduced supply Reduced planting from 5 to 15 years ago leads to fewer hectares in the pulpwood age classes early in the projection (Figure 4). Compared to the area in the year age class at the beginning of the projection, there is a greater than 20 % drop in area coming into that age class in the coming decade (Figure 4). While the 0-5 year age class has more area, the recession early in the projection lowers harvest and prices and keeps planting low for the first 5 years of the projection. This reduces area in the pulpwood age classes by 30% in With no demand change, the inward shift in supply due to 13
14 reduced pulpwood inventory leads to lower harvest and higher prices (Figure 3a). Planting increases when prices rise due to the recession recovery assumed to begin in This inventory moderates prices as it reaches merchantability after In the pine sawtimber market (Figure 3b), inventory accumulates due to the recession and prices remain low. Hardwood pulpwood market projections (Figure 3c) are similar to pine pulpwood in the first decade. Hardwood pulpwood price dynamics are affected by the large quantities of hardwood pulpwood that come from low-grade sawtimber size material which is not responsive to pulpwood price. This leads to higher pulpwood price increases as the model finds a market-clearing price based only on the small diameter resource. Unlike pine, higher prices do not lead to a planting response, so prices remain higher through the projection. Hardwood sawtimber, shown in Figure 3d, shows a recession and recovery response, although inventories continue to accumulate throughout the projection For the RPS policy runs (Figures 5a to 5d), the demands for sawtimber were held constant, and the demands for pulpwood were increased only by the amount of biomass demand not met by logging residuals from the base projection. Residuals alone do not fulfill the RPS demand even in the first year of the requirement, where additional harvest of nearly 4.5 million green metric tons would be needed to fulfill the forest biomass contribution to renewable energy demands shown in Figure
15 Figures 5a and 5c show that prices for pulpwood increase dramatically beginning in 2012, as both economic recovery and bioenergy demands increase removals. Because supply is price inelastic (0.3), price changes are much larger than removals changes. The harvest response is further reduced by the inventory decline noted in the base run. The inventory decline is exacerbated due to the increased biomass harvest levels. The significant price increases lead to a large planting response and a 20 % increase in plantation area over base run levels. These plantations become merchantable at age 15 and lead to reductions in pine pulpwood prices and increases in pine pulpwood inventory beginning in Hardwood pulpwood prices remain higher than the baseline since the increased removals lead to inventory declines with no management response The SRTS model does not include cross-price effects between pulpwood and sawtimber, and thus there is no direct substitution between these two product types in the projections. However, Figures 5b and 5d both show changes in sawtimber price, inventory and harvest even though base sawtimber demands remain unchanged. This is because increased demand for pulpwood, starting in 2012, reduces the amount of timber that is allowed to grow to sawtimber size (in 10+ years), ultimately leading to reduced sawtimber inventories and higher sawtimber prices even assuming constant demand (compared to the base runs of Figures 3b and 3d). Figures 5b and 5d show the long-term effects of reduced sawtimber inventories, with prices increasing for both sawtimber products by the end of the projection relative to the base run. Since sawtimber prices are usually 4 to 6 times higher than pulpwood prices, the pulpwood price impacts projected 15
16 here would not be expected to lead to the use of sawtimber for bioenergy. The change in relative prices, however, could lead to product allocation changes at the margin These price increases imply significant changes for forest landowners and traditional wood users over the projection period. The large increase in demand would increase wood prices, benefiting forest landowners who are suppliers in the timber market and leading to more intensive management, possibly including fertilization, competition control and/or thinning. On the other hand, these price increases will adversely affect the traditional forest industry. Since bioenergy demand is assumed to be completely insensitive to wood prices in the short run, while traditional industry demand is assumed to be price responsive (demand price elasticity = -0.5), price increases lead to harvest reduction by the traditional industry but not by the energy producers Figure 6 shows the source of all forest products that are projected to be used to meet the NC RPS. Sources include pine and hardwood residuals from the base run; pine and hardwood pulpwood harvest change (additional harvest due to bioenergy demands); pine and hardwood displacement (reduced harvest from traditional users now being used in bioenergy); and residuals from new bioenergy harvests. The highest point of woody biomass removals for electricity occurs in 2021, which is followed by a slight decline in removals as other sources continue to increase while RPS requirements level off. The decline to about 14 million green metric tons continues through the end of the projection. During this period of level consumption, base residuals constitute nearly half of the total consumption, while the largest part of the remainder comes from the displacement of 16
17 traditional industry harvests for both pine and hardwood pulpwood. The higher residual utilization on biomass harvests makes up the final portion. By the end of the projection, pine pulpwood harvest increases and displacement is reduced due to the surge in plantation area reaching merchantability Conclusions Some factors that may alleviate biomass demand impacts as projected here include (1) long-run price responsiveness of biomass demand; (2) silvicultural responses favoring production of biomass feedstock, possibly at the expense of solid-wood products; (3) accelerated development and deployment of new technologies and substitute feedstocks; (4) decline of traditional wood product demand in the base scenario; and, finally (5) conservative assumptions regarding logging residual utilization, energy efficiency and other productivity. Alternatively, we have not included potential demand for wood in this region driven by European Union renewable energy policy nor have we included potential increases in agricultural rents which would lead to lower planting rates. We have also assumed that policies will allow use of pulpwood as a renewable energy source Using wood to produce energy provides opportunities to reduce the nation s use of fossil fuels. Beyond reduced fossil carbon emissions, the benefits from this substitution could include increased forest landowner incomes, increased forest land area, and reduced fuel imports. However, the short-run use of woody biomass will be constrained by the price inelastic nature of timber supply, the age class structure of the inventory, and competition 17
18 with traditional wood-using industries. This case study focuses on the timing of first order impacts and the interaction between biological, market, and policy factors. The model matches the current regional resource outlook with a pragmatic view of wood s evolving role in the NC RPS Overall, this analysis suggests that the use of pulpwood for electric power generation is essential for attainment of RPS goals. While many studies have considered the quantities required from different sources, our focus is on timing, particularly in the early years of the policy. Significant short run impacts are driven by; 1) the lack of infrastructure for many alternative renewable feedstocks; 2) near-term wood supply constraints due to reduced planting in the last decade; and 3) a recession that will further dampen planting and future supply The dominant impacts of increased demand and constrained supply in a price-inelastic market are large price increases and relative small harvest changes. While this may ameliorate concerns of over-harvesting, higher prices may lead to a significant displacement of traditional wood consumers by bioenergy wood consumers. Forest landowners benefit from higher prices, thus providing an incentive for planting, keeping current land in forests and more intensive management, all of which will increase longterm supply. This intensive management response, along with an assumed trend of increased capacity of alternative renewables, returns prices, inventory, and harvest to historically observed levels by the end of the projection
19 While the policy and resource situation examined here is specific to North Carolina, the importance of policy timing, market characteristics, the structure of the current forest resource, and the long-term nature of supply response are important factors in any bioenergy policy assessment. Further research will be focused on the impact of the spatial distribution of demand (e.g., co-firing potential) relative to resource supply and the impact of alternative views of traditional forest product markets over time References [1] R.D. Perlack, L. L. Wright, A. F. Turhollow, R. L. Graham, B. J. Stokes, and D. C. Erbach, Biomass as feedstock for a bioenergy and bioproducts industry: the technical feasibility of a billion-ton annual supply. US Department of Energy, Oak Ridge Nat. Lab., Oak Ridge, TN. (2005), 78pp [2] Biomass Research and Development Board, Increasing feedstock production for biofuels: economic drivers, environmental implications, and the role of research, (2008). Retrieved March 23, 2009 from [4] J. Gan and C.T. Smith, Availability of logging residues and potential for electricity production and carbon displacement in the USA, Biomass and Bioenerg. 30 (2006), pp
20 [5] J. Gan and C. T. Smith, Co-benefits of utilizing logging residues for bioenergy [6] G. Perez-Verdin, D. L. Grebner, C. Sun, I. A. Munn, E. B. Schultz and T. G. Matney, Woody biomass availability for bioethanol conversion in Mississippi. Biomass and Bioenerg. 33 (2009), pp [7] C.S. Galik, R.C. Abt and Y. Wu, Forest Biomass Supply in the Southeastern United States -- Implications for Industrial Roundwood and Bioenergy Production. J. of For. 107(3) (2009), pp production: The case for East Texas, USA, Biomass and Bioenerg. 31 (2007), pp [8] North Carolina General Assembly, General Statute : Renewable Energy and Energy Efficiency Portfolio Standard (REPS), (2007). Retrieved January 15, 2009 from [9] R.C. Abt, F.W. Cubbage, and K.L. Abt, Projecting southern timber supply for multiple products by subregion, For. Prod. J. 59(7/8) (2009), pp [10] J.P. Prestemon and R.C. Abt, Timber Products Supply and Demand, in: D.N. Wear, J. Greis (Eds), Southern Forest Resource Assessment, US Forest Service South. Res. Sta. Gen. Tech. Rep. SRS-53, Asheville, NC, (2002),
21 [11] J. P. Prestemon, and R.C. Abt, The Southern Timber Market to J. of For. 100(7) (2002), pp [12] P.E. Sendak, R.C. Abt, and R.J. Turner, Timber supply projections for Northern New England and New York: integrating a market perspective, North. J. Appl. For. 20(4) (2003), pp [13] US Forest Service, Forest Inventory and Analysis, FIA database, (2009). Retrieved March 19, 2009 from [14] US Forest Service, Forest Inventory and Analysis, TPO database, (2009). Retrieved March19, 2009 from [15] Energy Information Administration, Energy and economic impacts of implementing both a 25-percent renewable portfolio standard and a 25-percent renewable fuel standard by US Department of Energy, Washington, DC, (2007), 86p [16] Energy Information Administration, North Carolina Renewable Electricity Profile. US Department of Energy, Washington DC (2006). Retrieved January 20, 2009 from
22 [17] La Capra Associates, Analysis of a renewable portfolio standard for the state of North Carolina, Boston, MA, (2006). Retrieved January 15, 2009 from [18] J. Rogers, Rachel Maddow Show. R. Maddow, Interviewer, (2009) [19] North Carolina Biomass Council, North Carolina biomass roadmap, (2007). Retrieved September 15, 2009 from [20] North Carolina Utilities Commission, Renewable Energy and Energy Efficiency Portfolio Standard (REPS) (2008). Retrieved March 3, 2009 from [21] Pattanayak, S.K., B. C. Murray and R. C. Abt. How joint is joint forest production? An econometric analysis of timber supply conditional on endogenous amenity values. Forest Science 48(3);(2002) [22] Hardie, I., P. Parks, P. Gottleib and D.N. Wear. Responsiveness of Rural and Urban Land Uses to Land Rent Determinants in the U.S. South. Land Economics November (4):
23 Acknowledgments: Funding for this research was provided by NC State University, the Southern Forest Resource Assessment Consortium (SOFAC), the USDA Forest Service, and Sun Grant(DOT)
24 1 Table 1. Required elements of North Carolina s Renewable Portfolio Standard. 2 1
25 Table 1. Required elements of North Carolina s Renewable Portfolio Standard. Renewable requirements by utility Renewable set asides type Year Public Municipal and Solar Swine Poultry Membership Waste Waste As a percentage of the As a percentage of the MW h previous year s retail sales given year s retail sales , , , and ,000 thereafter
26 Figure 1. Subregions in North Carolina, Virginia and South Carolina assumed to contribute to biomass demands from NC RPS. 7 2

27
28 8 9 Figure 2. Hypothetical North Carolina Renewable Portfolio Standard allocation. 10 3
29 Figure 3. Projected removals, inventory and price changes without RPS biomass demand (2005 =100) by a) pine pulpwood, b) pine sawtimber, c) hardwood pulpwood, and d) hardwood sawtimber. 15 4
30 Price Inventory Removals 2006=
31 Price Inventory Removals 2006=
32 Price Inventory Removals 2006=
33 Price Inventory Removals 2006=
34 16 17 Figure 4. Starting age class distribution of pine plantations in the study area. 18 5
35 Hectares (thous) Age Class
36 Figure 5. Projected removals, inventory and price changes with RPS biomass demand (2005 =100) by a) pine pulpwood, b) pine sawtimber, c) hardwood pulpwood, and d) hardwood sawtimber. 23 6
37 Price Inventory Removals 2006=
38 Price Inventory Removals 2006=
39 Price Inventory Removals 2006=
40 Price Inventory Removals 2006=
41 24 25 Figure 6. Projected biomass sources to meet NC RPS demands from 2006 to
42 Million Metric Green Tons Pine base residuals Hardwood base residuals Pine pulpwood harvest change Pine pulpwood displacement Bioenergy harvest residuals Hardwood pulpwood harvest change Hardwood pulpwood displacement Biomass consumption