New problems in energy optimization: the Consultant-working-in-power-markets perspective
|
|
|
- Andrew Montgomery
- 5 years ago
- Views:
Transcription
1 New problems in energy optimization: the Consultant-working-in-power-markets perspective January 27 th 2016, International Institute for Mathematical Sciences, Edinburgh, UK.
2 Contents Experiences - two example projects Provision of a GB electricity dispatch model for the Scottish Government Feasibility of the MYTO load allocations for Discos in Nigeria: Application of load flow modelling capability New problems What new tools would be beneficial? 2
3 Provision of a GB electricity dispatch model for the Scottish Government ( ) 3
4 Important questions (at the time!) Meeting legal requirements under the Climate Change Scotland Act Specific area-wide emissions target set as constraints Understanding the impacts of consenting of power plants Limiting entry, altering construction delays or setting planned entry Understanding the challenges of meeting 100% renewables ambition Specific area-wide renewables target (% of demand) Production analysis Impact of EMR, in particular EPS and CfDs EPS: limits on production for emissions intensive plant CfDs intended to reduce risk of investment 4 4
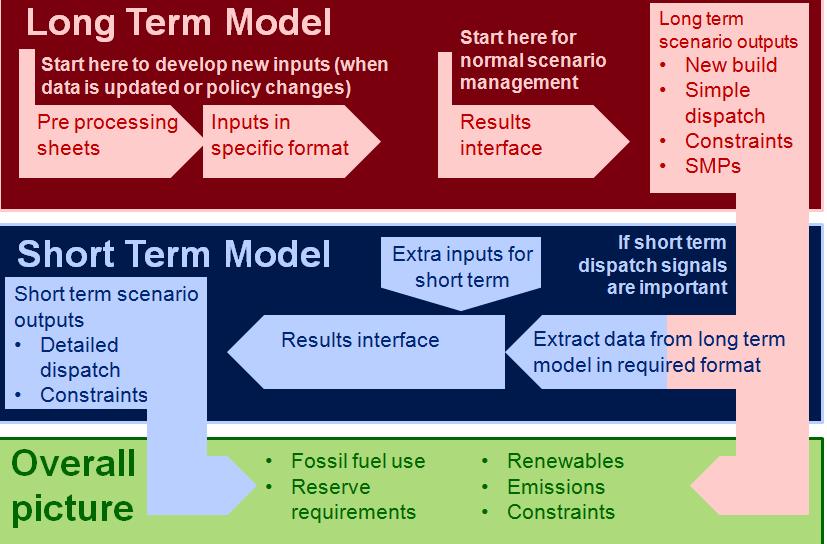
5 Two models Long term investment model Long term planning, Period: E.g., years, Stages: E.g., Seasons, Blocks: E.g., Load-duration Includes investment and production costing Short-term operational model Short term operation, unit commitment (generator scheduling) Half-hourly chronological dispatch for representative weeks Production costing much more detail Both are mathematical optimization models Objective to minimize cost, implements principles of a perfectly competitive markets Subject to various constraints 5 5
6 Why two models? Key to successful market modelling is to simplify the problem enough to solve in a reasonable time, while getting robust and meaningful results For this reason we used two versions of the model: The long term model simplifies the dispatch (treats demand as blocks of energy) to be able to optimise the generation and transmission expansion over planning timescales (i.e., at least one investment cycle or with some target date in mind 2050?) The short term model does not consider new build (short timescales). Instead it allows more processing power to be devoted to the dispatch, including reserves, detailed thermal efficiencies etc can check the feasibility of long term model results 6 6
7 Long-term modelling Represents the supply-demand balance in the long-run Input data on demand (yearly) and on the costs of generation Input data on the transmission system and constraints But that is not all it can represent Retirements New build (optimal generation and transmission expansion) Security of supply (capacity margin, always meeting demand) Reserves (always meeting demand) Policy/externalities (renewables, carbon dioxide) Etc. 7 7
8 How long term and short term model differ (summary) 8 Not chronological Long term model Demand simplified to load duration blocks Representation of renewables and emissions policy through targets or prices Optimised network expansion Both Chronological Optimised production costing (much more detailed in short term) Short term model Demand can vary by half hour, full chronological information Representation of renewables and emissions policy through prices only Generation capacity for a specific year is an input Representation of transmission network possible (constrained or unconstrained) 14 nodes (or regions) 8

9 Network Modelled network simplifies the problem Accurate representation of constraints at key boundaries of importance to Scottish Government No power electronics, just flow balance Transfer limits consistent with NG planning standards / seven/ten year statements 9 9
10 Reflecting policy targets Target Implicit Explicit Security of supply (capacity) Value of Lost Load cost associated with failure to supply Derated capacity margin (as Ofgem and DECC) Renewables Carbon Subsidy payments acts as a decrease in variable (or fixed) cost for green generator Carbon price (EU ETS) acts as an increase in variable cost for emitting generator Renewables target as a % of model demand Carbon limit MT CO
11 11 11
12 Model framework is flexible The underlying model is entirely transferable to any market In practical terms, that means anything that can vary between power markets is an input and can be changed (If you can name it, it can almost certainly be adjusted) 12 12
13 Model flexibility was needed Available modelling modes: Single bus Unconstrained network line/transfer limits relaxed Generators are charged /kw/year to be connected at each node (consistent with TNUoS) The transmission system does not cost the model anything so model is minimising generation and demand costs only (i.e., expanding generation only) Constrained network - line/transfer limits in place Line can be upgraded (candidates) Generators are not charged to connect, BUT... The transmission system adds an additional cost so the model is minimising generation, demand and transmission costs By doing this the model will hedge between upgrading lines and building generation close to demand 13 13

14 Communicating with the model Mathematical model requires a set of csv files defining the problem The model runs and produces a set of csv files Users need to deal with a lot of files Benefit is this can provide an intimate understanding of the model 14 14


15 Results interface was needed Needed to create a user-friendly way to set model inputs and view model outputs The output spreadsheets have been created to display results which will be looked at most frequently Free to develop own outputs viewers

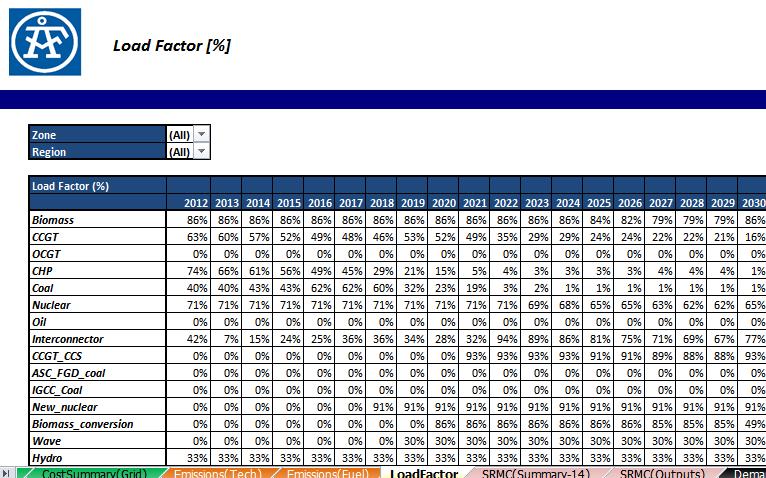
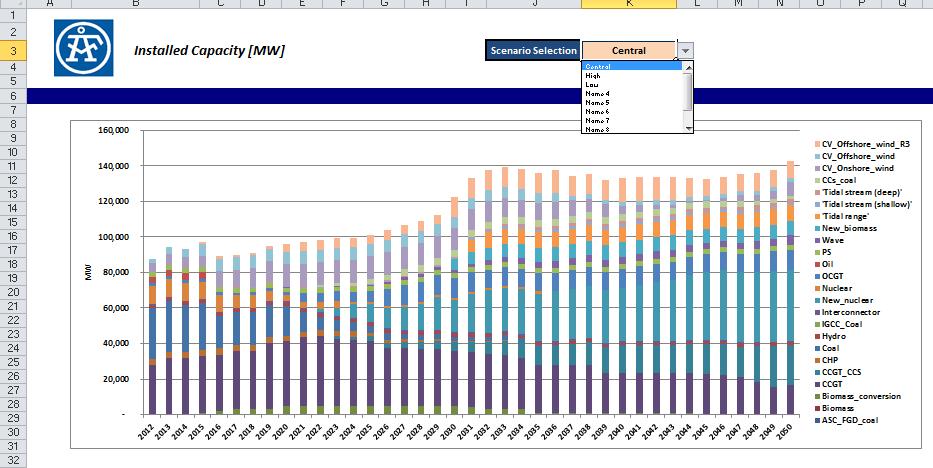
16 Outputs viewer 16 16
17 Outputs viewer 17 17

18 Comparing outputs 18 18

19 Constraints viewer Constraints can be viewed in the traffic light sheet Red may be of interest, indicates where the shadow cost of a constraint is other than 0 19
20 Lesson learned A complex model is not always what is needed being able to turn features on/off is handy Making sense of results can it all be explained in a single graph?! Can certainly do more to make interaction with the model more straight-forward Our models are flexible so the tools need to be transferable also 20
21 Feasibility of the MYTO load allocations for Discos in Nigeria: Application of load flow modelling capability ( ) 21
22 The questions Are the load allocations used by the Nigerian Electricity Regulator feasible? Or will system balancing compensation continue to be required? 22 Disco Load allocation (%) Benchmark (MW) Abuja 11.5% Benin 9.0% Eko 11.0% Enugu 9.0% Ibadan 13.0% Ikeja 15.0% Jos 5.5% Kaduna 8.0% Kano 8.0% PH 6.5% Yola 3.5% Total 100% 4500
23 Amounts in question are not insignificant TCN is obliged to pay Imbalance penalties to those discos who did not receive their MYTO load share (and had not refused load) Discos are collectively owed 1bn/month for Balancing Compensation TCN is consequently incurring a liability to Discos of ~ 1bn/month without being given any additional income in MYTO to pay this but the Discos need this money for financial survival revenue recovery is dependent on load allocation being achieved We believe the grid cannot deliver the MYTO load shares 2015 August September October 23 Energy received (actual - kwh) Energy received (if load share met - kwh) Weighted average BCM tariff of short Discos in month (N/kWh) Compensation due from TCN ( Bn) 685,596,974 1,036,072, ,486, ,348,532 1,132,700,299 1,070,219,
24 How to answer it Application of our Transmission Modelling and Evacuation Studies Model I Our Transplan model: PSS/E power flow Model II Optimal Load shedding (Collaboration with the University of Edinburgh, UK) 24
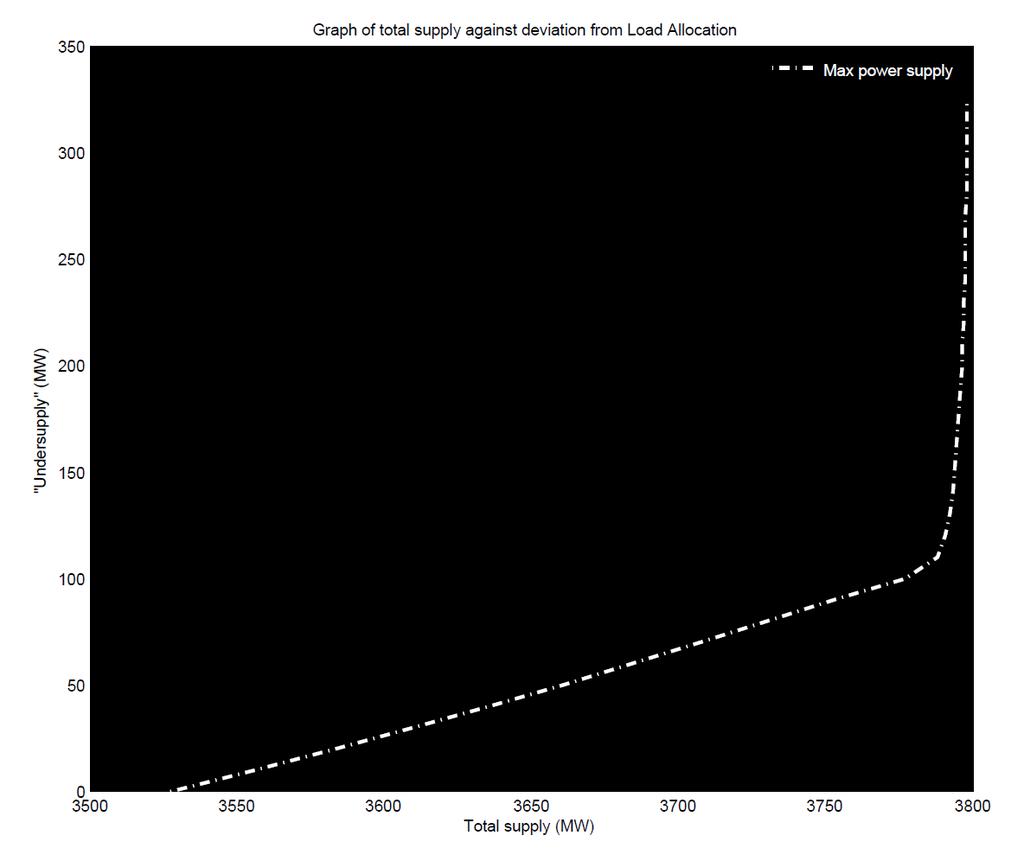
25 Exports Abuja Benin Eko Enugu Ibadan Ikeja Jos Kaduna Kano PH Yola Results of load share analysis The grid in its current form it is not viable for TCN to deliver the MYTO load shares instantaneously without massive load shedding Our modelling suggests that the deviation from the MYTO shares becomes larger as total generation increases MW Avail. Gen. Total Gen. Dispatched Load Supplied Max power delivery Low Central High Respecting MYTO load share Low Central High
26 26
27 27
28 28
29 29 Exploring possible solutions In the medium term investment in the network could improve the position For example use modelling to explore deployment of reactive support 3561 MW delivered in total without violating load allocation Size of red blob corresponds to magnitude of q support added Capacitors required at 11 strategic locations 190 Mvar reactive support in total Note that the modelling assumes the network is operated strictly within the rating of the equipment and it may be that TCN is able to flex these limits (e.g., overloading of transformers etc) in order to deal with the operational challenges faced
30 Abuja Benin Eko Enugu Ibadan Ikeja Jos Kaduna Kano PH Yola Reactive support comparison The table below shows the results for each Disco of respecting MYTO load shares with and without reactive support (RS). Without reactive support, total load delivered falls to 2654MW from the Max power delivery case of 3565MW. With reactive support we are able to supply 3561MW while still respecting the MYTO load shares. Total generation available (MW) Total generation delivered to Discos (MW) Max power delivery No RS Respecting MYTO load shares No RS With RS
31 What new tools would be beneficial? 31
32 Ideas (1/2) Interested in models of power markets and/or the wider energy system that run reasonably quickly and provide robust enough answers Models of this type that can be run in combination with visualisation tools for easy understanding of the implications (i.e., showing key output metrics) is also desirable Or taking a complex model and allowing for simplifications to be easily applied to reduce problem size (e.g., ranking variables that are increasing the problem size and/or active constraints) without too much loss of accuracy etc Then we can answer the question: what extra accuracy does the full functionality provide? Or alternatively: how much is lost by using a more basic application of the model? 32
33 Ideas (2/2) There is a need for flexible and stable results interface Interface may need to be run by experiences modellers, for in-house training and end-user clients Graphical tools to get it all on one graph 33

34 34