UT Zero-Energy House Screen House University of Tennessee, Knoxville Arc 572 I Spring 2008
|
|
|
- Dortha Flowers
- 5 years ago
- Views:
Transcription

1 comfort zone market viability ARCHITECTURE: The parti of the project is a living space between two screens. The screens define both indoor and outdoor spaces and allow for necessary privacy from and connection to the exterior. Within the screens, space is layered into three zones: a sunspace on the southeast, the living area, and a service zone to the north.


2 comfort zone market viability The house is oriented to the southeast on the site in Sequoyah. The linearity of the narrow house allows for compact arrangement on the site, where both the living space and the yard between two adjacent houses are defined by the screens. The circulation on the site to each home begins at the sidewalk along the street and ends at a dock on the river. Site Plan Floor Plan
3 comfort zone market viability The cross-sectional perspective shows the zoning between the two screens, from left to right: the service zone, the living space, and the sunspace. The two screens serve different purposes. The southeast façade is a curtain wall of PV glass to provide energy for the home and to allow the sun to heat the sunspace. The northwest façade is a curtain wall system of sandwich modules to provide privacy. The two facades give a clear distinction between front and back. Cross-sectional perspective towards garden Longitudinal Section showing south facade Floor Plan Longitudinal Section showing north facade
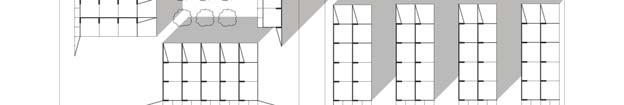
4 comfort zone market viability Northwest Elevation Southeast Elevation
5 comfort zone market viability

6 comfort zone market viability Site Plan Primary Structure Modular parts for facades STRUCTURE: The house is designed as a kit of parts. The light frame structure is 5x7 cm steel tubing. Attached to the primary structure are the screens consisting of aluminum sandwich, aluminum screen, PV glass, and operable window modules. The modules are.5x2.5 meters. The structure spans between the screens to support the living area. Secondary Structure
7 comfort zone market viability
8 comfort zone market viability
9 Site Plan UT Zero-Energy House comfort zone market viability September/March 3:00 P.M. Shading September/March 10:00 A.M. Shading
10 Site Plan UT Zero-Energy House comfort zone market viability Ceiling Plan
11 comfort zone market viability PASSIVE / ACTIVE SYSTEMS: The southeastern PV glass façade provides the energy to power the home. Sliding glass doors in the façade as well as windows above the living area ventilate the sunspace to avoid excess heat gain in warmer months. The gypsum panels in the living space and service zone incorporate phase change to provide further control of heat. Solar evacuated tubes on the roof provide solar heated water for the home. Radiant heat flooring also helps heat the space in the colder months. Cooling Heating PV Glass


12 comfort zone market viability Kawneer 1600 Powerwall


13 comfort zone market viability Navitron Solar Evacuated Tubes

14 comfort zone market viability Warmboard Radiant Heat Flooring
15 comfort zone market viability Mechanical Room, Plumbing Distribution, and Radiant Heat Flooring

16 comfort zone market viability Summer/ Winter Typical Day Net Heat Flow/ Element Group Graphs The typical summer day has an estimated cooling load of Btu and a cooling peak of 25,801 Btu/hr. The heating load is higher than desired and can be attributed to the amount of glass in the home and the Knoxville climate. A simple air-conditioning window unit, however, is enough to cool the home in the summer. The typical winter day has an estimated heating load of -18,759 Btu and a heating peak of Btu/hr. These values were calculated without consideration of the sunspace and radiant floor heating; both should help to reduce the heating load.
17 comfort zone market viability Summer/ Winter Extreme Day Net Heat Flow Graph The extreme summer day has an estimated cooling load of 243,817 Btu and a cooling peak of 27,088 Btu/hr. The heating load is much higher than the load on a typical day, emphasizing further the need for an air-conditioning system. The extreme winter day has an estimated heating load of -165,404 Btu and a heating peak of -14,212 Btu/hr. These values were also calculated without consideration of the sunspace and radiant floor heating; both should help to reduce the heating load.

18 comfort zone market viability Cistern Sizing Tool Graph The graph indicates that rainwater storage can be effective with my design scheme. The results were obtained assuming a precipitation probability of.4, a daily water need of 50 g/cd, and a recycling conservation type. The cistern capacity is 3,000 gal, and the catchment area is 1,100 sf. The graph shows that the cistern has a consistent storage of water to meet the occupants demand. While the water does cycle up and down, the water is always above this demand level.
19 comfort zone market viability Station Identification City: Knoxville State: TN Latitude: N Longitude: W Elevation: 299 m PV System Specifications DC Rating: 4.00 kw DC to AC Derate Factor: AC Rating: 3.08 kw Array Type: Fixed Tilt Array Tilt: 90.0 Array Azimuth: Energy Specifications Cost of Electricity: 6.9 /kwh Month Solar AC Energy Radiation Energy Value (kwh/m2/day) (kwh) ($) PV Watts AC Energy and Cost Savings This graph gives an estimation of the energy outputted by an average PV panel oriented to the southeast and on a vertical plane. It is not assuming PV glass, therefore it is only an indication of average solar performance in the area.
20 comfort zone market viability Suburban Site


21 comfort zone market viability Grouping/ Urban Site