STORM WATER REPORT ASPHALT AND CONCRETE PLANTS 891 JINKINSON SIDE ROAD, ASHTON CITY OF OTTAWA, ONTARIO PREPARED FOR:
|
|
|
- Anabel Stokes
- 5 years ago
- Views:
Transcription
1 Civil Geotechnical Structural Environmental 210 Prescott Street, Unit 1 (613) P.O. Box 189 Kemptville, Ontario K0G 1J0 FAX: (613) STORM WATER REPORT ASPHALT AND CONCRETE PLANTS 891 JINKINSON SIDE ROAD, ASHTON CITY OF OTTAWA, ONTARIO PREPARED FOR: R.W. Tomlinson Ltd. 891 Jinkinson Road Ashton, Ontario K0A 1B0 PROJECT # DISTRIBUTION: 6 copies R.W. Tomlinson Ltd. 1 copy Kollaard Associates Inc. Revision 0 Issued for Client Review 2012 May 14 Revision 1 - Issued for Distribution to Consultants 2012 Aug 07 Revision 2- Issued for Site Plan Control 2012 Nov 19 Revision 3 Revised for City Comments 2013 April 2 Professional Engineers Authorized by the Association of Professional Engineers of Ontario to offer professional engineering services.
2 2013 April 2 Storm Water Report Concrete and Asphalt Plants 891 Jinkinson Road, Ottawa Report STM1 Table of Contents 1 Introduction Pre-development Site Conditions Site Use Storm Water Analysis Purpose Method - Rational Method Results of Rational Method Analysis Pre-Development Baseline Conditions Post-Development Conditions Storage Stormwater Storage Additional potential inlet flows Water Quality Control Wet pond Design for Stormwater Treatment Grey Water from Truck Wash Station Sand Filter Filter Design Calculations Filter Maintenance Related Drawings Drawing # SS Site Servicing Plan # DP - Drainage Control Plan Attachments Figure 1 Key Plan Figure 2 Sub-catchment Areas Appendix A Rational Method Analysis of Pre-development Conditions Appendix B Rational Method Analysis of Post-development Conditions Appendix C Storage Volume Requirements Appendix D Wet Pond Design for Water Quality Control Appendix E Elevation vs Storage Volume in Pond Appendix F Sand Filter Design Appendix G Golder Associates Ltd. Memorandum Project No Civil Geotechnical Structural Environmental 2
3 2013 April 2 Storm Water Report Concrete and Asphalt Plants 891 Jinkinson Road, Ottawa Report STM1 1 INTRODUCTION Kollaard Associates Inc. (Kollaard) was retained by R.W. Tomlinson Ltd. (Tomlinson) to provide a storm water management system design for the R.W. Tomlinson Ltd. concrete plant, asphalt plant, and associated service buildings at 891 Jinkinson Side Road, Ashton, Ottawa, Ontario. The site under consideration in the present study consists of the approximately 9.96 hectares ha area indicated in Figure 1, on Lot 15 Concession 11, Geographic Township of Goulbourn, City of Ottawa. The site encompasses areas of the property that are devoted to the production of concrete and asphalt including: buildings and industrial structures; aggregate storage bins; truck wash station; areas used for stockpiling material; roadway and parking areas; landscaped areas and areas used to service the site. It is to be noted that the existing quarry operation, to the west of the site, has an existing approved stormwater management system and is outside the scope of the present study. For the purposes of this study, pre-development conditions are considered to be the conditions that would have existed had the asphalt plant and concrete plant not been constructed. Post development conditions are considered to be conditions arising from the construction of the asphalt and concrete plants. Under pre-development conditions, the site surface consisted in general of a thin soil cover over bedrock with areas of sparse vegetation, coniferous forest and exposed bedrock. It is considered that stormwater runoff from the site generally consisted of uncontrolled sheet flow toward the wetlands to the south and toward areas of standing water to the southeast of the site. The majority of the site is located on land currently zoned ME. A smaller portion, at the southern end, is zoned RU. A wetland area zoned EP3 exists to the south of the site. It is understood that a 120-metre setback line from this wetland limits the southern extent of the site development. In the design of the storm water management system for the site, it has been considered that: The post development runoff rate from the site is to equal the predevelopment runoff rate from the site assuming runoff coefficients based on pre-development conditions; Civil Geotechnical Structural Environmental 3
4 2013 April 2 Storm Water Report Concrete and Asphalt Plants 891 Jinkinson Road, Ottawa Report STM1 An enhanced level of treatment is required for the site. No additional mitigation for temperature is required; and The receiving body of water for the runoff from the site is the creek to the southeast of the site. In general the proposed stormwater management design consists of directing the flow by means of sheet runoff, swales and ditches to a wet pond at the southern end of the site. The wet pond is to provide an enhanced level of treatment, as defined by the Ontario Ministry of Environment Stormwater Management, Planning & Design Manual, 2003 (MOE Manual). The outlet of the pond is to be equipped with weirs to limit the discharge rate to that of pre-development conditions. The pond outlet is to discharge to a ditch to be constructed outside of the setback limit to the protected wetland. The outlet ditch is to discharge to an existing creek, flowing generally eastward from the southern end of the site. Existing topography precludes directing all of the runoff into the proposed wet pond. The area between the asphalt plant and Jinkinson Road is to be directed to a grassed swale leading to a sand filter designed to provide a normal level of treatment (as defined by the MOE Manual) before ultimately discharging into the ditch along Jinkinson Road. 2 PRE-DEVELOPMENT SITE CONDITIONS The site is located on the southeast side of Jinkinson Road about 1.8 kilometres southwest of Hazeldean Road, Ottawa, Ontario as shown on the attached Figure 1. The site has an area of about 9.96 hectares. The northern portion of the site is currently zoned for mineral extraction (ME) and the southern portion is zoned rural (RU). For the purposes of this stormwater management design, pre-development conditions are considered to be the conditions that would have existed had the asphalt plant and concrete plant not been constructed. The site is located in an area of high bedrock and in proximity to wetlands. This suggests that infiltration is naturally poor. Accordingly, the predevelopment runoff coefficient was considered to be C = 0.5 for the 5-year storm events. The coefficients were increased by 25% for modelling runoff from 100-year storm events. Civil Geotechnical Structural Environmental 4
5 2013 April 2 Storm Water Report Concrete and Asphalt Plants 891 Jinkinson Road, Ottawa Report STM1 It is considered that under predevelopment conditions, stormwater runoff would generally consist of uncontrolled sheet flow to the wetland to the south and the creek/area of standing water to the southeast of the site. The distance of travel for stormwater runoff from the most remote point to the outlet was approximated as 420 m. The pre-development time of concentration was determined to be 50 minutes. The site is bounded on the northwest by Jinkinson Road, to the west by existing quarry operations and to the north, east and south by undeveloped land. Existing drainage from the undeveloped land is to a wetland southeast of the proposed site. Existing drainage from the site is by means of swales and sheet flow towards the undeveloped land and towards the quarry. Existing drainage from the quarry is towards the wetland southwest of the site. Existing drainage patterns of the properties surrounding the site are such that there is no offsite runoff directed onto the site. 3 SITE USE Facilities used in the production of asphalt are located at the northern end of the site. The asphalt works include an asphalt plant, areas for stockpiling aggregate materials, weigh scales, a service building and parking and roadway areas. Facilities used in the production of concrete are located at the southern portion of the site. The works consist of a 1130 square metre service building, the concrete plant, aggregate storage bins, truck wash station, and parking and roadway areas. The site is occupied by R.W. Tomlinson Ltd. The parking and roadway areas are used by construction vehicles and concrete trucks. The service building is currently serviced by a sewage holding tank, and by drilled cased wells. The holding tank is to be replaced by a Class 4 onsite septic system and a Class 2 grey water septic system. Stormwater runoff from 8.12 ha of the site is to be directed to ditches leading to a wet pond. Runoff from 1.52 hectares is to be directed towards a vegetative filter strip / sand filter along a berm at the northern boundary of the site, adjacent to Jinkinson Road. Runoff from the 0.33 hectare area around the washbay is to be collected in a grey water tank under the pump house (see section below). Civil Geotechnical Structural Environmental 5
6 2013 April 2 Storm Water Report Concrete and Asphalt Plants 891 Jinkinson Road, Ottawa Report STM1 4 STORM WATER ANALYSIS Purpose The proposed stormwater management system is designed to limit the post-development runoff from the site to that of pre-development conditions for the 5-year and 100-year design storm events. 4.2 Method - Rational Method Pre-development and post development runoff rates were determined based on the Rational method. The rational method is a widely used stormwater runoff model in which runoff is estimated as a fraction of the total rainfall over an area: Q CiA = 360 where Q is the Peak runoff measured in m 3 /s C is the Runoff Coefficient, Dimensionless A is the runoff area in hectares i is the storm intensity measured in mm/hr The Runoff Coefficient, C, represents the estimated proportion of rainfall that will be converted to surface runoff. For example a value of C=1 represents a condition in which all rainwater would leave the area under study as surface runoff. None of the water would infiltrate or evaporate during a rainfall event. A value of C=0.5 is used when it is estimated that only half of the water leaves the area as surface runoff. The other half would infiltrate or evaporate on site. The Time of Concentration, tc is an estimate of the time elapsed before rain falling on the entire area under consideration contributes to runoff. Time of concentration was approximated using the airport formula developed by the U.S. Department of Transportation s Federal Aviation Administration (FAA): t c = 3.26 (1.1 C) (l c ) 0.5 /(S) 0.33 where lc = length of catchement, S = slope of catchment Civil Geotechnical Structural Environmental 6
7 2013 April 2 Storm Water Report Concrete and Asphalt Plants 891 Jinkinson Road, Ottawa Report STM1 The Storm Intensity, i, is rainfall per unit time. Historical rainfall data for various locations are available in the form of Intensity Duration Frequency (IDF) Curves. For a storm of a given return period (i.e. frequency) and a given duration, the intensity can be read from the IDF curve for the location under consideration. The IDF curves used for this project were those provided by the City of Ottawa for data collected at the Ottawa International airport. Two return periods (i.e. frequencies) were considered: the 5 year and 100 year storm events. For each of these frequencies, storms of various duration, ranging from 10 minutes to 120 minutes, were considered. For storms of duration, D, equations representing the IDF curves for 5-year and 100 year storm events yield: 5-Year Event i = D ( ) Year Event i = D ( ) where i = intensity in mm/hr and D = duration n minutes. 4.3 Results of Rational Method Analysis Results of the rational method analysis are summarized in the Tables 4.1 and 4.2 and in Figures 4.1 and 4.2. Calculations are presented in Appendices A and B. Civil Geotechnical Structural Environmental 7
8 2013 April 2 Storm Water Report Concrete and Asphalt Plants 891 Jinkinson Road, Ottawa Report STM1 Summary Table 4.1: Predevelopment runoff rates Storm Frequency C t c i Peak runoff rate minutes mm/hr m 3 /s 5-year year Summary Table 4.2: Post development runoff rates 5-year 100-year Catch- C Area Time of i * Q* i * Q* ment ha Concentration, t c, minutes mm/hr m 3 /s mm/hr m 3 /s Overland Ditch Total C C C C C C C C C *Note i and Q presented are for storm duration equal to time of concentration of catchment under consideration. Runoff from the various catchment areas would arrive at the storm pond at different times (see 4.3.2). The total rate of runoff arriving at the pond from all catchments has been plotted versus time, for storms of various durations, in Figures 4.1 and 4.2. For 5-year storm events, the maximum inflow rate to the pond was found to be 1.23 m 3 /s, corresponding to storm duration of 15 minutes and an elapsed time of 20 minutes. For 100-year storm events, the maximum inflow rate to the pond was found to be 2.62 m 3 /s, corresponding to storm duration of 15 minutes and an elapsed time of 20 minutes. Civil Geotechnical Structural Environmental 8
9 2013 April 2 Storm Water Report Concrete and Asphalt Plants 891 Jinkinson Road, Ottawa Report STM1 Figure 4.1: Runoff influent to pond for 5 yr storms Figure 4.2: Runoff influent to pond for 100 yr storms Civil Geotechnical Structural Environmental 9
10 2013 April 2 Storm Water Report Concrete and Asphalt Plants 891 Jinkinson Road, Ottawa Report STM Pre-Development Baseline Conditions Parameters of the Rational Method analysis of pre-development conditions are presented in Tables A-1, A-2 and A-3. In Table A-1, time of concentration was determined based on length of catchment, slope of catchment and runoff coefficient. The time of concentration was then input into Table A-2 to determine runoff rate versus elapsed time for 5-year storm events of various duration and intensity. Likewise, runoff rate versus elapsed time for 100-year storm events, under pre-development conditions, are presented in Table A-3. Time of concentration, t c It is considered that under predevelopment conditions, stormwater runoff would generally consist of uncontrolled sheet flow to the wetland to the south and the creek and area of standing water to the southeast of the site. The distance of travel for stormwater runoff from the most remote point to the outlet was approximated as 420 m. The pre-development time of concentration was determined to be 50 minutes. Intensity, i Values of rainfall intensity corresponding to incremental values of rainfall duration are presented in Appendix A. Intensity was calculated by substituting the corresponding value of duration into the IDF curve equations for 5-year and 100-year storm frequencies. For a storm duration equal to the pre-development time of concentration, substituting, tc= 50 minutes into the IDF equations yields: i = 38 mm/hr for a 5-year storm event; and i =64 mm/hr for a 100 year storm. Runoff coefficients, C: The site is located in an area of high bedrock and in proximity to wetlands and areas of standing water. This suggests that infiltration is naturally poor. Accordingly, the predevelopment runoff coefficient was considered to be C = 0.5 for the 5-year and C=0.625 for 100-year storm events. Runoff rates, Q: Estimated pre-development runoff from the site was calculated as follows: Civil Geotechnical Structural Environmental 10
11 2013 April 2 Storm Water Report Concrete and Asphalt Plants 891 Jinkinson Road, Ottawa Report STM1 Q CiA = 360 For the 5-year Storm event = (0.5 x 38 x 9.96)/360 = 0.52 m 3 /s Q 5year, 50 min = 520 Litres per second For the 100-year Storm event = (0.5 x 1.25x 64 x 9.96)/360 = 1.10 m 3 /s Q 100year, 15 min = 1100 Litres per second These values of pre-development runoff are indicated as Calculated Outflow Restriction in Appendix A and represent the allowable runoff from the site under post-development conditions used in the design of the proposed stormwater management system Post-Development Conditions The development consists of an asphalt plant, a concrete plant, service buildings, wash station, areas of aggregate stockpiles, aggregate bins, associated parking, driveway and landscaped areas. For the purposes of the rational method storm water analysis, the site has been divided into subcatchment areas, indicated in Figure 2. Note that runoff from the area labelled C1 is to be directed to the vegetated swale and sand filter; runoff from area C10 is to be collected in a grey water tank; and the remaining areas are to be directed via ditches to a wet pond at the southern end of the site. The vegetative swale/ sand filter has been designed based on water quality requirements only. Attenuation of stormwater runoff rates is to be achieved by the wet pond. The outlet of the wet pond is to be equipped with weirs to limit the discharge rate to that of pre-development conditions for the 5-year and 100 year design storm events. Parameters used in the Rational Method storm water analysis of post-development conditions are included in Appendix B and described below. Civil Geotechnical Structural Environmental 11
12 2013 April 2 Storm Water Report Concrete and Asphalt Plants 891 Jinkinson Road, Ottawa Report STM1 In Table B-1 of Appendix B, the following parameters are presented for each sub-catchment area: Average runoff coefficient, C (weighted average based on areas of various degrees of imperviousness); Slope of catchment Length of ditch (travel distance in ditch) Length of catchment, Lc (travel distance of overland flow) Tc, time of concentration for overland flow Time of travel in ditch The time of concentration and time of travel in ditch were then input into Table B-2 to determine runoff rate versus elapsed time for 5-year storm events of various duration and intensity. Likewise, runoff rate versus elapsed time for 100-year storm events, under post-development conditions, are presented in Table B-3. These runoff rates represent respectively the 5-year and 100 year inflow hydrographs of the wet pond. As discussed in Section 6.1 of this report, a 2-year storm of 30 minute duration was selected to model the water quality storm, the storm used as the basis of the water quality parameters for the purposes of proportioning the stormwater pond. Runoff rates versus time for the water quality storm are presented in Table B-4. Time of Concentration, t c The post-development times of concentration for the overland flow component of each subcatchment were determined using the airport formula. For example, for subcatchment C1: Runoff coefficient, C = 0.78 Slope of catchment, S = 0.5 Length of catchment, l c = 270 m Time of concentration was therefore calculated as: t c = 3.26 (1.1 C) (l c ) 0.5 / (S) 0.33 = 20 minutes Civil Geotechnical Structural Environmental 12
13 2013 April 2 Storm Water Report Concrete and Asphalt Plants 891 Jinkinson Road, Ottawa Report STM1 Intensity, i Values of rainfall intensity corresponding to incremental values of rainfall duration are presented in Tables B-2 and B-3 for 5-year and 100-year storm events respectively. For storms of various durations, intensity was calculated by substituting the corresponding value of duration into the IDF curve equations for 5-year and 100-year storm frequencies. For example (note that this is a sample calculation), for a storm duration of 30 minutes, substituting D= 30 minutes into the IDF equation for a 5-year storm yields: i = 54 mm/hr for a 5-year storm event of 30 minute duration Similarly, storm intensity was calculated for storms of 10, 15, 20, 25, 40, 60, 80 and 120 minute duration for 5-year and 100-year frequencies. Runoff Coefficients, C for Controlled and Uncontrolled Areas Average runoff coefficients for post-development conditions, presented in Table B-1, were calculated for each sub-catchment area as a weighted average of areas of different levels of imperviousness. Impervious Ratio The impervious ratio, the total impervious area divided by the total area, represents approximately 26 percent of the site. Post Development Runoff Rates, Q The inflow hydrographs (stormwater runoff rates entering the pond versus time) for storms of various durations are presented for the design 5-year and 100-year storm events in Tables B2 and B3 respectively. Runoff rates for each sub-catchment were calculated by the Rational Method, using appropriate values of C and A from Table B1 and from values of intensity corresponding to duration. Since the length of ditch is different between each sub-catchment and the wet pond, runoff contributed by each sub-catchment would arrive at the pond inlet at different times. Tables B2 and B3 indicate the rate of stormwater inflow to the wet pond from each sub-catchment as a function of time, accounting for ditch travel time. The summation of the flow rates for each time increment is indicated for controlled areas and uncontrolled areas. Note that the uncontrolled area consists of subcatchment C1, which is directed to the vegetative swale and sand filter. The values of flow rate Civil Geotechnical Structural Environmental 13
14 2013 April 2 Storm Water Report Concrete and Asphalt Plants 891 Jinkinson Road, Ottawa Report STM1 versus time for controlled areas represent inflow hydrographs of the wet pond (for corresponding frequency and duration). For example: - Consider a 5-year storm event of 30 minute duration; - This case is considered in Table B2, in the section 30 MIN Storm ; - The intensity of this storm is I = 54 mm/hr (based on the City of Ottawa IDF equation); - Consider catchment area C2: A= 1.23 ha, C = 0.7, t c for overland flow = 20 min, ditch travel t = 5 minutes; - No runoff from this area will have reached the outlet (i.e. the pond) until more than 5 minutes have elapsed; - In Table B2, under 30 MIN Storm, Runoff (m 3 /s) = 0 for Time (min) = 0 to 5; - After 25 minutes have elapsed, the rate of runoff contributed by area C2 to the pond would be at its peak (since the elapsed time equals time of concentration of C2) and is estimated as: Q = CIA = m 3 /s; - In Table B2, under 30 MIN Storm, Runoff (m 3 /s) = for Time (min) = 25; - For an elapsed time of 5 to 25 minutes, the rate of runoff contributed by C2 to the pond would be greater than zero but less than m 3 /s; - For example, after 15 minutes of elapsed time, the rate of runoff contributed by area C2 to the pond is calculated as: Q = CIA x (time elapsed- time of travel in ditch)/ (t c of catchment) Q = (0.129) ((15 5)/ 20) Q = m 3 /s; - In Table B2, under 30 MIN Storm, Runoff (m 3 /s) = for Time (min) = 15; - Similarly, the runoff rate contributed to the pond by the other catchment areas, during the design 5-year 30 min storm, was also calculated as a function of elapsed time; - The total runoff rate arriving at the pond (i.e. the controlled runoff rate) at a given time was calculated as the sum of runoff rates contributed by each controlled catchment area (presented in the row labelled Controlled ); - The maximum runoff rate corresponding to the storm under consideration is indicated in bold (in the case of the 5-year, 30 minute storm, the maximum runoff rate was determined to be m 3 /s corresponding to an elapsed time of 25 and 30 minutes); - The runoff rate from the uncontrolled areas (in this case area C1 only) is also indicated; - Similarly, runoff rates versus elapsed time and maximum runoff rates were calculated for 5-year design storms of 10, 15, 20, 25, 30, 40, 60, 80 and 120 minute duration; - The maximum runoff rates associated with 5-year storms of all durations considered are presented in the summary-table Summary Storm Duration Versus Maximum Runoff at the top of Table B2; - Of all 5-year design storms considered, the maximum runoff rate arriving at the storm pond (i.e. the Max Controlled runoff rate) was found to be 1.23 m 3 /s, corresponding to a design storm of 15 minute duration; - In Table B3, the calculations were repeated for 100-year design storms of various duration; - The time versus runoff rates for the worst case 5-year and 100-year storm events were considered as inflow to the pond in storage versus discharge calculations presented in Tables C1 and C2. Civil Geotechnical Structural Environmental 14
15 2013 April 2 Storm Water Report Concrete and Asphalt Plants 891 Jinkinson Road, Ottawa Report STM1 Allowable Controlled Area Release Rate The allowable controlled area release rates were calculated as the calculated outflow restriction (i.e. the peak predevelopment runoff rate) less the uncontrolled peak runoff. For example, for a 5-year storm event, the peak pre-development runoff rate was found to be m 3 /s, corresponding to a storm duration of 50 minutes (Table A2). The maximum post-development runoff rate was found to be 1.23 m 3 /s, which would occur during a storm of 15 min duration (Table B2). The maximum uncontrolled runoff for this design storm event was found to be m 3 /s. The allowable discharge for a 5-year storm of 15 minute duration was therefore calculated as (Table C1): Q5 year allowable = m 3 /s m 3 /s = 0.31 m 3 /s = 310 L/s Similarly, allowable controlled area release rates for 5-year storms of 60 and 120 minute duration are presented in Tables C1, C2 and C3 respectively. Results for 100-year storms of 15, 30, 60, 80 and 120 minute duration are presented in Tables C4, C5, C6, C7 and C8 respectively. 5 STORAGE 5.1 Stormwater Storage The wet pond indicated in the site servicing drawings has been designed for attenuation of discharge flowrate as well as for water quality control. Stormwater is to be directed to the pond via ditches. Weirs are to be provided at the pond outlet to limit the discharge to the allowable controlled area release rates for the 5-year and 100-year storm events. Calculations of required volume of on-site stormwater storage to attenuate discharge flowrate are presented in Appendix C. The pond was designed for water quality control according to the requirements of the MOE Manual; associated calculations are included as Appendix D. Calculation of the storage volume in the pond and ditches, as a function of elevation, are included as Appendix E. Results of the storage and discharge calculations are summarized in Tables 5.1 and 5.2. Civil Geotechnical Structural Environmental 15
16 2013 April 2 Storm Water Report Concrete and Asphalt Plants 891 Jinkinson Road, Ottawa Report STM1 Summary Table 5.1: Storage and Discharge for 5-year storms (allowable total outflow 0.52 m 3 /s) Storm Duration Minutes Storage Ponding Max Uncontrolled Total Req d Elevation Discharge Peak Runoff Outflow m 3 From Pond Rate m m 3 /s m 3 /s m 3 /s Maximum storage for 5-year storms = 1309 m 3 resulting in a ponding elevation of m. Summary Table 5.2: Storage and Discharge for 100-year storms (allowable total outflow 1.10 m 3 /s) Storm Duration Minutes Storage Ponding Max Uncontrolled Total Req d Elevation Discharge Peak Runoff Outflow m 3 From Pond Rate m m 3 /s m 3 /s m 3 /s Maximum storage for 100-year storms = 2458 m 3 resulting in a ponding elevation of m. Pond discharge versus time is plotted for 5-year and 100-year storm events in Figures 5.1 and 5.2 respectively. Civil Geotechnical Structural Environmental 16
17 2013 April 2 Storm Water Report Concrete and Asphalt Plants 891 Jinkinson Road, Ottawa Report STM1 Figure 5.1 Pond discharge vs time for 5-year storms Figure 5.2: Pond discharge vs time for 100-year storms Civil l Geotechnical Structural Environmental 17
18 2013 April 2 Storm Water Report Concrete and Asphalt Plants 891 Jinkinson Road, Ottawa Report STM1 For 5-year design storms, the maximum discharge rate from the pond was calculated as m 3 /s, corresponding to a storm duration of 60 minutes. The uncontrolled runoff corresponding to this design storm was calculated as m 3 /s. The total post development outflow for this storm would therefore be 0.37 m 3 /s. The allowable outflow of 0.52 m 3 /s (based on predevelopment conditions) would therefore be respected. Similarly, for 100-year design storms, the maximum discharge rate from the pond was calculated as 0.72 m 3 /s, corresponding to a storm duration of 60 minutes. The uncontrolled runoff corresponding to this design storm was calculated as 0.23 m 3 /s. The total post development outflow for this storm would therefore be 0.95 m 3 /s. The 30 minute storm event was found to produce the maximum outflow rate of 1.08 m 3 /s (0.70 m 3 /s from the pond and 0.38 m 3 /s uncontrolled). The allowable outflow of 1.10 m 3 /s (based on predevelopment conditions) would therefore be respected. Storage required versus storm duration is plotted in Figure 5.3. The maximum storage associated with 5-year storm events was found to be 1309 m 3, corresponding to a 60 minute storm. The maximum storage associated with 100-year storm events was found to be 2438 m 3, corresponding to a 60 minute storm. Figure 5.3: Required Storage vs Storm Duration Civil Geotechnical Structural Environmental 18
19 2013 April 2 Storm Water Report Concrete and Asphalt Plants 891 Jinkinson Road, Ottawa Report STM1 The calculation of required storage is an iterative process: the required storage is related to the release rate, the release rate is dependent on the head of water above the control structure (in this case two outlet weirs), which is in turn dependent on the storage volume. The calculation of required storage and the rate of release for the design storm events are presented in the tables of Appendix C. The runoff rates entering the pond was set equal to the inflow hydrograph associated with the design storm under consideration (calculated in Appendix B and summarized in Figures 5.1 and 5.2 above). Volume entering the pond over time was then calculated based on this inflow rate. In the first iteration, the discharge rate (outflow hydrograph from storage) was set to arbitrary values less than the allowable controlled area release rate. The required storage was then calculated based on this release rate. The calculated required storage volume was input into Table E1 (Appendix E) to determine the corresponding head of water and discharge rate over the outlet weir of the wet pond. The discharge rate calculated in Table E was then re-entered as the discharge rate in Tables B2 or B3, and a new corresponding value of required storage volume was calculated. Further iterations were calculated, with adjustments made to the shapes of the wet pond and outlet weirs, until convergence was achieved. The storage requirements and weir design are reflected in the design of the wet pond indicated in the site servicing drawings. 5.2 Additional potential inlet flows There is an existing sump in the structure under the aggregate bins, (to the north of the wash station). This sump is equipped with two pumps, one capable of delivering 17.4 L/s, the other 7.9 L/s. It is planned to use ground water from this sump in the production of concrete, and as dilution water for the grey water from the truck wash station (discussed in section 6.2). There is an additional sump in the office/garage which is equipped with a pump capable of delivering 15 U.S. G.P.M. (1 L/s). It is proposed to route water pumped from these sumps through the stormwater pond, rather than constructing a separate ditch network. Civil Geotechnical Structural Environmental 19
20 2013 April 2 Storm Water Report Concrete and Asphalt Plants 891 Jinkinson Road, Ottawa Report STM1 The maximum flow rate associated with the groundwater pumps is 26.3 L/s or m 3 /s. The calculated maximum inflow to the stormwater pond associated with a design storm of 5-year return period is 1.23 m 3 /s. The maximum flow from groundwater sumps would therefore represent about 2% of the peak flow associated with the 5-year design storm. The contribution of groundwater pumped from the sumps is considered negligible with regard to storage volume. 6 WATER QUALITY CONTROL Stormwater runoff quality control is to be provided primarily by a wet pond to be constructed south of the parking area for the concrete plant. In addition, a vegetated swale/ sand filter system has been designed to treat the runoff from the area between the asphalt plant and the berm along Jinkinson Road. 6.1 Wet pond Design for Stormwater Treatment The receiving body for the treated storm water discharged from the wet pond is the creek at the south end of the property, which flows in a general eastward direction toward wetland areas to the south-east of the site. An enhanced level of stormwater treatment is to be provided. The Ministry of Environment s Stormwater Management Planning and Design Manual (MOE Manual) details the requirements for storm water quality based on the receiving body of water. Enhanced treatment corresponds to a long-term average removal of 80% of total suspended solids (TSS). In the MOE Manual, Table 3.2 Water Quality Storage Requirements Based on Receiving Waters outlines the storm water storage requirements for quality purposes required to achieve the desired level of protection. In Part 4, the MOE Manual details the design requirements of several types of end of pipe storm water management facilities. The proposed wet pond has been designed according to the criteria set out in the MOE Manual for ponds proportioned for enhanced treatment. Calculations related to the water quality control design of the wet pond are presented in Table D1 of Appendix D. Note that the active storage volume was governed by the 100-year storm storage rather than by water quality storage requirement. Civil Geotechnical Structural Environmental 20
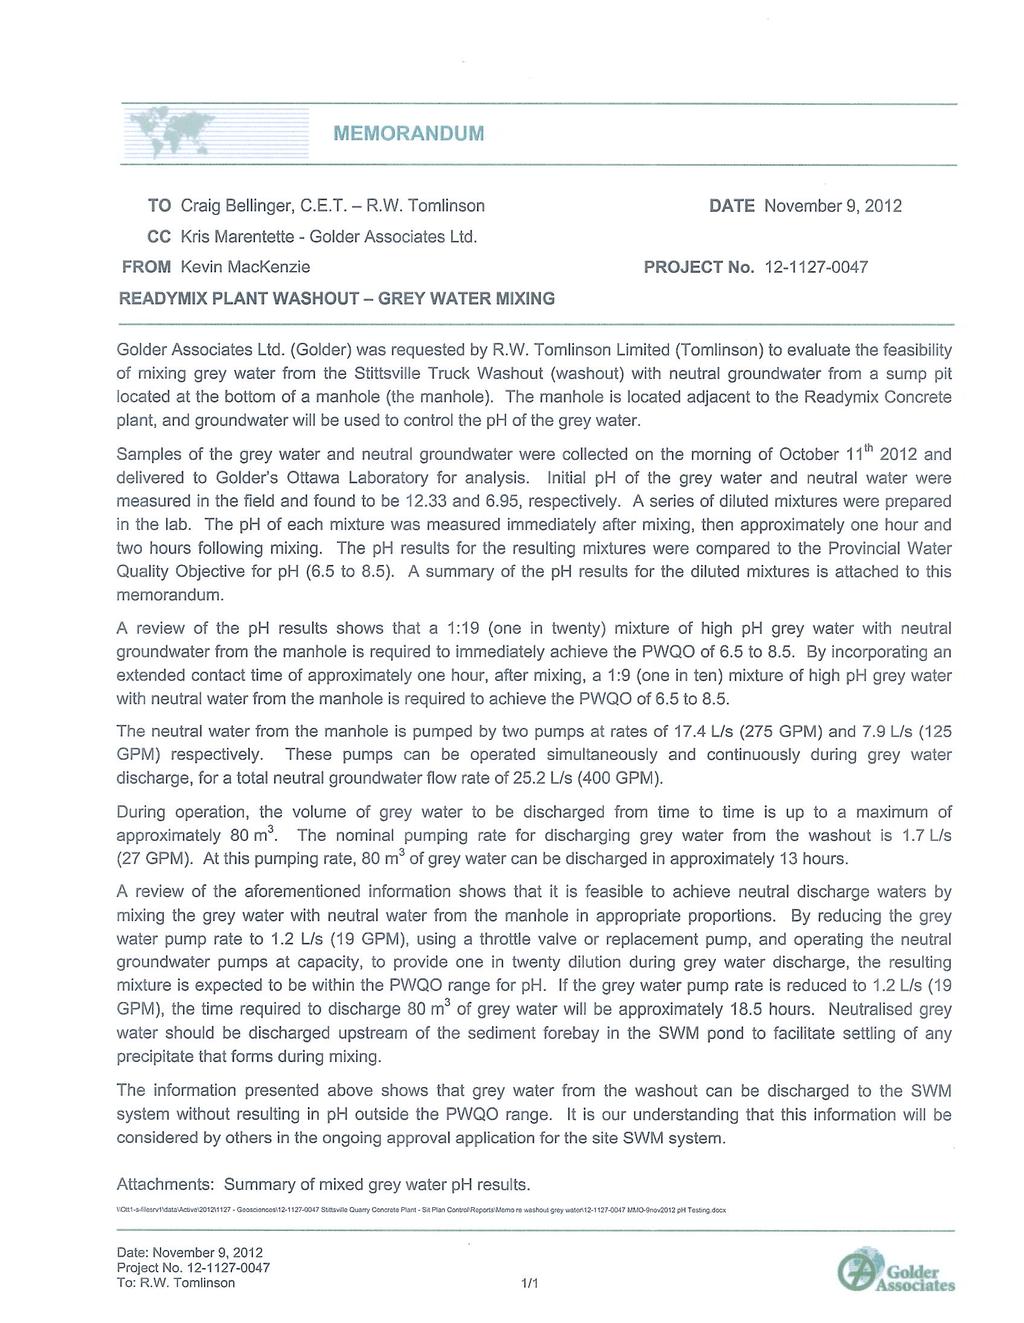
21 2013 April 2 Storm Water Report Concrete and Asphalt Plants 891 Jinkinson Road, Ottawa Report STM Grey Water from Truck Wash Station Used wash water from the truck wash station is collected in a grey water tank under the pump house (refer to Drawing #4 Total Site and Grading Details). Stormwater runoff from the area identified as Catchment Area 10 in Fig 2 of this report is also collected in this tank. Based on information from R.W. Tomlinson Limited, it is our understanding that this grey water is to be used in the production of concrete, but that from time to time, grey water is to be discharged. A feasibility study conducted by Golder Associates Ltd. (Golder) for R.W. Tomlinson (Golder report , Appendix G) determined that grey water from the wash station tank, mixed with groundwater at a ratio of 1:19 (one in twenty), could be discharged to the stormwater management pond without resulting in a ph outside the Provincial Water Quality Objective. The report suggests that a suitable mixing ratio may be achieved by reducing the grey water pump rate to 1.2L/s while maintaining the existing total discharge rate of 25.2L/s from the groundwater sump. Grey water diluted as per the Golder report would contribute a maximum of 26.4 L/s to the proposed stormwater management pond, over a period of 18.5 hours. Note that the proposed dilution water is the groundwater sump mentioned in section 5.2 above. The inflow rate associated with the design 100-year storm and 5-year storm events and the allowable discharge are an order of magnitude greater than the grey water flow. The grey water flow rate is considered negligible with regard to storage requirements. However, grey water flow has been considered in proportioning of the pond with regard to treatment. 6.2 Sand Filter The receiving body for the vegetated swale/ sand filter is the ditch along Jinkinson Road. The system has been designed in accordance with Part 4 section of the MOE Manual to provide a Normal level of treatment, defined as 70% TSS removal. The sand filter system is to provide water quality control only; it has not been designed for flow attenuation. The sub-catchment area served by the filter has been considered as an uncontrolled area for the purposes of stormwater quantity control (i.e. flow attenuation). As indicated in the site servicing drawings, runoff from the area between the asphalt plant and the berm along Jinkinson Road is to be collected in a grassed swale. A sand filter is to be constructed Civil Geotechnical Structural Environmental 21
22 2013 April 2 Storm Water Report Concrete and Asphalt Plants 891 Jinkinson Road, Ottawa Report STM1 within the swale, near its outlet. Discharge from the sand filter is to be directed via a swale to the existing ditch along Jinkinson Road. The filter is to treat the water quality storage volume prescribed by the MOE Manual. The purpose of the filter is to treat the first flush of runoff (represented by the water quality storage volume), which is considered to carry the greatest proportion of the suspended solids. According to section of the MOE Manual, Volumetric Sizing Water Quality volumes to be used in the design of a filter are to be as indicated in Table 3.2 under the infiltration heading. The impervious ratio for the sub-catchment area is about 58 percent. From Table 3.2 of the MOE Manual, the water quality storage requirement at a normal level of treatment was determined to be 20 cubic metres per hectare. Since the area to be treated by the filter is 1.5 hectares, the total water quality storage requirement is 30 cubic metres. Part 4 section states that pre-treatment is recommended for all filters. The pre-treatment storage should have a volume equal to 25% of the design water quality control volume. This is equal to 0.25*30 = 7.5 m 3. The treatment and pre-treatment storage volumes are to be provided within the grassed swale. Plan and cross section drawings of the swale are included on the site-servicing plan. The bottom of the swale is to be about 1 m in width and is to slope at 0.3% toward the filter. The elevation of the bottom of the swale at the location of the filter is to be m. A ponding elevation of m was determined to correspond to a volume of about 8.79 m 3 of storage in the swale. This volume has been considered as the design pre-treatment storage volume. An overflow swale is to be provided at elevation m so that water ponding above this level will be diverted from the filter. An elevation of m corresponds to a total storage volume of m 3, which is m 3 in excess of the pre-treatment volume. The design water quality storage volume that would be treated is therefore m Filter Design Calculations Calculations associated with the filter design are included as Appendix F. The sand filter is to be constructed with a relatively uniformly graded sand commonly used in the construction of onsite septic systems. The filter sand is to have a percolation rate of T = 4 to 6 Civil Geotechnical Structural Environmental 22
23 2013 April 2 Storm Water Report Concrete and Asphalt Plants 891 Jinkinson Road, Ottawa Report STM1 min/cm with less than 2% silt/clay content. A percolation rate of T = 4 to 6 min/cm corresponds to a permeability of 180 mm/h to 360 mm/h or a k of 1 x 10⁻² cm/sec to 5 x 10⁻³ cm/sec. It is acknowledged that a permeability of 360 mm/h is greater than the suggested value for sand of 45 mm/hr as found in the MOE Manual Equation The selected sand was chosen for the following reason. A permeability of 45 mm/hr corresponds to sand with a percolation rate of 8 min/cm. Commercially available sand with a percolation rate of 8 min/cm is much less well controlled during production than sand with a percolation rate of 4 to 6 min/cm. Using the selected filter sand will ensure a better product is used within the filter than had a sand with a higher percolation rate been specified. The MOE Manual states that the size of the filter may be determined using the Darcy Equation, which is equation 4.12 in the MOE Manual: A = 1000Vd k( h + d) t Where: A = surface area of the filter in m 2 V = design volume (m 3 ) to be outlet through filter d = depth (m) of the controlling filter medium (sand) k = soil percolation rate in mm/hr h = average operating head of water on the filter (m) t = design drawdown time in hours A depth (i.e. thickness) of 0.5 m of sand has been specified. For the design water quality storage volume of V = m 3, the elevation of the top of the water stored in the ditch would be m. This would result in a contact surface area of A = 1.6 m 2 of sand through which the runoff would be filtered. The average head on the filter at this ponding elevation would be h = 0.2 m. For the sand specified, the resulting drawdown time would be 48.5 hrs, which is greater than the minimum 24 hours recommended. The storage will outlet either completely through the sand filter or through the overflow swale (elevation m) and ultimately discharge into the roadside ditch. Civil Geotechnical Structural Environmental 23
24 2013 April 2 Storm Water Report Concrete and Asphalt Plants 891 Jinkinson Road, Ottawa Report STM Filter Maintenance. Silt/sediment may be removed from the surface of the sand filter if the flow rate through the filter is observed to slow, causing excessive water back up in the swale during storm events. The upstream layer of the filter material (e.g., 0.1 to 0.15 m) should be removed and replaced with clear material when accumulated sediment is removed from the filter. SUMMARY The proposed stormwater management design consists of directing the flow by means of sheet runoff, swales and ditches to a wet pond at the southern end of the site. The wet pond is to provide an enhanced level of treatment, as defined by the Ontario Ministry of Environment Stormwater Management, Planning & Design Manual, 2003 (MOE Manual). The outlet of the pond is to be equipped with weirs to limit the discharge rate to that of pre-development conditions. The pond outlet is to discharge to a ditch to be constructed outside of the setback limit to the protected wetland. The outlet ditch is to discharge to an existing creek, flowing generally eastward from the southern end of the site. Existing topography precludes directing all of the runoff into the proposed wet pond. The area between the asphalt plant and Jinkinson Road is to be directed to a grassed swale leading to a sand filter designed to provide a normal level of treatment (as defined by the MOE Manual) before ultimately discharging into the ditch along Jinkinson Road. Civil Geotechnical Structural Environmental 24

25 2013 April 2 Storm Water Report Concrete and Asphalt Plants 891 Jinkinson Road, Ottawa Report STM1 We trust that this report provides sufficient information for your present purposes. If you have any questions concerning this report or if we can be of any further assistance to you on this project, please do not hesitate to contact our office. Sincerely, Ian Malcolm, P.Eng. Kollaard Associates, Inc. Related Drawings: Drawing # SS Site Servicing Plan # DP Drainage Control Plan Attachments: Figure 1 Key Plan Figure 2 - Controlled and Uncontrolled areas Appendix A Rational Method Analysis of Pre-development Conditions Appendix B Rational Method Analysis of Post-development Conditions Appendix C Storage Volume Requirements Appendix D Wet Pond Design for Water Quality Control Appendix E Elevation vs Storage Volume in Pond Appendix F Sand Filter Design Appendix G - Golders Associates Ltd. Memorandum Project No Civil Geotechnical Structural Environmental 25
26 KEY PLAN FIGURE 1 N APPROXIMATE SITE NOT TO SCALE Project No Date 2012
27


28
29 Appendix A Rational Method Analysis of Pre-development Conditions
30 Table A-1 Pre Develoment - C & tc Tributary Area Total Area (m2) Building Area/asphalt Septic Bed Grass, Shrubs, trees over shallow bedrock C Slope (%) velocity (m/s) Length of Catchment (m) tc - catch (min) Label C= FAA
31 Table A-2 Pre Development - Storm Runoff Rates for 5-year Event Summary - Storm Duration vs Maximum Runoff Duration (min) Max Intensity (mm/hr) Controlled m 3 /s Time (min) vs Runoff (m 3 /s) Uncontrolled m 3 /s Total m 3 /s Calculated Outflow Restriction 0.52 m 3 /s Max RO (m3/s) Area (ha) C tc ditch (min) Tc catch(min) MIN Storm Controlled Max m 3 /s Uncontrolled Max m 3 /s Total Max m 3 /s MIN Storm Controlled Max m 3 /s Uncontrolled Max m 3 /s Total Max m 3 /s MIN Storm Controlled Max m 3 /s Uncontrolled Max m 3 /s Total Max m 3 /s MIN Storm Controlled Max m 3 /s Uncontrolled Max m 3 /s Total Max m 3 /s MIN Storm Controlled Max m 3 /s Uncontrolled Max m 3 /s Total Max m 3 /s
32 Table A-2 Pre Development - Storm Runoff Rates for 5-year Event Summary - Storm Duration vs Maximum Runoff Duration (min) Max Intensity (mm/hr) Controlled m 3 /s Time (min) vs Runoff (m 3 /s) Uncontrolled m 3 /s Total m 3 /s Calculated Outflow Restriction 0.52 m 3 /s Max RO (m3/s) Area (ha) C tc ditch (min) Tc catch(min) MIN Storm Controlled Max m 3 /s Uncontrolled Max m 3 /s Total Max m 3 /s MIN Storm Controlled Max m 3 /s Uncontrolled Max m 3 /s Total Max m 3 /s MIN Storm Controlled Max m 3 /s Uncontrolled Max m 3 /s Total Max m 3 /s MIN Storm Controlled Max m 3 /s Uncontrolled Max m 3 /s Total Max m 3 /s
33 Table A-3 Pre Development (100 Year) - Storm Runoff Event Duration (min) Intensity (mm/hr) Time (min) vs Runoff (m 3 /s) Summary - Storm Duration vs Maximum Runoff Max Controlled m 3 /s Uncontrolled m 3 /s Total m 3 /s Calculated Outflow Restriction 1.10 m 3 /s Max RO (m3/s) Area (ha) C tc ditch (min) Tc catch(min) MIN Storm Controlled Max m 3 /s Uncontrolled Max m 3 /s Total Max m 3 /s MIN Storm Controlled Max m 3 /s Uncontrolled Max m 3 /s Total Max m 3 /s MIN Storm Controlled Max m 3 /s Uncontrolled Max m 3 /s Total Max m 3 /s MIN Storm Controlled Max m 3 /s Uncontrolled Max m 3 /s Total Max m 3 /s MIN Storm Controlled Max m 3 /s Uncontrolled Max m 3 /s Total Max m 3 /s
34 Table A-3 Pre Development (100 Year) - Storm Runoff Event Duration (min) Intensity (mm/hr) Time (min) vs Runoff (m 3 /s) Summary - Storm Duration vs Maximum Runoff Max Controlled m 3 /s Uncontrolled m 3 /s Total m 3 /s Calculated Outflow Restriction 1.10 m 3 /s Max RO (m3/s) Area (ha) C tc ditch (min) Tc catch(min) MIN Storm Controlled Max m 3 /s Uncontrolled Max m 3 /s Total Max m 3 /s MIN Storm Controlled Max m 3 /s Uncontrolled Max m 3 /s Total Max m 3 /s MIN Storm Controlled Max m 3 /s Uncontrolled Max m 3 /s Total Max m 3 /s MIN Storm Controlled Max m 3 /s Uncontrolled Max m 3 /s Total Max m 3 /s
35 Appendix B Rational Method Analysis of Post-development Conditions
36 Table B-1 Post Develoment - C & tc Tributary Area Total Area (m2) Building or Impervious Area Grass and Shrubs Gravel Surface Septic bed Pond Weighted Average C Slope (%) Length of Ditch (m) velocity (m/s) Length of Catchment (m) tc - catch (min) Time of travel in ditch (min) Tc for catchment area rounded (min) Label C = C1 (uncontrolled) C C C C C C C C C10 (recycled) Total C Time of travel in ditch round(min) Area contributing to pond weighted average C Impervious ratio 0.26 Impervious ratio of area contributing to pond 0.17
37
38 Table B-2 Post Development (5 Year) - Storm Runoff Event Summary - Storm Duration vs Maximum Runoff Duration vs Intensity Max Duration (min) Max Controlled m 3 /s Intensity (mm/hr) Max Uncontrolled m 3 /s Max Combined Areas m 3 /s Time (min) vs Runoff (m 3 /s) Max RO (m3/s) Area (ha) C tc ditch (min) Tc catch(min) MIN Storm (uncontrolled) C C C C C C C C C10 (recycled) Controlled Max m 3 /s Uncontrolled Max m 3 /s Total Max m 3 /s MIN Storm (uncontrolled) C C C C C C C C C10 (recycled) Controlled Max m 3 /s Uncontrolled Max m 3 /s Total Max m 3 /s MIN Storm (uncontrolled) C C C C C C C C C10 (recycled) Controlled Max m 3 /s Uncontrolled Max m 3 /s Total Max m 3 /s
39 Table B-2 Post Development (5 Year) - Storm Runoff Event Summary - Storm Duration vs Maximum Runoff Duration vs Intensity Max Duration (min) Max Controlled m 3 /s Intensity (mm/hr) Max Uncontrolled m 3 /s Max Combined Areas m 3 /s Time (min) vs Runoff (m 3 /s) Max RO (m3/s) Area (ha) C tc ditch (min) Tc catch(min) MIN Storm (uncontrolled) C C C C C C C C C10 (recycled) Controlled Max m 3 /s Uncontrolled Max m 3 /s Total Max m 3 /s MIN Storm (uncontrolled) C C C C C C C C C10 (recycled) Controlled Max m 3 /s Uncontrolled Max m 3 /s Total Max m 3 /s MIN Storm (uncontrolled) C C C C C C C C C10 (recycled) Controlled Max m 3 /s Uncontrolled Max m 3 /s Total Max m 3 /s
40 Table B-2 Post Development (5 Year) - Storm Runoff Event Summary - Storm Duration vs Maximum Runoff Duration vs Intensity Max Duration (min) Max Controlled m 3 /s Intensity (mm/hr) Max Uncontrolled m 3 /s Max Combined Areas m 3 /s Time (min) vs Runoff (m 3 /s) Max RO (m3/s) Area (ha) C tc ditch (min) Tc catch(min) MIN Storm (uncontrolled) C C C C C C C C C10 (recycled) Controlled Max m 3 /s Uncontrolled Max m 3 /s Total Max m 3 /s MIN Storm (uncontrolled) C C C C C C C C C10 (recycled) Controlled Max m 3 /s Uncontrolled Max m 3 /s Total Max m 3 /s MIN Storm (uncontrolled) C C C C C C C C C10 (recycled) Controlled Max m 3 /s Uncontrolled Max m 3 /s Total Max m 3 /s
41 Table B-3 Post Development (100 Year) - Storm Runoff Event Summary - Storm Duration vs Maximum Runoff Duration vs Intensity Max Duration (min) Max Controlled m 3 /s Intensity (mm/hr) Max Uncontrolled m 3 /s Time (min) vs Runoff (m 3 /s) Max Combined Areas m 3 /s Max RO (m3/s) Area (ha) C tc ditch (min) Tc catch(min) MIN Storm (uncontrolled) C C C C C C C C C10 (recycled) Controlled Max m 3 /s Uncontrolled Max m 3 /s Total Max m 3 /s MIN Storm (uncontrolled) C C C C C C C C C10 (recycled) Controlled Max m 3 /s Uncontrolled Max m 3 /s Total Max m 3 /s MIN Storm (uncontrolled) C C C C C C C C C10 (recycled) Controlled Max m 3 /s Uncontrolled Max m 3 /s Total Max m 3 /s
42 Table B-3 Post Development (100 Year) - Storm Runoff Event Summary - Storm Duration vs Maximum Runoff Duration vs Intensity Max Duration (min) Max Controlled m 3 /s Intensity (mm/hr) Max Uncontrolled m 3 /s Time (min) vs Runoff (m 3 /s) Max Combined Areas m 3 /s Max RO (m3/s) Area (ha) C tc ditch (min) Tc catch(min) (uncontrolled) C C C C C C C C C10 (recycled) Controlled Max m 3 /s Uncontrolled Max m 3 /s Total Max m 3 /s (uncontrolled) C C C C C C C C C10 (recycled) Controlled Max m 3 /s Uncontrolled Max m 3 /s Total Max m 3 /s (uncontrolled) C C C C C C C C C10 (recycled) Controlled Max m 3 /s Uncontrolled Max m 3 /s Total Max m 3 /s
43 Table B-3 Post Development (100 Year) - Storm Runoff Event Summary - Storm Duration vs Maximum Runoff Duration vs Intensity Max Duration (min) Max Controlled m 3 /s Intensity (mm/hr) Max Uncontrolled m 3 /s Time (min) vs Runoff (m 3 /s) Max Combined Areas m 3 /s Max RO (m3/s) Area (ha) C tc ditch (min) Tc catch(min) (uncontrolled) C C C C C C C C C10 (recycled) Controlled Max m 3 /s Uncontrolled Max m 3 /s Total Max m 3 /s (uncontrolled) C C C C C C C C C10 (recycled) Controlled Max m 3 /s Uncontrolled Max m 3 /s Total Max m 3 /s (uncontrolled) C C C C C C C C C10 (recycled) Controlled Max m 3 /s Uncontrolled Max m 3 /s Total Max m 3 /s
44 Table B-4: Post Development (2 Year) - Water Quality Storm Runoff Event Duration (min) Intensity (mm/hr) Max RO (m3/s) Path# Tributary Area Area (ha) C tc ditch (min) Tc catch(min) MIN Storm Time (min) controlled) C C C C C C C C (recycled) Controlled Max m 3 /s Uncontrolled Max m 3 /s Total Max m 3 /s For areas contributing runoff to pond, C avg = 0.71 (TableB-1) Intensity of water quality storm, i = 43C+5.9 (MOE Manual eq'n 4.9) i = mm/hr 2-year 30 minute storm was selected to model water quality storm since i = 40 mm/hr
45 Appendix C Storage Volume Requirements
46 Table C1: Quantity Storage Volume Requirement Calculation Outflow restriction m3/s Uncontrolled peak runoff m3/s 5 year storm event Allowable Discharge m 3 /sec 15 minute duration Max Discharge m 3 /sec Storage req'd m 3 post development Ponding Elevation m Cumulative Total Active Time Runoff Rate Volume Cumulative Actual Discharge Discharge Storage Entering Pond per interval Volume Discharge Volume Volume Requirement min m 3 /sec m 3 m 3 m 3 /sec m 3 m 3 m 3 n Column 1 Column 2 Column 3 Column 4 Column 5 Column 6 Column 7 Column 8 Column 1 Elapsed time from start of storm (min) Column 2 Runoff rates corresponding to elapsed time for 5 year storm of 15 minute duration, Table B-2 Column 3 Column 2 x (Column 1 n - Column 1 n-1 ) x 60 s/min Column 4 Column 3 n + Column 4 n-1 Column 5 Discharge from Table E1 corresponding to volume in Column 8 Column 6 Column 5 x (Column 1 n - Column 1 n-1 ) x 60 s/min Column 7 Column 6 n + Column 7 n-1 Column 8 Column 4- Column 7
47 Table C2: Quantity Storage Volume Requirement Calculation Outflow restriction m3/s Uncontrolled peak runoff m3/s 5 year storm event Allowable Discharge m 3 /sec 60 minute duration Max Discharge m 3 /sec Storage req'd m 3 post development Ponding Elevation m Cummulative Total Active Time Runoff Rate Volume Cumulative Actual Discharge Discharge Storage Entering Pond per interval Volume Discharge Volume Volume Requirement min m 3 /sec m 3 m 3 m 3 /sec m 3 m 3 m 3 n Column 1 Column 2 Column 3 Column 4 Column 5 Column 6 Column 7 Column 8 Column 1 Elapsed time from start of storm (min) Column 2 Runoff rates corresponding to elapsed time for 5 year storm of 15 minute duration, Table B-2 Column 3 Column 2 x (Column 1 n - Column 1 n-1 ) x 60 s/min Column 4 Column 3 n + Column 4 n-1 Column 5 Discharge from Table E1 corresponding to volume in Column 8 Column 6 Column 5 x (Column 1 n - Column 1 n-1 ) x 60 s/min Column 7 Column 6 n + Column 7 n-1 Column 8 Column 4- Column 7
48 n Table C3: Quantity Storage Volume Requirement Calculation Outflow restriction m3/s Uncontrolled peak runoff m3/s 5 year storm event Allowable Discharge m 3 /sec 120 minute duration Max Discharge m 3 /sec Storage req'd m 3 post development Ponding Elevation m Cummulative Total Active Time Runoff Rate Volume Cumulative Actual Discharge Discharge Storage Entering Pond per interval Volume Discharge Volume Volume Requirement min m 3 /sec m 3 m 3 m 3 /sec m 3 m 3 m Column 1 Column 2 Column 3 Column 4 Column 5 Column 6 Column 7 Column 8 Column 1 Elapsed time from start of storm (min) Column 2 Runoff rates corresponding to elapsed time for 5 year storm of 15 minute duration, Table B-2 Column 3 Column 2 x (Column 1 n - Column 1 n-1 ) x 60 s/min Column 4 Column 3 n + Column 4 n-1 Column 5 Discharge from Table E1 corresponding to volume in Column 8 Column 6 Column 5 x (Column 1 n - Column 1 n-1 ) x 60 s/min Column 7 Column 6 n + Column 7 n-1 Column 8 Column 4- Column 7
49 Table C4: Quantity Storage Volume Requirement Calculation Outflow restriction m3/s Uncontrolled peak runoff m3/s 100 year storm event Allowable Discharge 0.66 m 3 /sec 15 minute duration Max Discharge 0.51 m 3 /sec post development Storage req'd 1939 m 3 Ponding Elevation m Cummulative Total Active Time Runoff Rate Volume Cumulative Actual Discharge Discharge Storage Entering Pond per interval Volume Discharge Volume Volume Requirement min m 3 /sec m 3 m 3 m 3 /sec m 3 m 3 m 3 n Column 1 Column 2 Column 3 Column 4 Column 5 Column 6 Column 7 Column 8 Column 1 Elapsed time from start of storm (min) Column 2 Runoff rates corresponding to elapsed time for 5 year storm of 15 minute duration, Table B-2 Column 3 Column 2 x (Column 1 n - Column 1 n-1 ) x 60 s/min Column 4 Column 3 n + Column 4 n-1 Column 5 Discharge from Table E1 corresponding to volume in Column 8 Column 6 Column 5 x (Column 1 n - Column 1 n-1 ) x 60 s/min Column 7 Column 6 n + Column 7 n-1 Column 8 Column 4- Column 7
50 Table C5: Quantity Storage Volume Requirement Calculation Outflow restriction m3/s Uncontrolled peak runoff m3/s 100 year storm event Allowable Discharge 0.72 m 3 /sec 30 minute duration Max Discharge 0.70 m 3 /sec Storage req'd 2385 m 3 post development Ponding Elevation m Cummulative Total Active Time Runoff Rate Volume Cumulative Actual Discharge Discharge Storage Entering Pond per interval Volume Discharge Volume Volume Requirement min m 3 /sec m 3 m 3 m 3 /sec m 3 m 3 m 3 n Column 1 Column 2 Column 3 Column 4 Column 5 Column 6 Column 7 Column 8 Column 1 Elapsed time from start of storm (min) Column 2 Runoff rates corresponding to elapsed time for 5 year storm of 15 minute duration, Table B-2 Column 3 Column 2 x (Column 1 n - Column 1 n-1 ) x 60 s/min Column 4 Column 3 n + Column 4 n-1 Column 5 Discharge from Table E1 corresponding to volume in Column 8 Column 6 Column 5 x (Column 1 n - Column 1 n-1 ) x 60 s/min Column 7 Column 6 n + Column 7 n-1 Column 8 Column 4- Column 7
51 Table C6: Quantity Storage Volume Requirement Calculation Outflow restriction m3/s Uncontrolled peak runoff m3/s 100 year storm event Allowable Discharge 0.87 m 3 /sec 60 minute duration Max Discharge 0.72 m 3 /sec Storage req'd 2438 m 3 post development Ponding Elevation m Cummulative Total Active Time Runoff Rate Volume Cumulative Actual Discharge Discharge Storage Entering Pond per interval Volume Discharge Volume Volume Requirement min m 3 /sec m 3 m 3 m 3 /sec m 3 m 3 m 3 n Column 1 Column 2 Column 3 Column 4 Column 5 Column 6 Column 7 Column 8 Column 1 Elapsed time from start of storm (min) Column 2 Runoff rates corresponding to elapsed time for 5 year storm of 15 minute duration, Table B-2 Column 3 Column 2 x (Column 1 n - Column 1 n-1 ) x 60 s/min Column 4 Column 3 n + Column 4 n-1 Column 5 Discharge from Table E1 corresponding to volume in Column 8 Column 6 Column 5 x (Column 1 n - Column 1 n-1 ) x 60 s/min Column 7 Column 6 n + Column 7 n-1 Column 8 Column 4- Column 7
52 Table C7: Quantity Storage Volume Requirement Calculation Outflow restriction m3/s Uncontrolled peak runoff m3/s 100 year storm event Allowable Discharge 0.92 m 3 /sec 80 minute duration Max Discharge 0.68 m 3 /sec Storage req'd 2354 m 3 post development Ponding Elevation m Cummulative Total Active Time Runoff Rate Volume Cumulative Actual Discharge Discharge Storage Entering Pond per interval Volume Discharge Volume Volume Requirement min m 3 /sec m 3 m 3 m 3 /sec m 3 m 3 m 3 n Column 1 Column 2 Column 3 Column 4 Column 5 Column 6 Column 7 Column 8 Column 1 Elapsed time from start of storm (min) Column 2 Runoff rates corresponding to elapsed time for 5 year storm of 15 minute duration, Table B-2 Column 3 Column 2 x (Column 1 n - Column 1 n-1 ) x 60 s/min Column 4 Column 3 n + Column 4 n-1 Column 5 Discharge from Table E1 corresponding to volume in Column 8 Column 6 Column 5 x (Column 1 n - Column 1 n-1 ) x 60 s/min Column 7 Column 6 n + Column 7 n-1 Column 8 Column 4- Column 7
53 Table C8: Quantity Storage Volume Requirement Calculation Outflow restriction m3/s Uncontrolled peak runoff m3/s 100 year storm event Allowable Discharge 0.97 m 3 /sec 120 minute duration Max Discharge 0.58 m 3 /sec Storage req'd 2120 m 3 post development Ponding Elevation m Cummulative Total Active Time Runoff Rate Volume Cumulative Actual Discharge Discharge Storage Entering Pond per interval Volume Discharge Volume Volume Requirement min m 3 /sec m 3 m 3 m 3 /sec m 3 m 3 m 3 n Column 1 Column 2 Column 3 Column 4 Column 5 Column 6 Column 7 Column 8 Column 1 Elapsed time from start of storm (min) Column 2 Runoff rates corresponding to elapsed time for 5 year storm of 15 minute duration, Table B-2 Column 3 Column 2 x (Column 1 n - Column 1 n-1 ) x 60 s/min Column 4 Column 3 n + Column 4 n-1 Column 5 Discharge from Table E1 corresponding to volume in Column 8 Column 6 Column 5 x (Column 1 n - Column 1 n-1 ) x 60 s/min Column 7 Column 6 n + Column 7 n-1 Column 8 Column 4- Column 7
54 Table C9: Max Discharge during Water Quality Storm n 2 year storm event 30 minute duration Max Discharge, Qp = 0.16 m 3 /sec intensity 40 mm/hr Storage req'd 922 m 3 post development Cummulative Total Active Time Runoff Rate Volume Cumulative Actual Discharge Discharge Storage Entering Pond per interval Volume Discharge Volume Volume Requirement min m 3 /sec m 3 m 3 m 3 /sec m 3 m 3 m Column 1 Column 2 Column 3 Column 4 Column 5 Column 6 Column 7 Column 8 Column 1 Elapsed time from start of storm (min) Column 2 Runoff rates corresponding to elapsed time for 5 year storm of 15 minute duration, Table B-2 Column 3 Column 2 x (Column 1 n - Column 1 n-1 ) x 60 s/min Column 4 Column 3 n + Column 4 n-1 Column 5 Discharge from Table E1 corresponding to volume in Column 8 Column 6 Column 5 x (Column 1 n - Column 1 n-1 ) x 60 s/min Column 7 Column 6 n + Column 7 n-1 Column 8 Column 4- Column 7
55 n Table C10: Max Discharge during Water Quality Storm Including Grey Water Pumping 2 year storm event 30 minute duration Max Discharge, Qp = 0.18 m 3 /sec intensity 40 mm/hr Storage req'd 975 m 3 post development Greywater and Cummulative Total Active Time Runoff Rate Runoff Rate Volume Cumulative Actual Discharge Discharge Storage Entering Pond Entering Pond per interval Volume Discharge Volume Volume Requirement min m 3 /sec m 3 /sec m 3 m 3 m 3 /sec m 3 m 3 m Column 1 Column 2 Column 3 Column 4 Column 5 Column 6 Column 7 Column 8 Column 9 Column 1 Elapsed time from start of storm (min) Column 2 Runoff rates corresponding to elapsed time for 2 year storm of 30 minute duration, Table B-4 Column 3 Column 2 + Estimated Greywater Pumping Rate Column 4 Column 3 x (Column 1 n - Column 1 n-1 ) x 60 s/min Column 5 Column 4 n + Column 5 n-1 Column 6 Discharge from Table E1 corresponding to volume in Column 9 Column 7 Column 6 x (Column 1 n - Column 1 n-1 ) x 60 s/min Column 8 Column 7 n + Column 8 n-1 Column 9 Column 5- Column 8
56 Appendix D Wet Pond Design for Water Quality Control
57 Table D1: Wet Pond Design Based on Water Quality Sizing Criteria Required Volume Area to be treated = ha Table B1 Impervious Ratio = 0.17 Table B1 Impervious Ratio vs Storage Required for Enhanced Treatment Impervious Ratio (MOE Table) Storage Required (m 3 /ha) Total Quality Storage Volume = 771 m 3 95 m 3 /ha MOE Req'd Permanent Pool Storage Volume = 446 m 3 m 3 /ha MOE Extended Detention Quality StorageVolume = 325 m 3 40 m 3 /ha MOE 100 year Storage Volume = 2438 m 3 Table C6 Total Required Active Storage Volume = 2438 m 3 (greater of extended detention or 100 year) Total Required Volume = 2884 m 3 (active + permanent) Design Quality Storm A = area contributing to pond (Table B1) C = 0.71 avg C of areas contributing to pond (sheet'c') Peak Flow Rate of water quality storm i = 43*C+ 5.9 eqn 4.9 (MOE) = Qwq= CiA/360 eq'n 4.8 (MOE- flow rate associated with design water quality storm) = m 3 /s Grey Water flow rate diluted grey water discharged into pond Qgw = Q= Total water discharged to pond during water quality storm Forebay Length greater of a) Dist = (rq p /V s ) 0.5 b) Dist = 8Q/dV f Dist = length of dispersion Q p = peak flow rate from pond during design quality storm V s = settling velocity; recommended value m/s r = length-to-width ratio of forebay min 2:1 Q = inlet flowrate (m 3 /s) d = depth of the permannent pool in the forebay (m) V f = desired velocity in the forebay (m/s) 0.1 to 0.15 m/s S S = Side Slope Angle H:1V A CF = Cross section Area Forebay Minimum Forebay Deep Zone Bottom Width c) Width = Dist/8
58 Water quality storm modeled as 2 yr 30 min storm (i= 40 mm/hr greater than i calculated from MOE equation 4.9) Q p = 0.18 (peak outflow from pond during 2 year, 30 min storm (i= 40 mm/hr) V s = (MOE Manual) r = 4 (r >=2) Q = d = 1 V f = 0.15 S S = 4 Min Forebay Length a) = b) = Design Forebay Length 64.3 Forebay width (at elevation m) Min Forebay deep zone width c) = Actual Forebay deep zone width (at bottom) Min Length of Main Bay Design length of Main Bay Total length Actual Ave Forebay Velocity m 129 m m V f = Q/A CF A CF =depth 2 x sideslopes + depth x width A CF = m 2 V f = < 0.15 m/s ok elev width m m elevation of permanent bottom = m weir elevation of permanent pool = m weir elevation of 5-year storage = elevation of 100-year storage = min elevation of top of storage = m m m
59 Appendix E Elevation vs Storage Volume in Pond
60 Table E-1: Elevation versus Storage Volume Weir 1 2 Cw = L = g = weir elevation Volume Elevation Head Head Discharge Discharge Total above Over Over Through Through Discharge Elevation Change in Ponding Layer Cumulativepermanent Weir 1 Weir 2 Weir 1 Weir 2 Elevation Area Volume volume Pool Q=CwLh 3/2 Q=CwLh 3/2 n (m) (m) (m 2 ) (m 3 ) (m 3 ) (m) (m) (m 3 /s) (m 3 /s) (m 3 /s) NA NA NA NA NA NA NA NA NA NA NA Column 1 Column 2 Column 3 Column 4 Column 5 Column 1 Column 1 Column 6 Column 7 Column 8 Column 9Column 10
61 Column 1 Elevation n Column 2 Column 1 n -Column 1 (n-1) Column 3 Area of storage at Elevation n (from drawing) Column 4 Volume in storage between Elevation n and Elevation (n-1) Column 5 Column 4 n +Column 5 (n-1) Column 6 Column 1-Weir elevation Column 7 Column 1-Weir elevation Column 8 Q=CwLh 3/2 Column 9 Q=CwLh 3/2 Column 10Column 9 + Column 10
62 Appendix F Sand Filter Design
63 TABLE F1 : SAND FILTER WATER QUALITY VOLUME AND DISCHARGE RATE side slope 3 width (b) 1 sand filter media depth 0.5 m filter width 6 permeability of filter sand, k 360 mm/hr m/s swale slope overflow invert Water Layer Cumulative Pond Ave Head Surface Discharge Drawdown Total Layer Elevation Surface Volume Volume Depth On Sand Area of through Time Drawdown Area Filter Filter Filter per layer Time n m m 2 m 3 m 3 m m m 2 m3/sec Hours Hours Column 1 Column 2 Column 3 Column 4 Column 5 Column 6 Column 7 Column 8 Column 9 Column 10 Column 11 Column 1 Layer of water in storage under consideration Column 2 Elevation (at top of layer) in metres Column 3 Surface area of the ponded water in storage at a ponding level corresponding to the elevation in Column 1 Column 4 Volume of the layer under consideration (i.e. volume in storage between the corresponding elevation n and elevation n-1). Column 5 Sum of layer volumes (1 to n) Column 6 Elevation in column 2 less the elevation of the bottom of the pond Column 7 Half depth of water adjacent to filter. (Column 6 / 2) Column 8 Surface area of sand filter in contact with ponding water Column 9 Discharge calculated using Darcy's Law. Surface area (Column 8) x Permeability x ((media depth + average head on filter (Column 7)/media depth) Column 10 Time for water in layer n to discharge: Column 4 / Column 9 /360 Column 11 Time for water in layers 1 to n to discharge: sum of Column 10 from 1 to n
64 Table F2: Design Summary - Sand Filter Requirements of MOE Manual Provided in design Catchment area to be treated 1.52 ha Water Quality Volume 20 m 3 /ha Volume to be treated m 3 Treatment volume provided, V = m 3 Pretreatment Storage 25% of water quality volume Pretreatment Storage volume 7.58 m 3 Pre-treatment volume provided = 8.79 m 3 (pre-treatment storage is below elevation m) Filter area required: where 1000Vd A = V = volume to be treated= m 3 k( h + d) t d = depth of media = 0.5 m k = permeability = 360 mm/hr Total surface area of sand provided 3.0 m 2 h = head on filter = 0.20 m Area beneath pretreatment storage = 1.4 m 2 t = drawdown time = 48.5 hr Effective area of filter for treatment= 1.6 m 2 A REQ'D= 1.59 m 2
65 Appendix G Golder Associates Ltd. Memorandum Project No
66