Overview of Pollution Prevention (P2) GHG Calculator Training Module: April 2010
|
|
|
- Edgar Jefferson
- 5 years ago
- Views:
Transcription


 Environmental Assistance")
1 Overview of Pollution Prevention (P2) GHG Calculator Training Module: April 2010 Natalie Hummel Kathy Davey Charles Bevington Office of Pollution Prevention and Toxics (OPPT) Pollution Prevention Division (PPD) Environmental Assistance Division (EAD)
2 Purpose of Training Review Greenhouse Gas Calculator designed to assist the P2 community in calculating green house gas reductions from P2 activities and strategies. * Review structure/design of the calculator, hypothetical examples, data sources & justifications. (* based on annual performance results) 2
3 Purpose of the GHG Calculator Calculates the GHG reductions associated with electricity conservation, green energy, fuel reduction and substitution, water conservation, and better management of hazardous materials and associated chemical processes. The calculator is tailored to the P2 program, its partners, and its grantees. 3
4 Purpose (continued) This tool was not not intended to calculate a program's GHG footprint, which is a measure of a program s entire GHG emissions for all operations, and it does not serve as a GHG inventory of past years' footprints. EPA's Climate Leaders, the World Resources Institute, and The Climate Registry offer recognized greenhouse gas inventories and guidance for this purpose. 4
5 P2 Performance Measurement In 2010 the P2 Program is responsible for reporting million metric tons of carbon dioxide equivalents (MMTC02e) reduced This supplements already existing performance measures of: Pounds of pollutants reduced, Gallons of water saved, and Dollars saved through the adoption of P2 practices. 5
6 Collaboration and Resources Office of Air and Radiation (OAR) Climate Protection Partnership Division Office of Resource Conservation and Recovery (ORCR) Office of Water (OW) WaterSense Program Energy STAR Program Climate Registry International Panel on Climate Change (IPCC) U.S. EPA Inventory of GHG Emission and Sinks 6
7 GHG Design Features Color coded tabs for each category of GHG reductions perform conversions into carbon dioxide equivalents (C02e) Aggregate tab converts into million metric tons of CO2e. Ability to aggregate GHG reductions from both individual projects and categories for GHG reductions. Illustrative Examples Cross reference to applicable GHG tools and models. (to be updated) 7
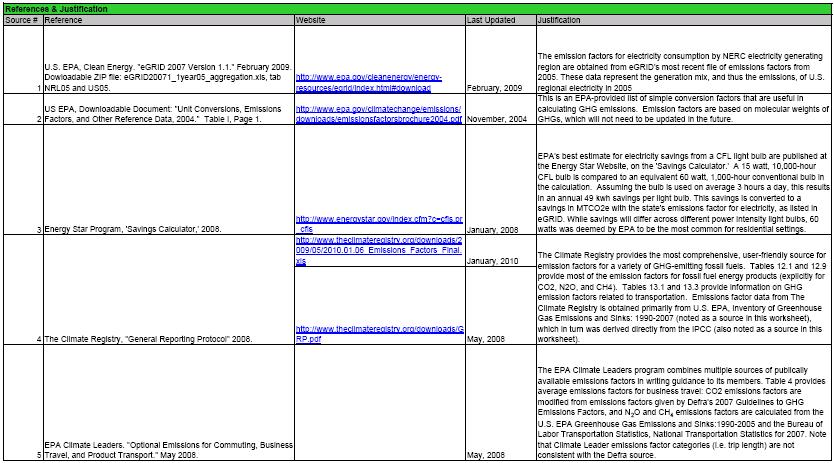
8 Transparency- References 8

9 Aggregate Feature: 9

10 Electricity Category for GHG Reductions 10
11 Electricity Tab (conversion factors) 11
12 Electricity Data Source/Justification We use the non-baseload output emissions rate for calculating reductions from electricity conservation. This rate is from egrid (EPA s Emission and Generation Resource Integrated Database). "Non-baseload" calculates the output emissions rate of GHG gases (CO2, CH4, and N2O) from combustion generators, weighted towards those that operate during peak demand. "Non-baseload" excludes emissions from nuclear, hydro, geothermal, solar, and wind generators because they operate at full capacity even during baseload (low) demand. Peak demand is what is affected by energy efficiency and clean energy projects. Non-baseload simulates which generation sources are displaced due to changes in energy demand, and accounts for seasonal and daily variations in energy use. Yet, it omits counting the 7-9% energy loss that occurs during transmission, making this emission factor ( MTCO2e/kWh for national) that much less than it would otherwise be ( MTCO2e /kwh for national). 12
13 Electricity Data Source We accepted skipping the additive emissions from transmission loss to harmonize better with EPA's National Marginal Carbon Emissions Factor (developed by the Climate Protection Partnership Division). In its current version, NMCEM is lower than the egrid non-baseload emissions factor ( MMTCE/Billion kwh for national, equal to MTCO2e/kWh for national). Our tool provides the national and multi-state grid versions of the nonbaseload output emissions rate. All states belong to multi-state grids, whose operators form the North American Electric Reliability Corporation (NERC). The output emission rate for a state reflects the fuel mix of the multi-state grid to which it belongs (not just its own fuel mix), because in-state consumers tap the fuel mix of the entire multi-state grid. We concluded this was the most realistic emissions factor for the state level. 13
 Region Representational")
14 North American Electric Reliability Corporation (NERC) Region Representational Map 14
15 Electricity Examples GQ Co. worked with a facility in North Carolina that conserved 10,000 kwh of electricity. Select NC from the state drop down box, enter 10,000 in C16, select kwh in drop down box tool calculates of MTC02e reductions. 15
16 Green Energy/Power Category for GHG Reductions In line with EPA's Green Power Partnership Program, this tool defines green power as: Sources producing electricity with an environmental profile superior to conventional power and producing no GHG emissions. This includes sources built since 1997 relying on solar, wind, geothermal (earth s heat), low-impact biomass, low-impact small hydro-electric sources, biodiesel, and fuel cells. This excludes large hydro sources and those built prior to
17 Green Power: Tool Assumptions Assumption: The tool calculates units of green power the same as it calculates units of electricity conservation. It counts them both as reductions, since both avoid GHG emissions from fossil fuel sources. The substitution of 1 kwh of fossil-fuel electricity for 1 kwh of renewable electricity is 1 kwh reduced, just as the conservation of 1 kwh of fossil fuel electricity is 1 kwh reduced. 17
18 Renewable Energy Certificates (RECs) (also known as green tags & green energy certificates) RECs represent indirect emission reductions, which facilities can use to neutralize their own indirect emissions for reporting purposes. Indirect emissions are produced offsite, and are linked to what a facility uses (like electricity). RECs are market-based instruments that facilitate buyerseller transactions on renewable electricity. A REC conveys the right to claim the reduction in GHG emissions to the holder of the REC. A REC does not convey the right to be supplied with green energy. A REC provides exclusive proof that one megawatt-hour (MWh) of renewable energy has been generated. 18

19 Renewable Energy Certificates (RECs) Validation/Verification We strongly encourage but do not require the purchase of green power products that are certified by an independent third party as a matter of best practice. 19

20 Green Energy Category for GHG Reductions 20
21 Green Energy Example GQ Co. installed 2 wind turbines in NY producing 10,000 kwh annually. Select NY from the drop down menu, enter 20,000 in C17, select kwh from the drop down menu. The tool calculates a MTC02e reductions. 21
22 Fuel Category for GHG Reductions GHG savings from reduced fuel use and/or fuel substitutions. Organized by carbon emission intensity----- dirtiest to cleanest. Ability to calculate savings from reduced vehicle and airplane miles. (User should either enter fuel reduced or vehicle/air miles avoided not BOTH). Ability to calculate savings from multiple flights/lengths. 22
23 Fuel (continued) Data Source is from the General Protocol of Climate Registry. The P2 Calculator includes GHG savings from emissions from carbon dioxide, methane and nitrous oxide where possible. End result maybe higher emission factors than those tools that only express C02. 23
24 Biofuels No consensus emission factor ---- not all biofuels are the same. The P2 Program used a middle of the road approach to recognize differences in various type of biofuels and strive for consistency. EPA s Office of Transportation and Quality Lifecycle GHG emission intensities of alterative fuels in relation to gasoline. 24

25 Fuel Category for GHG Reductions 25

26 Fuel Category (cont) 26

27 Fuel Category (cont) 27

28 Fuel Category (cont) 28

29 Biofuels Important Instructions to Remember: Applies when switching to a less intensive fuel source. For fuel substitution enter a positive value is for the discontinued fuel, and negative value for the substitute fuel, which will leave an accurate net positive value for GHG emissions reduced. 29
30 Example for Fuel GQ Co. replaced 20,000 gallons of distillate fuel oil in a turbine with 20,000 gallons of biodiesel. GQ replaced distillate fuel (discontinued fuel) a positive value of 20,000 gallons is entered in D14. Output is equal to MTCO2e reduced. Next, proceed to biodiesel column and enter a negative value of -20,000 in T14. (replacement fuel) Output value is equal to MTCO2e reduced Aggregate tab displays total reduction for this project as MTCO2e reduced. 30
31 Green Chemistry Total of 95 chemicals Combination of International Panel on Climate Change EPA s Final GHG reporting rule Chemical Abstract Service (CAS) and GWP provided Continual Work 31
32 Green Chemistry Emissions of gases are translated to carbon CO2 equivalents using global warming potentials. (GWP) GWP describes the ability of a unit of gas emitted in the present to trap heat over 100 years (time frame selected by the International Panel on Climate Change (IPCC) For example, methane (CH4) has a GWP of 21= releasing 1 pound of CH4 has the GWP of 21 pounds of carbon dioxide. 32
33 Global Warming Potentials Carbon dioxide CO2 1 Nitrous oxide N2O 310 HFC-23 CHF3 11,700 HFC-125 CHF2CF3 2,800 HFC-134a CH2FCF3 1,430 HFC-143a CH3CF3 1,300 HFC-152a CH3CHF2 140 HFC-227ea CF3CHFCF3 2,900 HFC-236fa CF3CH2CF3 6,300 PFC-14 CF4 6,500 PFC-116 C2F6 9,200 PFC-218 C3F8 7,000 Perfluorocyclobutane c-c4f8 8,700 33

34 Green Chemistry 34

35 Green Chemistry 35

36 Green Chemistry 36
37 Water Category for GHG reductions Significant energy is required to pump, treat, and transport water. The P2 Program relied on the survey-based water conversion factors used in the report Water and Sustainability: U.S. Electricity Consumption for Water Supply and Treatment Conserving heated water reduces GHG emissions more than conserving cold water. The tool relied on the EPA s WaterSense calculator for benefits of hot water conservation. 37
38 Water Conservation (factors) EPA s WaterSense Calculator accounts for the power source (natural gas or electricity) used to heat the water. Assigns the same factor to water heated by a renewable source that it assigns to non-heated water; Assigns a higher factor to water heated by natural gas and; Assigns the highest factor to water heated with conventional electricity. If users are not aware how water is heated but know that it is NOT from a renewable resource use the natural gas conversion as a default. 38
39 Contact Information OPPT, Pollution Prevention Program, Natalie Hummel OR OPPT, Pollution Prevention Program, Kathy Davey