A Review of the EcoGEM Modeling Approach as applied to Narragansett Bay, RI
|
|
|
- Joleen Robinson
- 5 years ago
- Views:
Transcription
1 A Review of the EcoGEM Modeling Approach as applied to Narragansett Bay, RI Jason Krumholz Jamie Vaudrey (UConn), Mark Brush (VIMS) Dave Ullman (URI) Long Island Sound Water Quality Workshop July 14 15, 215
2 Motivation, Rationale & Objectives As part of a NOAA Coastal Hypoxia Research Program project: Apply a novel, reduced complexity, parsimonious ecological model to predict hypoxia in Narragansett Bay. Implement within a fast running, coarse boxed scheme linked to a fine resolution hydrodynamic model. Simulate responses to nutrient reductions and climate change. Make the model available for direct use by managers.


3 linking ROMS to EcoGEM Highly resolved hydrodynamic model (ROMS) linked to a coarse boxed scheme. figure courtesy of Dave Ullman, URI
 is a 3 d array detailing exchange among all elements for each day.")
4 linking ROMS to EcoGEM Dye initialized in an element at 12am each day, allowed to mix for 24h, fate of dye yields exchange coefficient for the day. Gross Exchange Matrix (GEM) is a 3 d array detailing exchange among all elements for each day. time = : time = 24: figure courtesy of Dave Ullman, URI


")
5 linking ROMS to EcoGEM Structure of program: boxes are mixed at start of each day biology state variables are formulated as differential equations biology is allowed to integrate for 24 h (Runge Kutte 3,4 integration scheme) 1 / d many / d
 Flux to bottom ƒ[chl].")
6 Processes of the model & basis for formulations: Temp, Light, Boundary Conditions Chl, N, P, Salinity Productivity BZI Phytoplankton O 2 coupled stoichiometrically O 2 Physics Surface layer Atmospheric deposition N N P Photic zone heterotrophy ƒ(chl 2d ) Flux to bottom ƒ[chl]. mixing flushing Deep layer Land use N P Benthic C Benthic heterotrophy Denitrification ƒ(om,t) % Bottom sediment. only 17 constants and coefficients


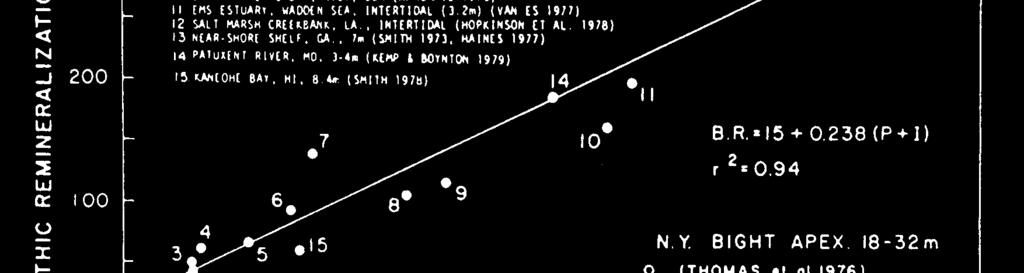
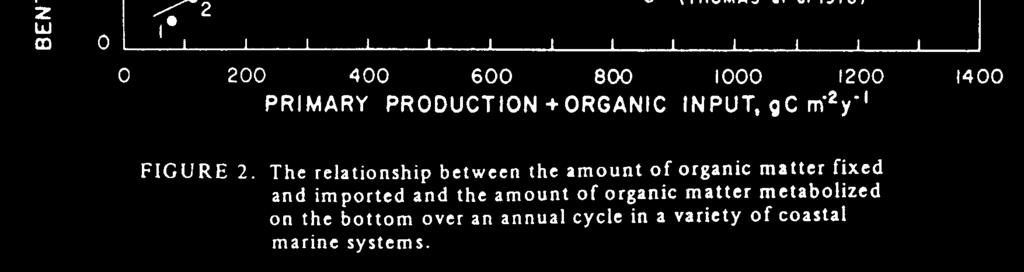
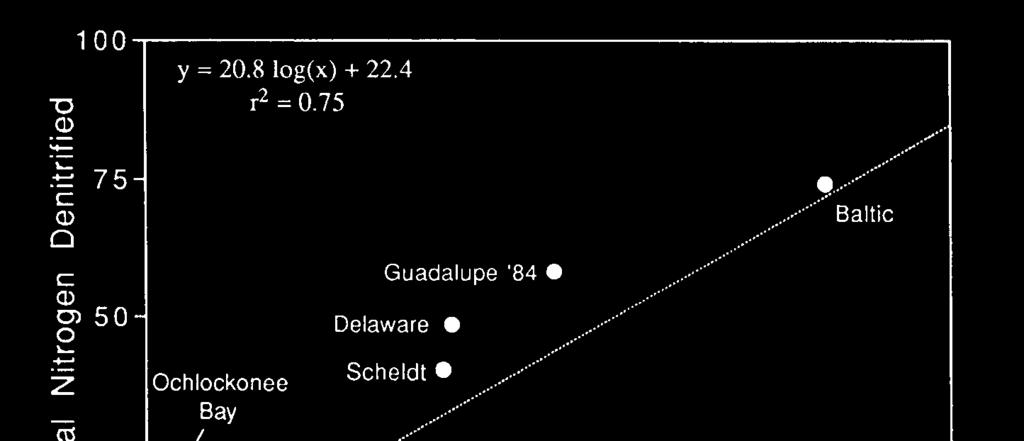
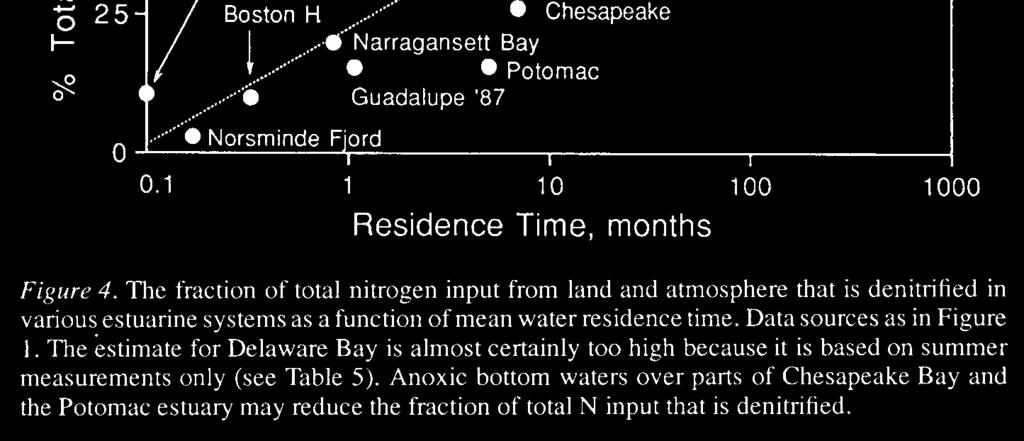
7 Ecology Empirical Formulation of Key Rate Processes robust across many systems Production: BZI with a modification for 2 layers Phytoplankton NPP: Primary Prod : Respiration Plankton Community Respiration: Benthic Remin. : Primary Prod Carbon Flux to Sediments: Denitrification. Denitrification:
8 forcing conditions Forcing Conditions ROMS forcing functions described by Dave Ullman light from Eppley Labs, Newport, RI wind from T.F. Green Airport for exchange of oxygen with the atmosphere precipitation from T.F. Green Airport for nutrient loads from wet and dry deposition water temperature from ROMS
 phytoplankton = surface buoy data at boundary oxygen = surface buoy data at boundary")
9 boundary conditions Boundary Conditions assume salt = ppt in rivers benthic carbon is not transferred among elements N and P = river concentration * flow (m 3 ) phytoplankton = surface buoy data at boundary oxygen = surface buoy data at boundary

10 boundary conditions N and P concentration from NBC data ( ) or WWTF data linear interpolation between dates for missing days flow from ROMS model, partitioned based on USGS river flow data

11 boundary conditions width of arrows indicate relative magnitude of volume input


12 skill Skill Assessment Data Discrepancy Model predicts a box wide, daily average. Field data are not strictly comparable: buoys a fixed location, 15 minute data (can get daily average) CTD surveys many locations, but infrequent (can get box wide average) nutrient and productivity surveys few locations, few dates A perfect skill is not expected and is highly unlikely.

13 skill Relative Operating Characteristic (ROC) curve used for evaluating models in many fields compares the hit rate to the false alarm rate >.5 = skilled; 1 = perfect skill evaluates all elements at once whole model thresholds every 5.4 ppt, yielding 2 evaluations hit rate = mod + obs + false alarm rate = mod + obs salinity ppt Mason, S. J., and N. E. Graham Conditional probabilities, relative operating characteristics, and relative operating levels. Weather and Forcasting 14: Sheng, Y. P., and T. Kim. 29. Skill assessment of an integrated modeling system for shallow coastal and estuarine ecosystems. J. Mar. Syst. 76:
14 skill Skill ROC, whole model >.5 = skilled; 1 = perfect skill 1 Oxygen - buoy data 1 Oxygen - CTD areal avg hit rate, <threshold O 2 buoy.89 hit rate, <threshold O 2 CTD.8.2 ROC area =.89; data n =637; threshold n =19.2 ROC area =.8; data n =27; threshold n = false alarm rate, <threshold Phytoplankton - buoy data false alarm rate, <threshold Nitrogen hit rate, >threshold Phyto buoy.69 hit rate, >threshold N survey.88.2 ROC area =.69; data n =3733; threshold n =19.2 ROC area =.88; data n =328; threshold n = false alarm rate, >threshold false alarm rate, >threshold
15 Skill by element (just O 2 shown) Oxygen (mg/l) Oxygen (mg/l) r (unitless) WS (unitless) r (unitless) WS (unitless) skill
16 skill Production (gc m -3 d -1 ) Water Column Production GPP NPP Element Number
17 skill Water Column Respiration Water Column Respiration (gc m -3 d -1 ) Wat Col Resp + delivery to benthos Water Column Resp Element Number
18 skill Sediment Rates blue = model green = core data only 25 data points, from 25 & 26 model data are from corresponding element on corresponding day 2 denitrification Sed N regeneration 6 Sed Oxygen demand 12 Sed P regeneration N (umol m -2 h -1 ) N (umol m -2 h -1 ) O2 (mg m -2 h -1 ) P (umol m -2 h -1 ) data from: Fulweiler, R.W., S.W. Nixon, B.A. Buckley, and S.L. Granger. 27. Reversal of the net dinitrogen gas flux in coastal marine sediments. Nature 448, no. 715:


19 field data responsive to N reductions hypoxia map: W. Prell, D. Murray, C. Deacutis Brown U.
20 gc / m 3 go 2 / m surface 26 7 N input bottom 26 7 N input Phytoplankton J/6 J/7 2 1 Oxygen J/6 J/7 surface 5% WWTF DIN bottom 5% WWTF DIN 1 gc m 3 = 24 ug / L Phyto 1% to 15% reduction Oxygen no change gn / m Nitrogen Nitrogen reduction J/6 J/7
21 Model predictions match field data collected after the 5% reduction was achieved in spring of 213. Candace Oviatt 1, Leslie Smith 2, Jason Krumholz 3, Catherine Coupland 1, Heather Stoffel 1, Aimee Keller 4, M. Conor McManus 1, and Laura Reed 1 (in review) Managed Nutrient Reduction Impacts on Nutrient Standing Stock Concentrations, Metabolism and Hypoxia in Narragansett Bay
22 gc / m 3 go 2 / m 3 gn / m surface 26 N input bottom 26 N input J/6 J/ Phytoplankton Oxygen J/6 J/7 Nitrogen J/6 J/7 surface 75% WWTF DIN bottom 75% WWTF DIN 1 gc m 3 = 24 ug / L Phyto 15% to 3% reduction Oxygen alleviation of hypoxia Nitrogen reduction N reduction can come from other sources, not just WWTF
23 Model suggests Larger N reductions needed before alleviation of hypoxia. Oxygen in the model is sensitive to N input.
24 What EcoGEM can and cannot do Cannot utilize new physical forcings to get at effects of changes in river flow or stratification need ROMS for this. 26 and 27 were good years in terms of differences so able to predict new years by bracketing. need to apply appropriate nutrient reduction, relative to 6 7 if boundary conditions for the year are available, use This model can be used to explore the effects of nutrient reductions and temperature changes associated with climate change.
25 What is needed to apply EcoGEM in LIS have water column field data (nutrients, chlorophyll, oxygen, light) buoy & survey benthic carbon productivity & respiration (buoy and incubations) wind, rain N & P loading estimates (Vaudrey et al., USGS, LISS, CTDEEP, NYSDEC) need physical exchange coefficients from ROMS or FVCOM (or other) benthic rates (flux of N, P, O 2 including denitrification) light (PAR) at surface, daily C to Chl (high variability)* C to N in sediment* * model can be run with default values, site specific data is useful