Conservation Authority Watershed Report Cards and the Chesapeake Bay Experience. December 2, 2013 SOSMART
|
|
|
- Maude Casey
- 5 years ago
- Views:
Transcription


1 Conservation Authority Watershed Report Cards and the Chesapeake Bay Experience December 2, 2013 SOSMART
2 Overview of Conservation Authority Watershed Report Cards Series launched March 18, 2013 to celebrate Canada Water Week All report cards are accessible via Conservation Ontario s website: Watershed Checkup
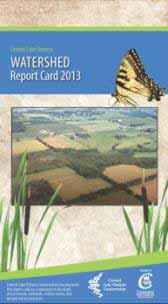
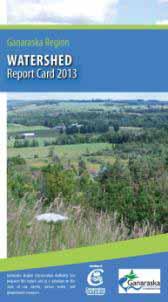
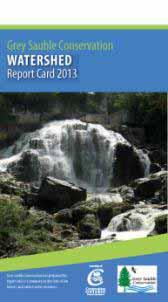
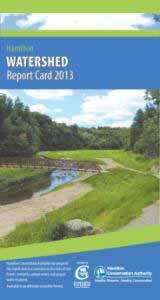
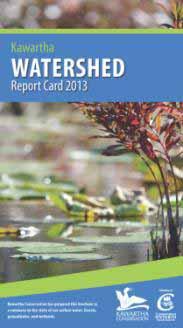
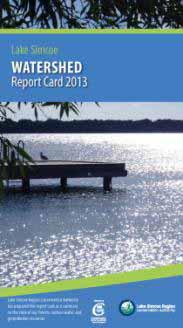
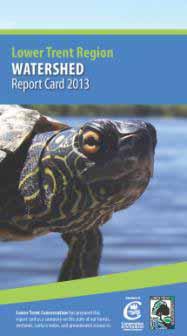
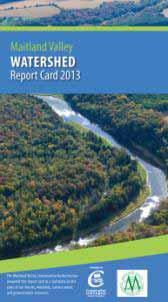
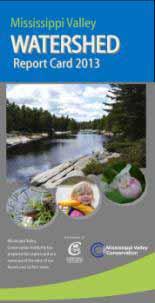
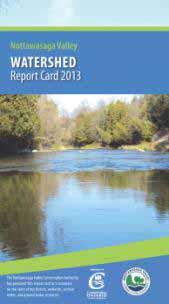
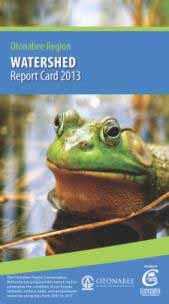
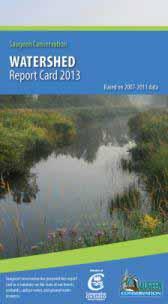
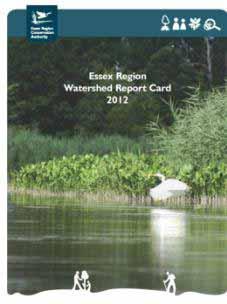
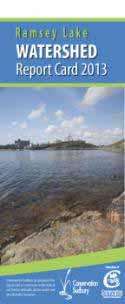
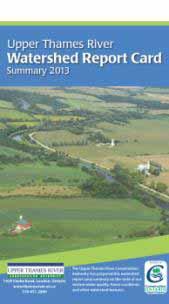
3 Watershed Report Cards Launch March 2013 Launched (26): Ausable Bayfield Cataraqui Conservation Halton Credit Valley Crowe Valley Essex Region Ganaraska Grey Sauble Hamilton Region Kawartha Lake Simcoe Long Point Lower Thames Lower Trent Maitland Mississippi Nickel North Bay Nottawasaga Otonabee Quinte Saugeen Toronto Upper Thames Central Lake Ontario St. Clair Niagara (+ 2: Kettle launched but didn t use template / RVCA launched new subwatershed rpt (used guidelines but not template) Coming Still (1): South Nation


4 Objectives: Position watershed scientific data in the context of human health Achieve recognized CA brand around Ontario watershed reporting Showcase local watershed information
5 Watershed Check Up Website


6 Report Cards Are Accessible CA websites almost all CAs with report cards have a dedicated web page. There is still some work that needs to be done in this area Report Cards can also be accessed through Conservation Ontario s website.
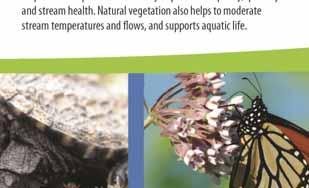
7 Watershed Check Up Website Benefits of Healthy Watersheds
8 Watershed Checkup Website Other Information Monitoring Information Resource Categories & Indicators Stewardship Counts What Can You Do? Why do watershed reporting?
9 Formats and Products So far, all but one CA used the exact template. The one that didn t, still used elements consistent with the others.
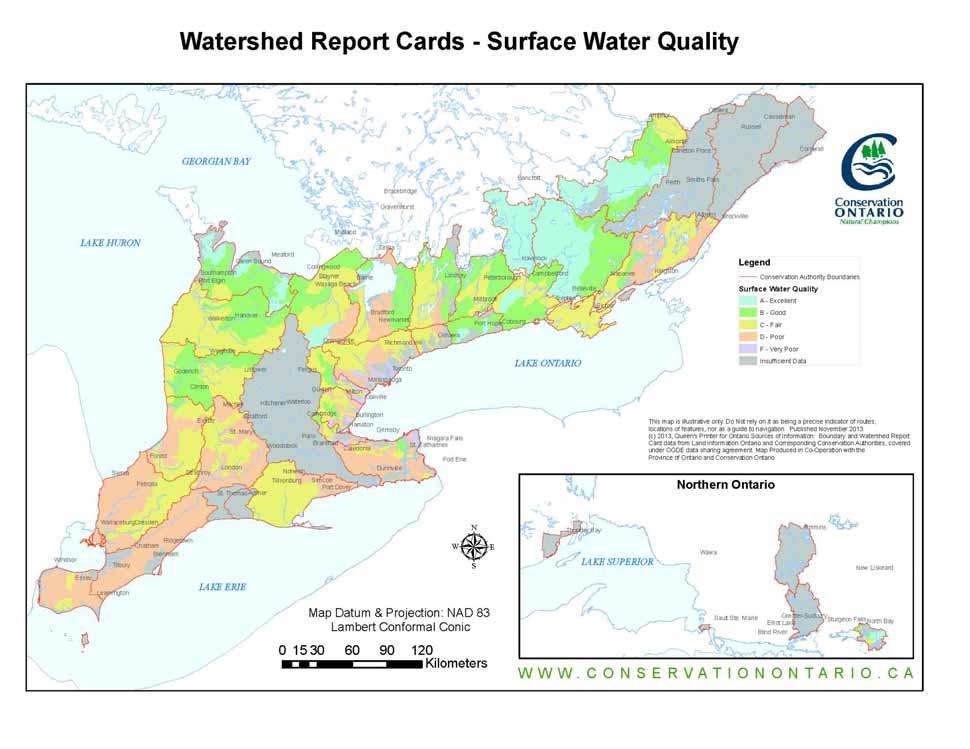
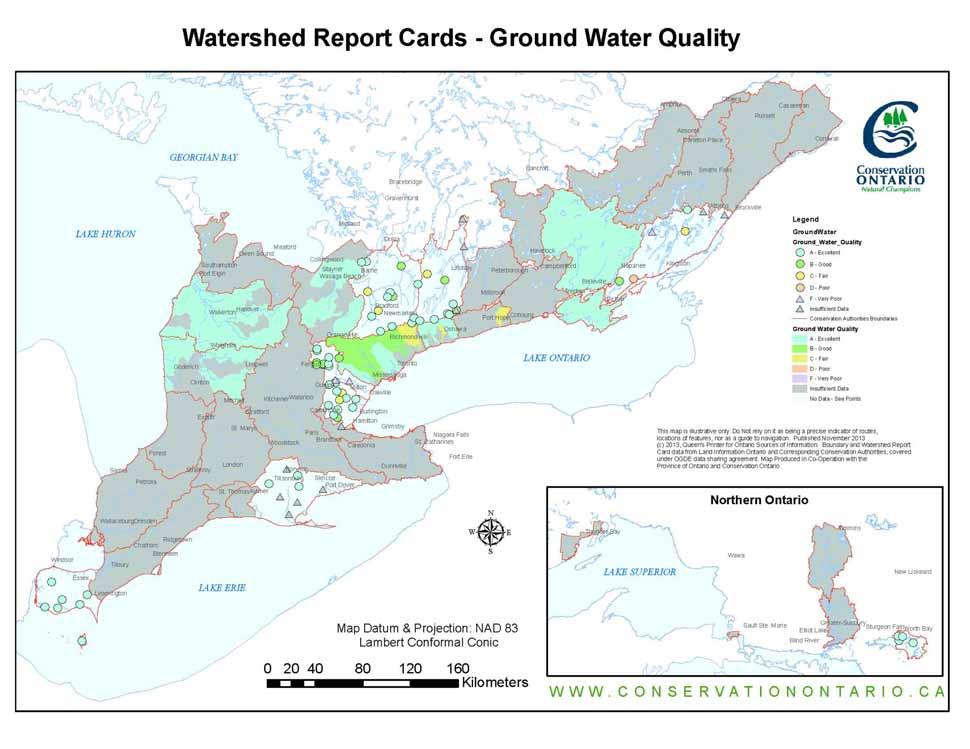
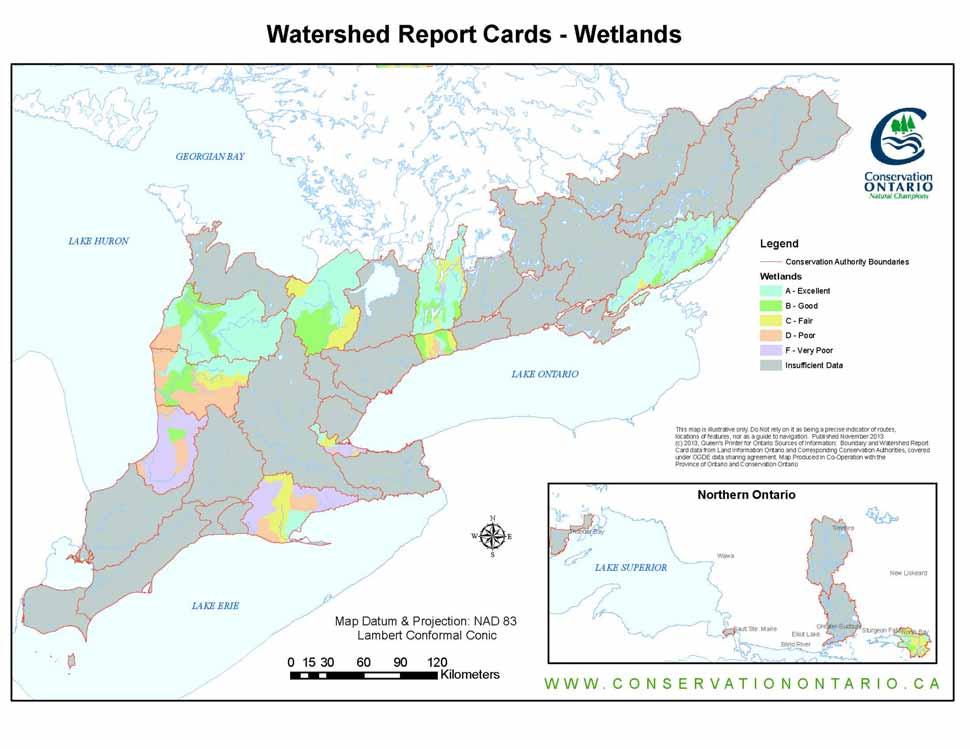
10 Format and Products Talk about the watershed Use standard grades Have a map to show where their watershed was located in Ontario Co-brand with CO

11 Format and Products Feature easy to read maps and text on all the resource categories Some roll up the watershed grade; some did not All use common category icons
12 Showcase what the CA is doing and tips for readers


13 Upper Thames Future thought for others - Trends

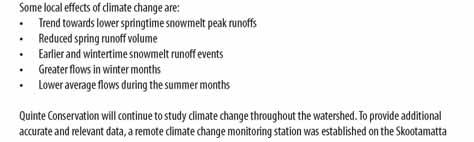
14 TRCA Quinte Additional Local Info Halton
15
16
17

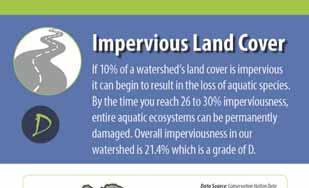
18 Resource Categories and Indicators Used environmental measures related to CA business / objectives: Protect and enhance water quality, preserve and manage natural areas Some CAs added: Storm water, Impervious Land Cover, Wetlands, Climate Change, Riparian & Lake Phosphorus levels


19 Chesapeake Bay 6 States 64,000 sq miles 11,684 miles of shoreline 150 major rivers & streams 17 million population
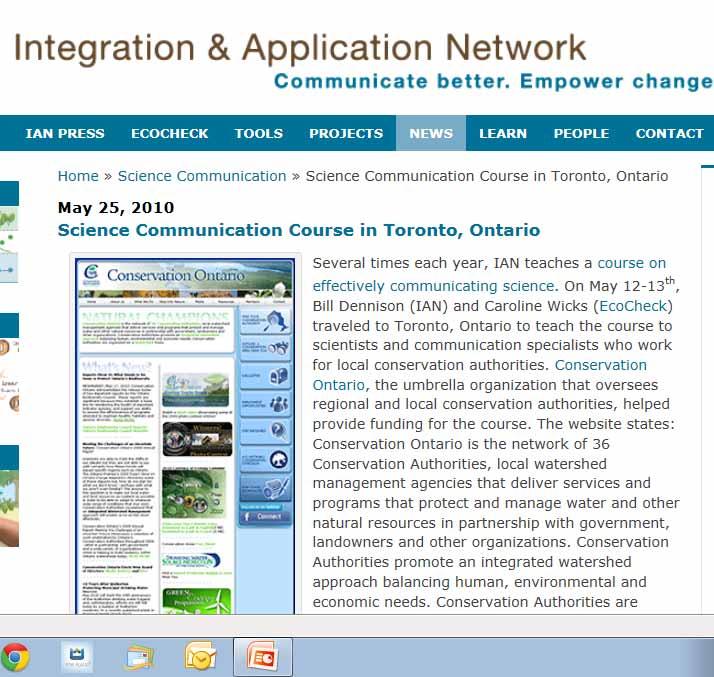
20 Chesapeake Bay Partnerships IAN Integration & Application Network (IAN) undertakes environmental assessment and science communication of restoration projects University of UM Provides technical Maryland assistance and training opportunities for CBP activities and undertake innovative approaches in restoration ecology. Chesapeake Bay Program The Chesapeake Bay Program is a regional partnership that leads & directs restoration and protection
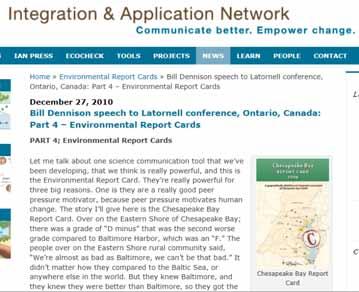
21 IAN produces an array of annual ecohealth report cards. The Chesapeake Bay report card has been produced annually (since 2006), with new indicators, analyses and web features added each year.
22 Our experience with this group
23 Aims to inform citizens on the progress Chesapeake Bay is making toward becoming a healthy ecosystem
24 Annual report; 5 Regions; 6 indicators
25 What are they tracking? There are three water quality indicators (chlorophyll a, dissolved oxygen, and water clarity) three biotic indicators (aquatic grasses, Benthic Index of Biotic Integrity, and Phytoplankton Index of Biotic Integrity). Other indicators, especially those related to fish and shellfish, will be added to the report card in the future as suitable data becomes available.
26

27 Great Online Tools
28
29
30
31


32 Strong Partnerships led by decision-makers The Chesapeake Bay Program is a partnership run by the Environmental Protection Agency, which includes federal agencies and academic partners is located at the mouth of the Severn River in the Eastport section of Annapolis on the western shore of Chesapeake Bay.
33
34 Tracks all sources of funding related to stated goals
35 Some Comparisons Same goals: Provide information for good decision-making Engage local residents and decision-makers Encourage more investment and partnerships Differences: CAs More Complex 36 Report Cards / 36 different agencies (CAs) Harder to reach consistency (messaging, approach) CAs have additional source protection resources to mine and connect to the watershed report cards
36 We Have a Lot to Learn from Chesapeake Bay Experience Online data management Online tools and communication Trend reporting Building the Partnerships that make things happen like the Chesapeake Bay Program (combines government & nongovernment) Will take additional resources & expertise
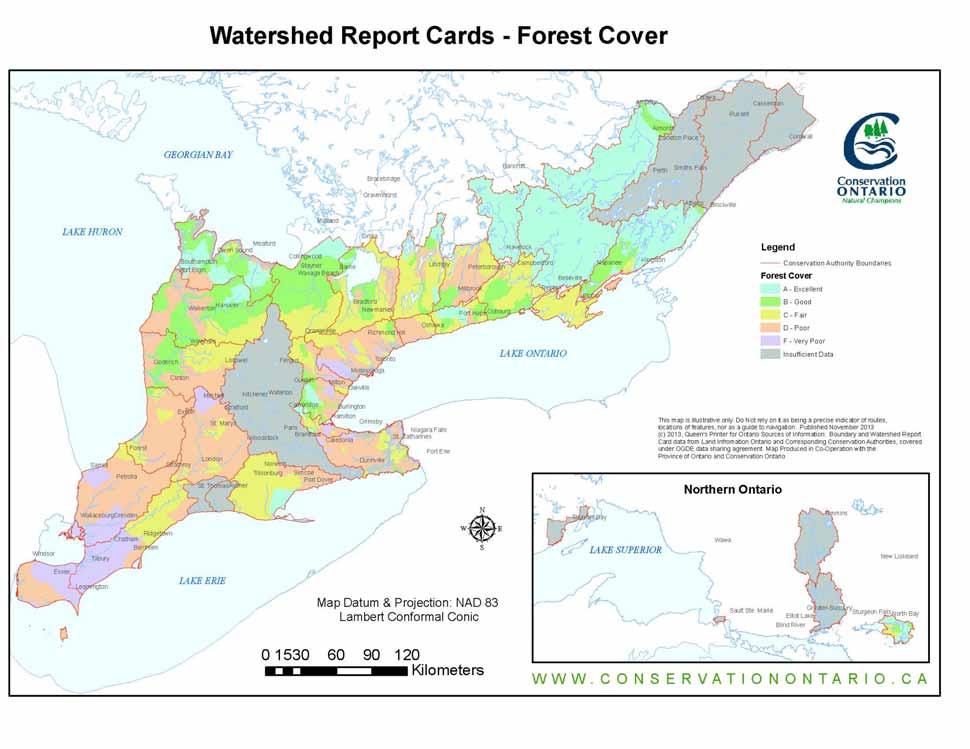
37 Next Steps for Conservation Authorities WRC subcommittees: Surface Water Forest Conditions & Wetlands Groundwater Communications NEW: Data Working Group Provincial Story
38
39
40
41