ERIC D. STEIN SOUTHERN CALIFORNIA COASTAL WATER RESEARCH PROJECT
|
|
|
- Jesse Lee
- 5 years ago
- Views:
Transcription


1 Effect of Sea Level Rise on Coastal Wetlands ERIC D. STEIN SOUTHERN CALIFORNIA COASTAL WATER RESEARCH PROJECT


2 Sea level rise presents substantial challenges to managing wetlands and other coastal resources Lots of uncertainty Emerging science and tools to help address the issue There is urgency. But there is time
3 Projected Sea Level Rise Time Period South of Cape Mendocino in in in.
4 Sea Level Rise PLUS!! Maximum Potential Inundation Elevation (!) 5.5m 18 feet Episodic Risk Factors 3 m 10 feet Sea Level Today Long Term Risk Factors + ENSO + PDO 1m 0m California Today slide adapted by Sarah Giddings from Bill O Reilly and Reinhard Flick California in 2100+
5 But Wait.... There s More! IPCC (2007) estimates of the primary contributions to global mean sea-level change for 1961 to 2003 (blue) and for 1993 to 2003 (brown)

6 New models account for accelerated contributions from melting glaciers Additional feet of SLR by 2100 Reduced mass less gravitational pull on oceans Increase by an additional 2 3 feet Total additional SLR by 2100 of 4 6 feet

7 Observed and Projected Tidal Floods NOAA National Center for Environnemental Information


8 Spread of Spartina into former pickleweed areas at Mugu Subsidence and inundation at Seal Beach Pickleweed dieback at Carpinteria


9 Expected Impacts from SLR and Storms Accelerated beach erosion rates Greater incidence of cliff failures Landwards translation of coastal flooding & inundation Beach/shore safety compromised Saltwater intrusion into coastal aquifers Impacts to navigation conditions


10 What are the Implications of SLR for S. Ca. Coastal Wetlands?


11 San Dieguito Source: USGS

12 Santa Barbara 0 Ventura 25 Los Angeles 50 Orange 100 Km San Diego GoogleEarth


13 Santa Barbara 0 Ventura Small Creek 25 Los Angeles 50 Small Lagoon Orange 100 Km Large Perennially Open Lagoon Large and/or Fragmented River Valley Estuary San Diego Intermittently Open Estuary Open Bay/ Harbor GoogleEarth

14 Assessing Regional Vulnerability What is the relative vulnerability of coastal wetlands to effects of sea level rise? How does vulnerability vary by wetland type or location? How can management actions affect vulnerability? Comprehensive = can apply to all systems Consistent application across all systems Accommodate varying data availability Clear and easy to communicate Transparent documentation of uncertainty Conducive to evaluating management options Provides a starting point for more in depth study

15 Hypsometric Curve Elevation Capital z* Mudflat Transitional upland High marsh Intertidal marsh Mudflat Subtidal Area km 2

16 Hypsometric Curve Elevation Capital z* Sea level rise Marsh accretion Mudflat Transitional upland High marsh Intertidal marsh Mudflat Subtidal Area km 2


17 Hypsometric Curve Transitional upland Elevation Capital z* Subtidal Mudflat High marsh Intertidal marsh Mudflat Subtidal Area km 2
18 Our Approach to Assessing Vulnerability
19 Our Approach to Assessing Vulnerability


20 Our Approach to Assessing Vulnerability
21 Accretion Rates Summary of Empirical Observation Modeled Warrick et al 2004


22 Mouth Dynamics
23 Estimating Mouth Closure Rate Daily Wave Data (Height, Period) Daily Tidal Data (Tidal Range) Daily Streamflow Data Wave Power P w = 0.5ρgH s C Tidal Power P t = (γh T )/b * (Ω/T+ Q) Closure Index S= P w /P t Increased water levels due to Closure Estimate increase in closure rate based on sea level rise Estimate additional inundation based on new closure rate Based on Behrens et al. 2015
24 Estimated Additional Inundation Based on Mouth Closure Δ Likelihood of Δ Lagoonal Δ Likelihood of Δ Lagoonal Closure (%) water level Closure (%) water level Archetype (m) (m) Small Creek +13% % 1.38 Small Lagoon +8% % 1.55 Intermittently Open Estuary +3% % 1.41 Large Perennially Open Lagoon Changes calculated using 2016 as the baseline. +7% % 1.38

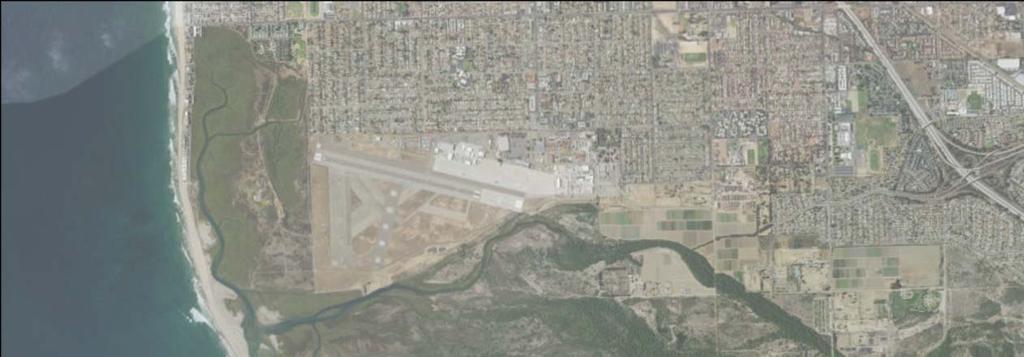
25 Estimating Area Available for Transgression 1.5 m SLR Extent NERR Visitor Center and Parking Lot Residential Airport Agricultural Lands Upland Open Space
26 Estimating Habitat Change Using Hypsometric Curves Sea level rise Low and high marsh accretion Changes to mouth dynamics Opportunities for transgression Z* Tijuana Estuary Area (km 2 ) Current z*=( z MSL/MHHW MSL)
27 Habitat Elevation Inundation Relationships Plant species Elevation marsh zones


28 Footprint Marsh Zone Current 2050 Δ Proportion Subtidal 9.1% 17.7% 8.6% Intertidal Mudflat 9.7% 3.5% 6.2% Low 1.3% 11.2% 9.9% Mid 13.5% 50.9% 37.4% High 66.4% 16.7% 49.7% TOTAL 111.8% Vulnerability Score: (111.8% Total / 183% Max )*10 =


29 Overall Regional Vulnerability
30 Vulnerability by Archetype


31 Vulnerability by Subregion

32 So What Are Our Options? Facilitate Migration Allow or facilitate passive marsh migration Grade areas adjacent to wetlands to increase opportunity for migration Construct passive levees to facilitate marsh realignment Relocation or abandon adjacent infrastructure or development Manage Water Levels Alter structure and/or management of mouth of lagoons Active pumping or tide gates to control water elevations Allow wetland to convert to deep water habitat Reconnecting currently fragmented systems to improve water flow Promote Accretion Thin layer sediment augmentation Sediment trapping Sediment re use to raise marsh elevations Malibu Lagoon
33 Future Research Directions Build on this initial screening level analysis Increase sophistication and confidence in models Better prediction of mouth dynamics Improved consideration of migration into transition zones Expanded consideration of watershed inputs Better understanding of response of biological communities Investigate implications of management actions Explore different trajectories of response based on management NOAA UCI project on beneficial use of sediment to promote marsh accretion
34


35 Sediment Augmentation Options Tidal Marsh Grade for Additional Tidal Marsh
36 Take Home Messages Sea level rise presents substantial challenges to managing wetlands and other coastal resources Lots of uncertainty Emerging science and tools to help address the issue There is urgency. But there is time Monitoring and assessment can help fill key knowledge gaps Opportunities to develop innovative strategies and novel approaches Partnerships are key


37 Thank You Eric Stein