FALL ACOUSTIC AUDIT - IMMISSION REPORT Dufferin Wind Power Project Township of Melancthon, Ontario
|
|
|
- Coral Burke
- 5 years ago
- Views:
Transcription
1 FALL ACOUSTIC AUDIT - IMMISSION REPORT Dufferin Wind Power Project Township of Melancthon, Ontario Prepared for: Dufferin Wind Power Inc. 161 Bay Street, Suite 4550 Toronto, Ontario M5J 2S4 Prepared by Iouri Basmanov Digitally signed by Iouri Basmanov DN: cn=iouri Basmanov, o=hgc Engineering, ou, =ibasmanov@hgcengineerin g.com, c=ca Date: :52:14-05'00' Iouri Basmanov, EIT Reviewed by Ian Bonsma Digitally signed by Ian Bonsma DN: cn=ian Bonsma, o=hgc Engineering, ou, =ibonsma@hgcengineerin g.com, c=ca Date: :58:00-05'00' Ian R. Bonsma, PEng February 28, 2017
2 VERSION CONTROL Version Date Version Description 1 February 29, 2016 Interim report 2 January 16, 2017 Updated report, including complete data set 3 February 28, 2017 Revised report based on comments from the MOECC ii
3 EXECUTIVE SUMMARY Howe Gastmeier Chapnik Limited ( HGC Engineering ) was retained by Dufferin Wind Power Inc. to complete an Acoustic Immission Audit of the Dufferin Wind Power Project ( Wind Project ) in the Township of Melancthon. The project includes 49 General Electric wind turbine generators, with seven rated generation capacities from to 2.75 MW. The acoustic immission audit is required as a condition of Renewable Energy Approval number BPH8 issued by the Ontario Ministry of the Environment and Climate Change ( MOECC ) on June 10, 2013 and amended on October 9, HGC Engineering has assessed the acoustic impact against the acoustic criteria of the MOECC and in accordance with the requirements of the MOECC s Compliance Protocol for Wind Turbine Noise. A report titled Fall 2015 Acoustic Audit Immission Report was submitted by HGC Engineering to the Dufferin Wind Power Project on February 29, That report provided an interim update on the status of the data collection and analysis to meet a reporting requirement for the project. The project team committed to ongoing data collection until the required data points were obtained. The report contained herein represents a complete data set. This report represents the 2015 and 2016 fall measurement campaigns between October 1, 2015 and January 12, 2016 and October 28 and December 8, 2016, respectively. The sound level measurements and analysis, as performed in accordance with the MOECC s Compliance Protocol for Wind Turbine Noise, indicate that the project meets the applicable sound level limits at the considered receptors. Details of the measurements and analysis are provided herein. iii
4 TABLE OF CONTENTS EXECUTIVE SUMMARY... iii 1 INTRODUCTION POINTS OF RECEPTION INSTRUMENTATION ASSESSMENT CRITERIA METHODOLOGY TONALITY ASSESSMENT MEASUREMENTS AND RESULTS CONCLUSIONS REFERENCES Figure 1a to 1e: Sound Level Monitor Locations Figure 2a and 2b: Wind Roses for Receptor VL93 Figure 3a and 3b: Wind Roses for Receptor PR49 Figure 4a and 4b: Wind Roses for Receptor PVL19 Figure 5a and 5b: Wind Roses for Receptor PR6 Figure 6a and 6b: Wind Roses for Receptor NP177 Figures 7a and 7b: Acoustic Audit Results for Receptor VL93 Figures 8a and 8b: Acoustic Audit Results for Receptor PR49 Figures 9a and 9b: Acoustic Audit Results for Receptor PVL19 Figures 10a and 10b: Acoustic Audit Results for Receptor PR6 Figures 11a and 11b: Acoustic Audit Results for Receptor NP177 APPENDIX A Receptor Selection Information APPENDIX B Receptor Location APPENDIX C Instrument Calibration Certificates APPENDIX D Statements of Operation iv
5 Dufferin Wind Power Inc. Page 1 Dufferin Wind Power Project, Fall Immission Audit February 28, INTRODUCTION Howe Gastmeier Chapnik Limited ( HGC Engineering ) was retained by Dufferin Wind Power Inc. to complete an Acoustic Audit Immission of the Dufferin Wind Energy Project. The project is located in Dufferin County, Ontario and consists of 49 General Electric wind turbine generators of various generation capabilities. The Audit is required as part of the Renewable Energy Approval ( REA ) number BPH8 [1] issued for the project by the Ontario Ministry of the Environment and Climate Change ( MOECC ) on June 10, 2013 and amended on October 9, Specifically, this report summarizes measurements that were conducted during the fall measurement campaigns of 2015 and 2016 in order to satisfy the second of two seasonal audits required under Condition E of the REA. 2 POINTS OF RECEPTION The Acoustic Assessment Report, prepared by Dillon Consulting Limited [2], provided sound level predictions for receptors within 1500 metres of the project wind turbine generators. The condition in the REA requires that measurements be completed at five different points of reception which are selected utilizing the following criteria: - The point of reception should represent the location of the greatest predicted noise impact. - The point of reception should be located in the direction of prevailing winds from the facility. Receptor locations VL93, PR49, PVL19, PR6, and NP177 were selected based on their downwind locations, predicted sound levels, and consultation with the land owners. Efforts were also made to select monitoring locations throughout the entire project area, to represent the largest number of receptors. HGC Engineering developed an acoustic predictive model of the site to determine the sound levels at the sound level monitoring locations. The predicted sound levels at the monitoring locations and the predicted sound levels from the Acoustic Assessment Report for the receptor
6 Dufferin Wind Power Inc. Page 2 Dufferin Wind Power Project, Fall Immission Audit February 28, 2017 locations, along with the location UTM coordinates are presented in Table 1. The monitoring locations are shown in Figures 1a to 1e. Table 1: Predicted Sound Levels and UTM Coordinates of Selected Locations Location Easting Northing Predicted Sound Level [dba] VL93 PR49 PVL19 PR6 NP177 Receptor Monitoring Location Receptor Monitoring Location Receptor Monitoring Location Receptor Monitoring Location Receptor Monitoring Location The location selection summary and historical wind rose for the area are provided in Appendix A. Photos of the selected monitoring locations are provided in Appendix B. A number of additional receptors were approached for use as sound level monitoring locations for the audit, however, permission for use was not granted. Receptor VL93, is an agricultural field located centrally within the project, with the closest turbine, T25 (T4.06), located at a distance of approximately 630 metres. The sound level meter was located in the largest gap between the trees to minimize wind induced foliage noise. PR49 is a two storey home located on the west side of the project, with the closest wind turbine. T40 (T1.01), located at a distance of approximately 540 metres. The sound level meter was located in the shortest section of the backyard treeline to minimize wind induced foliage noise while accommodating the resident s access requirements. This receptor is a participating receptor and is intended to represent non-participating receptors NP83 and VL77. PVL19 is a vacant lot on the north-east side of the project used for storage of farm equipment, with the closest turbine, T4 (T3.10), located at a distance of approximately 575 metres. The
7 Dufferin Wind Power Inc. Page 3 Dufferin Wind Power Project, Fall Immission Audit February 28, 2017 sound level meter was located in the north-east corner of the storage lot to minimize landowner interference. There was minimal foliage around the sound level meter. This receptor location is participating and is intended to represent non-participating receptor NP190. PR6 is a single storey home located on the northwest side of the project with the closest turbine, T37 (T1.04), located at a distance of approximately 540 metres. The sound level meter was located in the shortest section of the backyard treeline to minimize wind induced foliage noise while accommodating the resident s access requirements. This receptor is a participating location and is intended to represent non-participating receptors VL6, VL13, NP71, and NP72. NP177 is a one storey home located on the south-east side of the project with the closest turbine, T18 (T4.13), located at a distance of approximately 660 metres. The sound level meter was located equidistant between the house and the treeline, to minimize both wind induced foliage noise and reflections from the buildings. 3 INSTRUMENTATION The MOECC document, Compliance Protocol for Wind Turbine Noise Guidelines for Acoustic Assessment and Measurement [3] provides requirements for instrumentation for Acoustical Audits of wind energy projects. Instrumentation used for this acoustic audit satisfies the requirements provided in the Compliance Protocol. Audio frequency sound level measurements were performed using Svantek 977, Svantek 971, and Norsonic Precision Sound Analyser Nor140, integrating sound level meters connected to their respective ½ microphones. Each microphone was set at 4.5 metres above the local grade, and equipped with a 175 mm diameter windscreen to minimize wind-induced microphone selfnoise. The energy-equivalent average sound level, denoted LEQ, and also the L90 sound level, the level exceeded 90% of the time during the measurement, were recorded by the instrumentation. The L90 sound level is commonly used to represent the background or steady-state sound level because it minimizes transient sounds such as occasional human voices, brief animal activity, and car pass-bys. The audio-frequency measurements are presented as A-weighted sound levels
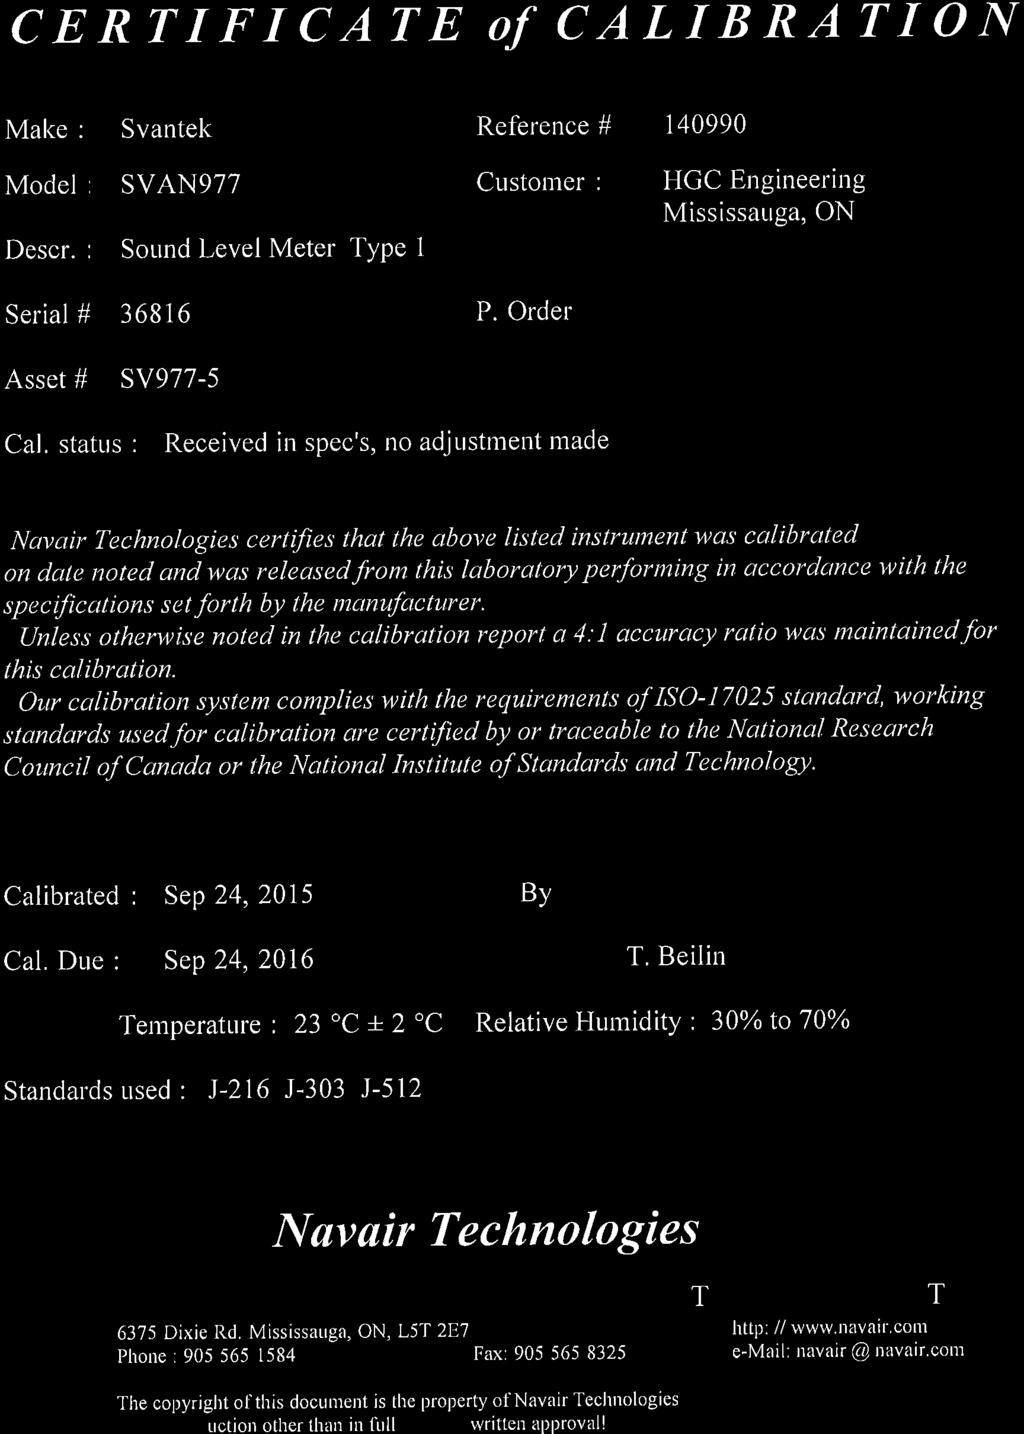
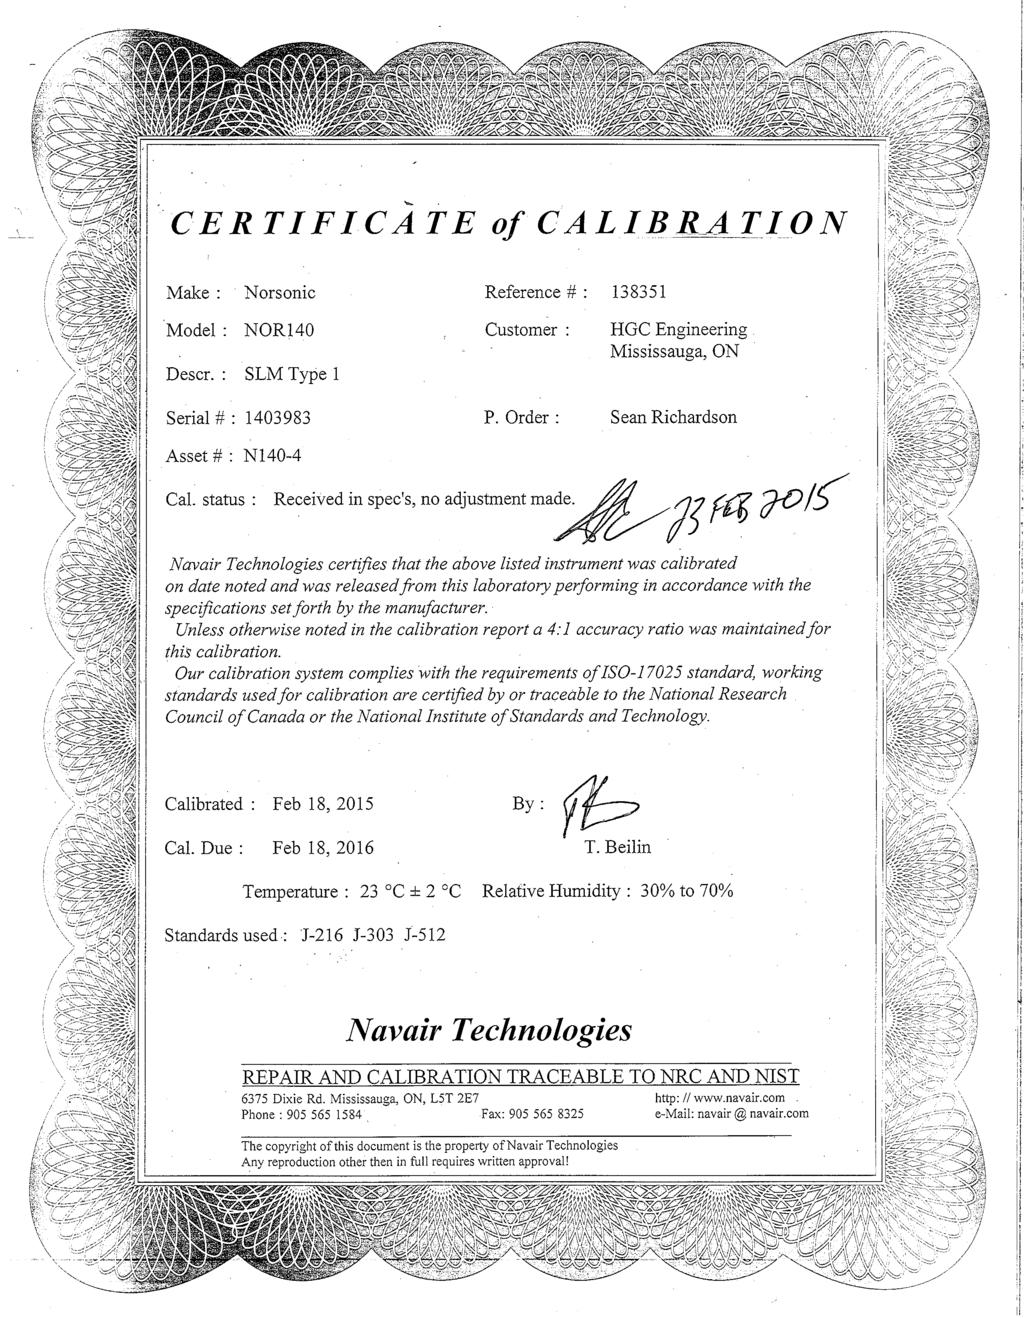
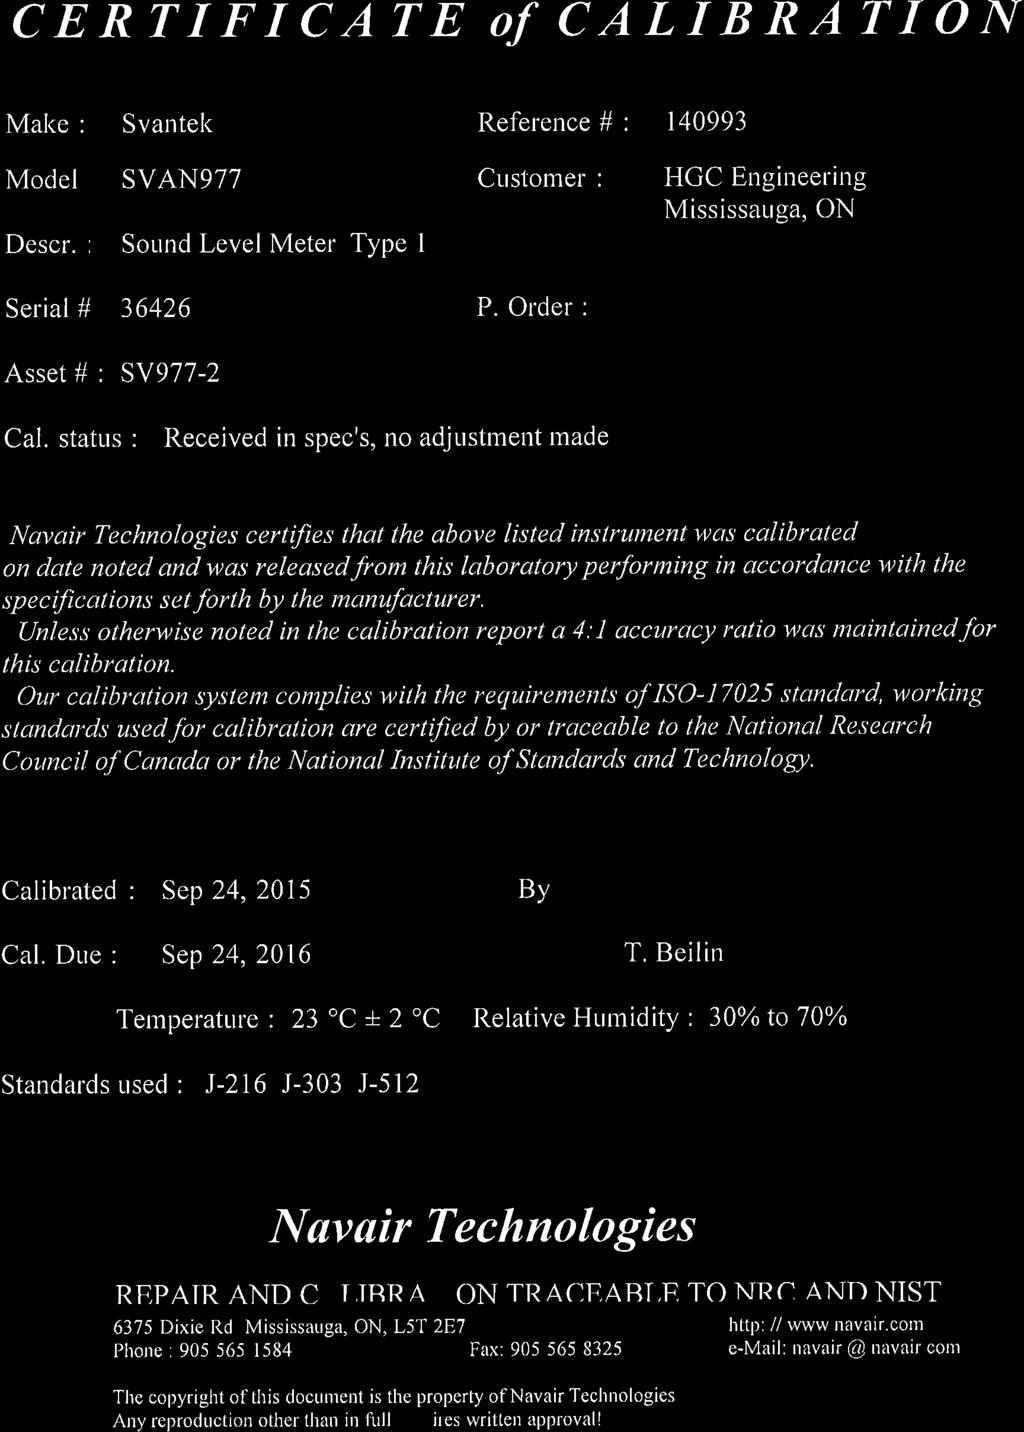
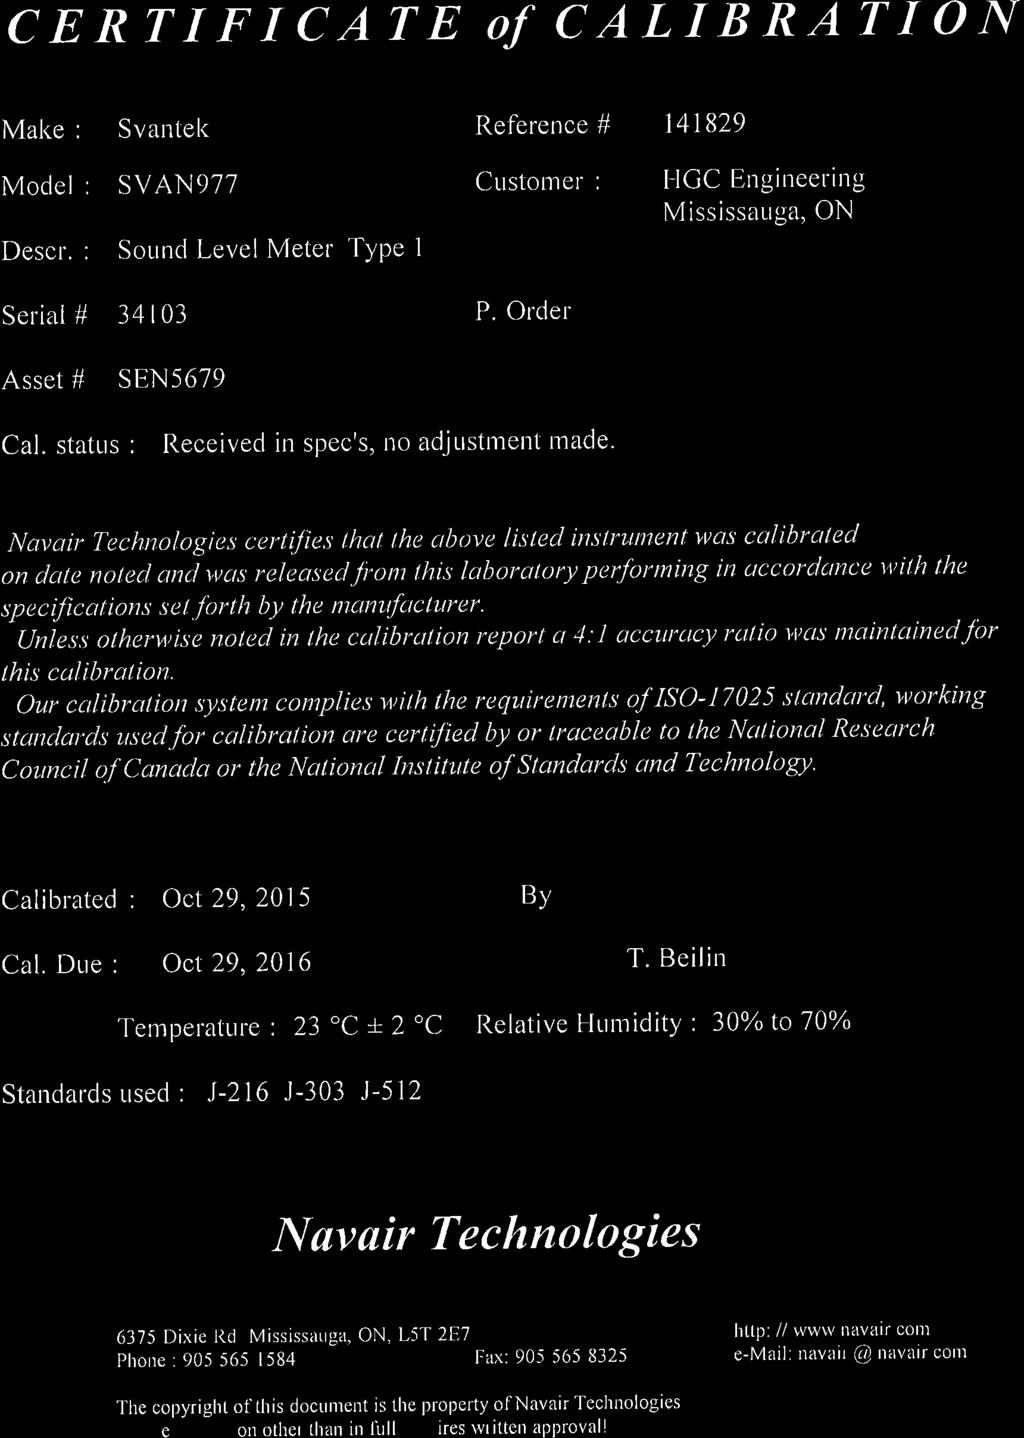
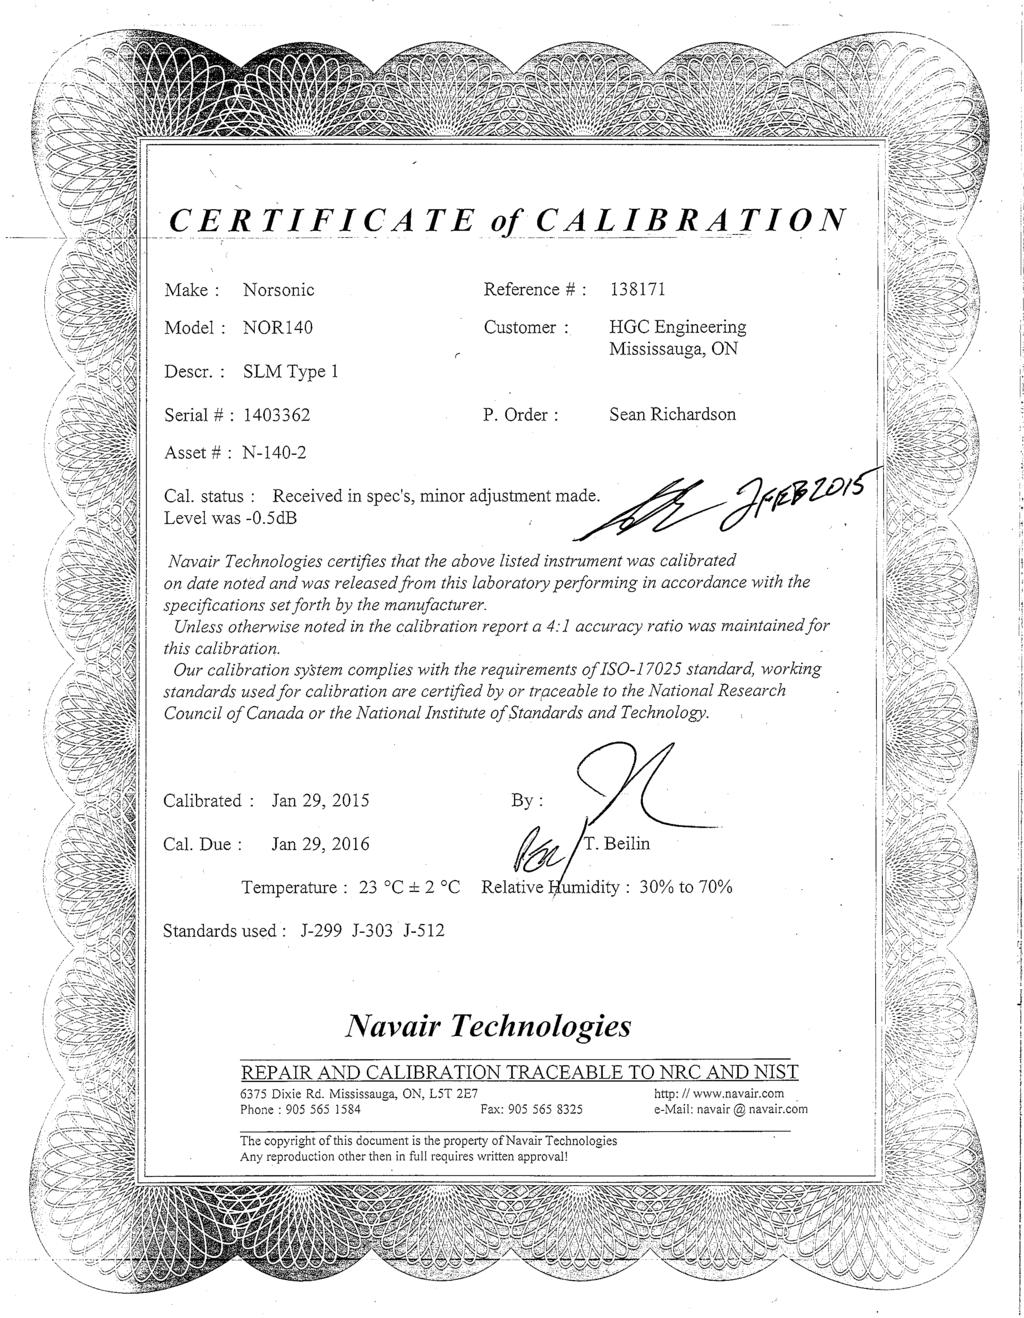
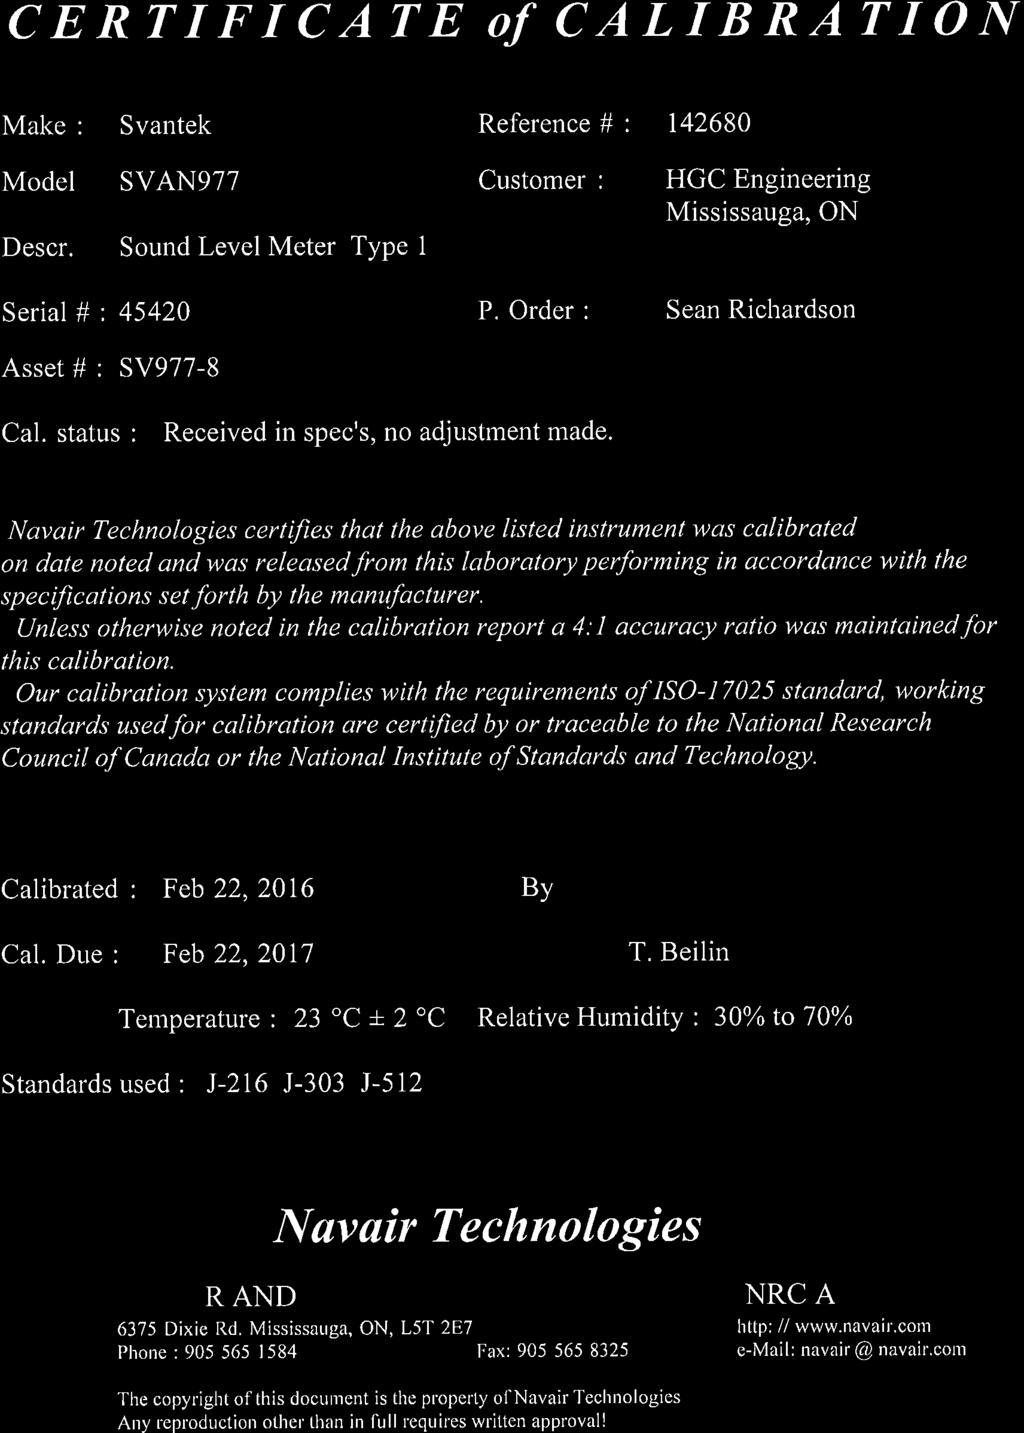
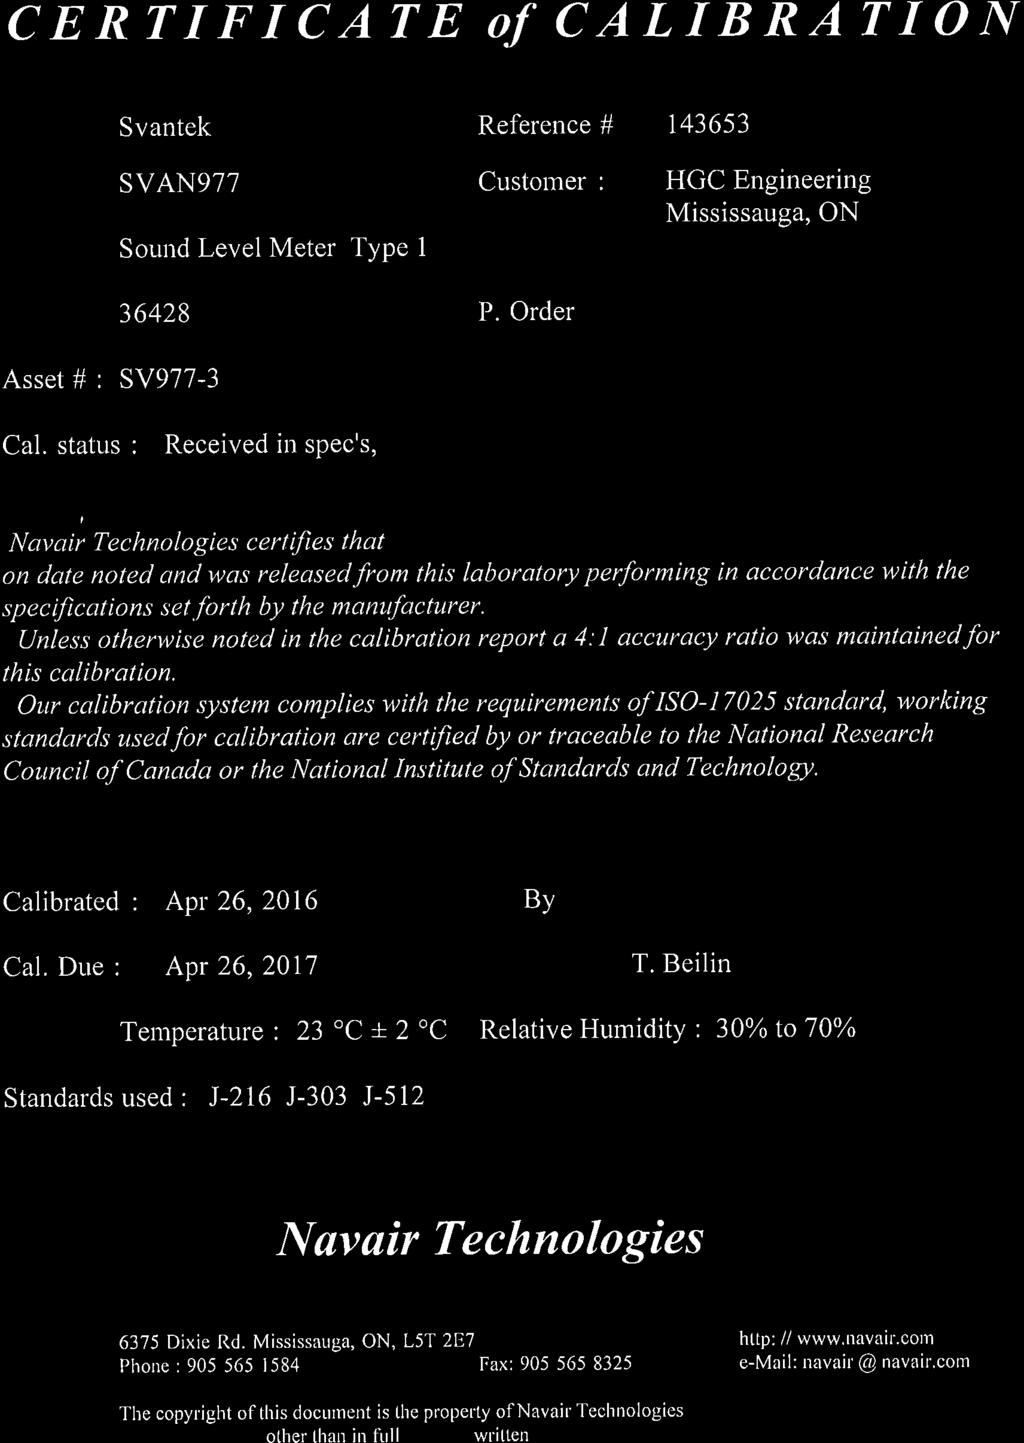
8 Dufferin Wind Power Inc. Page 4 Dufferin Wind Power Project, Fall Immission Audit February 28, 2017 as they are intended to represent the loudness of sounds as perceived by the human ear. The overall audio-frequency sound level monitoring results are summarized in this report. In addition to the acoustic instrumentation, five meteorological instruments were used. A ground level weather station was deployed to collect temperature, humidity, and precipitation at NP177. NRG anemometers and wind vanes were used to collect 10 metre height wind speed and direction at each of the five receptor locations. The various instruments deployed by HGC Engineering are summarized in Tables 2a and 2b below, and their relative locations are shown in Figures 1a to 1e. Due to various instrumentation demands and calibration schedules, a number of sound level meters were utilized throughout the campaign. All equipment was within its annual calibration, and the calibration certificates are included in Appendix C.
9 Dufferin Wind Power Inc. Page 5 Dufferin Wind Power Project, Fall Immission Audit February 28, 2017 Table 2a: Sound Level Measurement Instrumentation, Fall 2015 Receptor Instrumentation Make and Model Serial Number Svantek 977 Sound Level Meter VL93 Norsonic Sound Level Meter Svantek 977 Sound Level Meter NRG#40 Anemometer connected to a Campbell Scientific Data-Logger Svantek 977 Sound Level Meter PR49 Svantek 971 Sound Level Meter NRG#40 Anemometer connected to a Campbell Scientific Data-Logger PVL19 Svantek 971 Sound Level Meter NRG#40 Anemometer connected to a Campbell Scientific Data-Logger Svantek 977 Sound Level Meter Norsonic Sound Level Meter PR6 Svantek 977 Sound Level Meter Norsonic Sound Level Meter NRG#40 Anemometer connected to a Campbell Scientific Data-Logger Svantek 971 Sound Level Meter Norsonic Sound Level Meter NP177 Svantek 977 Sound Level Meter NRG#40 Anemometer connected to an APRS Weather Station APRS Weather Station A4530 Table 2b: Sound Level Measurement Instrumentation, Fall 2016 Receptor Instrumentation Make and Model Serial Number PR49 NP177 Norsonic Sound Level Meter NRG#40 Anemometer connected to a Campbell Scientific Data-Logger Svantek 977 Sound Level Meter NRG#40 Anemometer connected to a Campbell Scientific Data-Logger The Svantek 977 and Norsonic N140 sound level meters were configured to measure and document spectral (frequency-dependent) one-minute LEQ and 10-minute L90 sound level
10 Dufferin Wind Power Inc. Page 6 Dufferin Wind Power Project, Fall Immission Audit February 28, 2017 measurements at the receptor locations, and to also record audio files to allow for identification of dominant sources. Correct calibration of the acoustic instrumentation was verified using an acoustic calibrator manufactured by Brüel & Kjær (B&K). Calibration verification was carried out intermittently during the measurement period. Wind screens were used on all microphones, consistent with the requirements of MOECC technical publication NPC-103, Procedures [4]. Large wind screens, 175 mm in diameter, were utilized on each sound level monitor to minimize wind-induced microphone self-noise at higher wind speeds. Sound level data included herein has not been adjusted for the sound insertion loss of these large wind screens. 4 ASSESSMENT CRITERIA The MOECC publication Noise Guidelines for Wind Farms Interpretation for Applying MOE NPC Publications to Wind Power Generation Facilities [5] indicates the applicable sound level limit for wind energy projects. Additionally, the Compliance Protocol document and the REA approval include the same sound level limits which are shown in Table 3. Table 3: Wind Turbine Noise Criteria [dba] Wind Speed (m/s) at 10 metre Height Wind Turbine Sound Level Limits Class 3 Area [dba] It should be noted that the sound level limits of the MOECC apply only to the sound level contribution of the sound source under assessment, in this case the sound from the wind turbine generators. Thus, where a sound level measured at a receptor includes significant sound due to the relevant sound source and unrelated background sound sources (i.e., road vehicles, air traffic, farming machinery, wind, etc.), some form of evaluation must be made to determine the sound level contribution of the source under assessment in the absence of the background sounds. Methodology prescribed by the MOECC to complete an assessment of wind energy projects is discussed below.
11 Dufferin Wind Power Inc. Page 7 Dufferin Wind Power Project, Fall Immission Audit February 28, METHODOLOGY The REA requires the acoustic audit be completed in accordance with Part D of the Compliance Protocol for Wind Turbine Noise. Part D includes requirements for instrumentation, measurement and data reduction procedures to assist with determining compliance. A series of one-minute energy equivalent sound level measurements are conducted with and without the turbines operating. Simultaneously, wind speed and direction at 10 metre height are measured in one minute intervals. The measured sound level data are separated into integer wind speed bins where the sound levels corresponding to each integer wind speed are arithmetically averaged to determine the average sound level when the wind turbines are operational and when they are parked. The ambient LEQ (turbines parked) is logarithmically subtracted from the overall LEQ (turbines operational) to determine the sound level contribution of the wind turbines alone. Supplementary data including wind speed at turbine hub height, wind speed at noise measurement height, turbine electrical power output, temperature, humidity, and statistical noise indices (Ln) can also be measured during the monitoring campaign to aid in the analysis. The MOECC protocol requires that at least 120 one minute intervals be measured for each wind speed when the turbines are operating and at least 60 one minute intervals be measured for each 10 metre wind speed between 4 and 7 m/s when the turbines are parked. Prior to determining the number of data points measured in each wind speed bin, the data is filtered to include data only during night time hours (between 22:00 and 05:00), data outside of rainfall (no rain within an hour of the measurement interval), and the maximum 10 metre wind speed should not differ from the average by more than 2 m/s. Due to the significant delays in collecting data at 7 m/s, a less conservative approach to the variability in wind speed was undertaken. Specific data points used in the assessment, with wind gusts outside of the recommended 2 m/s criteria, were audio verified for suitability. The MOECC protocol allows for the removal of individual events to improve the signal to noise ratio. A review of the audio recordings allowed for the identification of the dominant noise source within a given one minute interval, and a subsequent removal of those with interference.
12 Dufferin Wind Power Inc. Page 8 Dufferin Wind Power Project, Fall Immission Audit February 28, 2017 Adjustments to the measured sound levels may be required based on wind turbine tonality, if any. If during the acoustic measurement campaign the project wind turbines exhibit tonal characteristics (a whine, screech, buzz or hum) then an assessment of the tonal audibility is required according to International Standards Organization [6]. The average tonal audibility correction must be determined for each integer wind speed and the correction added to the final noise contribution of the wind turbine at those wind speeds. 6 TONALITY ASSESSMENT Based on site observations and measurements up close to the wind turbine generators, there is the potential for tones to be generated by the wind turbines. The Compliance Protocol for Wind Turbine Noise requires that if a tone is identified at any of the wind speeds, the average tonal audibility correction shall be added to the final noise contribution of the wind turbine at those speeds. Some of the audio recordings captured during the 2015 measurement campaign were analyzed utilizing SpectraPLUS-SC (Version ) to conduct narrow band frequency analysis of the recordings. The remaining audio recordings captured during the 2015 measurement campaign and the audio recordings captured during the 2016 measurement campaign were analyzed utilizing the tonality analysis application built into a Larson Davis 831 sound level meter to conduct narrow band frequency analysis of the recordings. Fast Fourier Transform ( FFT ) analysis was utilized to convert the recordings to frequency domain spectra. Tones identified in this way were analysed following methods from ISO standard Annex C Objective Method for assessing the audibility of tones in noise Reference method. The MOECC Compliance Protocol for Wind Turbine Noise assesses tonality as per ISO rather than the tonality analysis included within IEC where a tonality determination is made within close proximity of the turbine. As per the MOECC s Compliance Protocol, five, one-minute recordings, closest to each integer wind speed bin were selected for each receptor location. A total of 10 (five from 2015 and five from 2016), one-minute recordings were selected for receptors PR49 and NP177 and each integer wind speed bin as the data collected for these receptors spans two fall measurement
13 Dufferin Wind Power Inc. Page 9 Dufferin Wind Power Project, Fall Immission Audit February 28, 2017 campaigns. Data were filtered to include points where the receptor location was downwind of the closest turbine and the closest turbine was operating near rated electrical output. Table 4 summarizes the average tonal audibility (ΔLta) and the tonal adjustment (Kt) from the assessed data points for each receptor. Table 4: Summary of Tonality Assessment Receptor ID 10 metre Wind Speed Bins 4 m/s 5 m/s 6 m/s 7 m/s ΔLta Kt ΔLta Kt ΔLta Kt ΔLta Kt VL < PR < 0 0 PVL PR < 0 0 < 0 0 < 0 0 NP177 < < 0 0 < MEASUREMENTS AND RESULTS The sound level measurements were conducted at the receptor locations between October 1, 2015 and January 12, 2016 and October 28 and December 8, The weather during the monitoring period varied, including several days with rain and snow. Temperatures ranged from -21 to 22 Celsius. Wind speeds at 10 metres in height ranged from 0 m/s up to 24 m/s. The prevailing wind direction during the measurement campaign was from the southwest. Figures 2a through 6b show the wind roses for the receptors during the ON and OFF conditions. Data reductions, as discussed in Section 5, were applied to the measured sound levels at the five receptor locations. To confirm wind project ON and OFF conditions a number of additional items of information were reviewed/collected including electrical power production from the turbines, sound level monitoring close to one of the turbines, and audio recordings at the monitoring locations. There were a number of partial outages of the wind project during the measurement campaign for maintenance purposes. These partial outages significantly reduced the number of valid ON data points when considering the requirement for all turbines to be on. The analysis presented
14 Dufferin Wind Power Inc. Page 10 Dufferin Wind Power Project, Fall Immission Audit February 28, 2017 herein considers the ON condition to be a valid data point when all turbines within 3 km of the monitoring location were operating. 7.1 RECEPTOR VL93 SUMMARY The sound level summary for data collected at VL93 is shown in Tables 5a and 5b below and Figures 7a and 7b. Table 5a: Sound Level Summary for Receptor VL93 [dba] 10 metre Wind Speed Bins L EQ Sound Level [dba] 4 m/s 5 m/s 6 m/s 7 m/s Average Operating (ON) / std dev Average Ambient (OFF) / std dev Wind Project Only / std dev N/A N/A Criteria Excess The calculated sound level represents an estimate of the wind project at this location, as the operating and ambient sound levels are essentially equivalent. 2 The wind project only sound level cannot be calculated, as the average ambient sound level was greater than the average operating sound level. Table 5b: Summary of Valid Data Points for Receptor VL93 10 metre Wind Speed [m/s] Wind Project Condition Operating (ON) Ambient (OFF) The measurement data indicates that the average operating sound levels (ON) were either below or essentially equivalent to the average ambient sound levels (OFF) at all wind speeds. Based on the data presented above, and in Figures 7a and 7b, the wind energy facility is compliant with the MOECC sound level criteria at this location.
15 Dufferin Wind Power Inc. Page 11 Dufferin Wind Power Project, Fall Immission Audit February 28, RECEPTOR PR49 SUMMARY The sound level summary for data collected at PR49 is shown in Tables 6a and 6b below, and Figures 8a and 8b. Table 6a: Sound Level Summary for Receptor PR49 [dba] 10 metre Wind Speed Bins L EQ Sound Level [dba] 4 m/s 5 m/s 6 m/s 7 m/s Average Operating (ON) / std dev Average Ambient (OFF) / std dev Wind Project Only / std dev N/A Criteria Excess The calculated sound level represents an estimate of the wind project at this location, as the operating and ambient sound levels are essentially equivalent. 2 The wind project only sound level cannot be calculated, as the average ambient sound level was greater than the average operating sound level. Table 6b: Summary of Valid Data Points for Receptor PR49 10 metre Wind Speed [m/s] Wind Project Condition Operating (ON) Ambient (OFF) The measurement data indicates a good separation between the ON and OFF sound levels at 7 m/s. For 4, 5 and 6 m/s the data for ON and OFF are essentially equivalent. Based on the data presented above and in Figures 8a and 8b, the wind energy facility is compliant with the MOECC sound level criteria at this location.
16 Dufferin Wind Power Inc. Page 12 Dufferin Wind Power Project, Fall Immission Audit February 28, RECEPTOR PVL19 SUMMARY The sound level summary for data collected at PVL19 is shown in Tables 7a and 7b below, and Figures 9a and 9b. Table 7a: Sound Level Summary for Receptor PVL19 [dba] 10 metre Wind Speed Bins L EQ Sound Level [dba] 4 m/s 5 m/s 6 m/s 7 m/s Average Operating (ON) / std dev Average Ambient (OFF) / std dev Wind Project Only / std dev Criteria Excess The calculated sound level represents an estimate of the wind project at this location, as the operating and ambient sound levels are essentially equivalent. Table 7b: Summary of Valid Data Points for Receptor PVL19 10 metre Wind Speed [m/s] Wind Project Condition Operating (ON) Ambient (OFF) The measurement data indicates a good separation between the ON and OFF data for 5, 6 and 7 m/s. For 4 m/s the data for ON and OFF are essentially equivalent. Based on the data presented above, and in Figures 9a and 9b, the wind energy facility is compliant with the MOECC sound level criteria at this location.
17 Dufferin Wind Power Inc. Page 13 Dufferin Wind Power Project, Fall Immission Audit February 28, RECEPTOR PR6 SUMMARY The sound level summary for data collected at PR6 is shown in Tables 8a and 8b below, and Figures 10a and 10b. Table 8a: Sound Level Summary for Receptor PR6 [dba] 10 metre Wind Speed Bins L EQ Sound Level [dba] 4 m/s 5 m/s 6 m/s 7 m/s Average Operating (ON) / std dev Average Ambient (OFF) / std dev Wind Project Only / std dev Criteria Excess Table 8b: Summary of Valid Data Points for Receptor PR6 10 metre Wind Speed [m/s] Wind Project Condition Operating (ON) Ambient (OFF) The measurement data indicates a good separation between the ON and OFF data for all assessed wind speeds. Based on the data presented above, and in Figures 10a and 10b, the wind energy facility is compliant with the MOECC sound level criteria at this location.
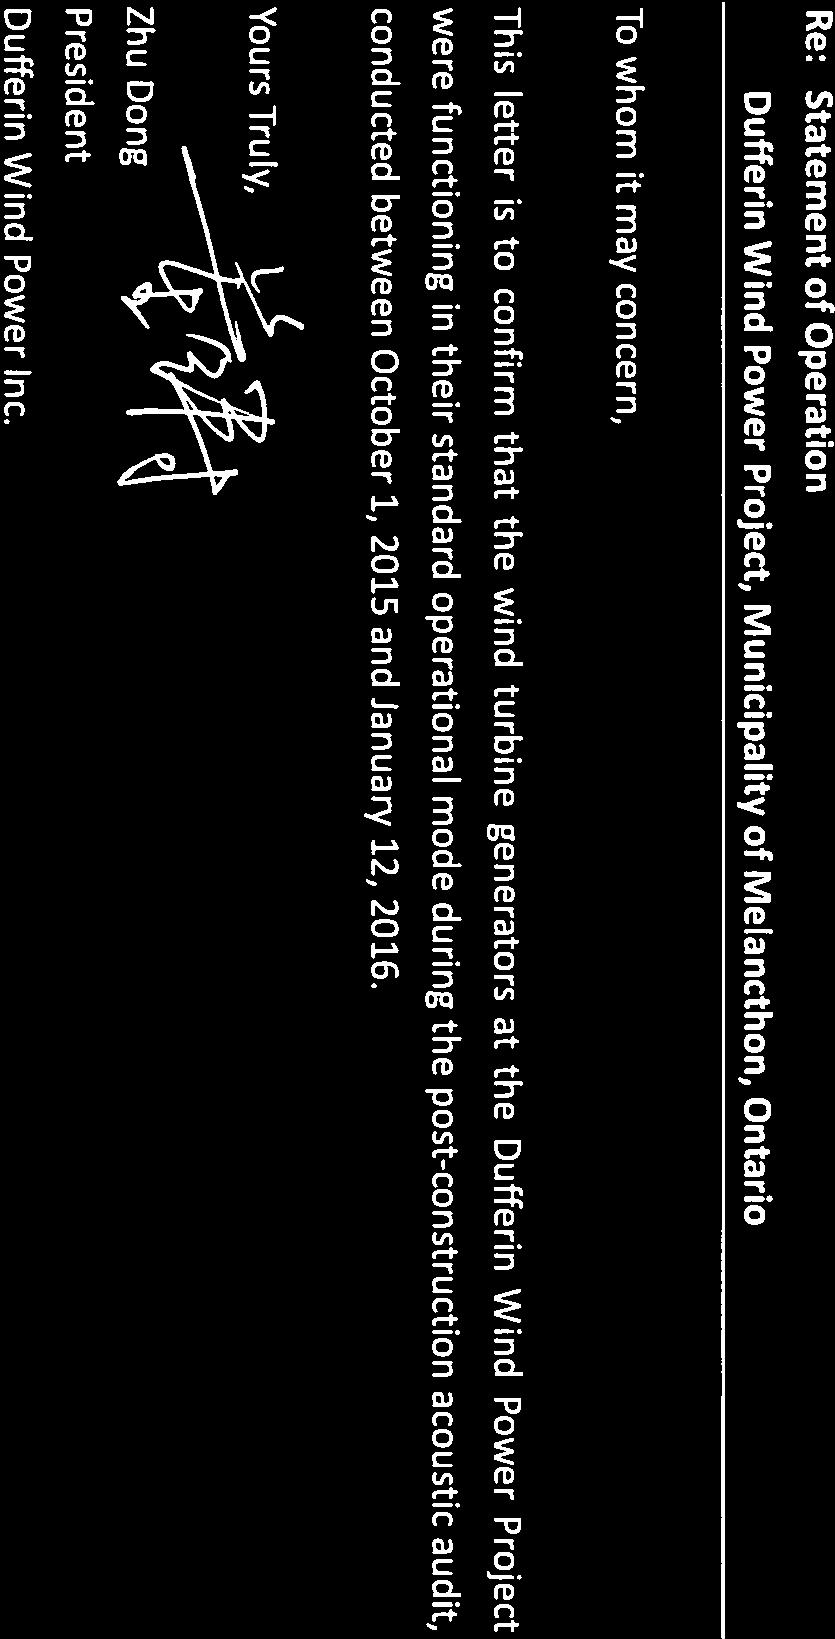
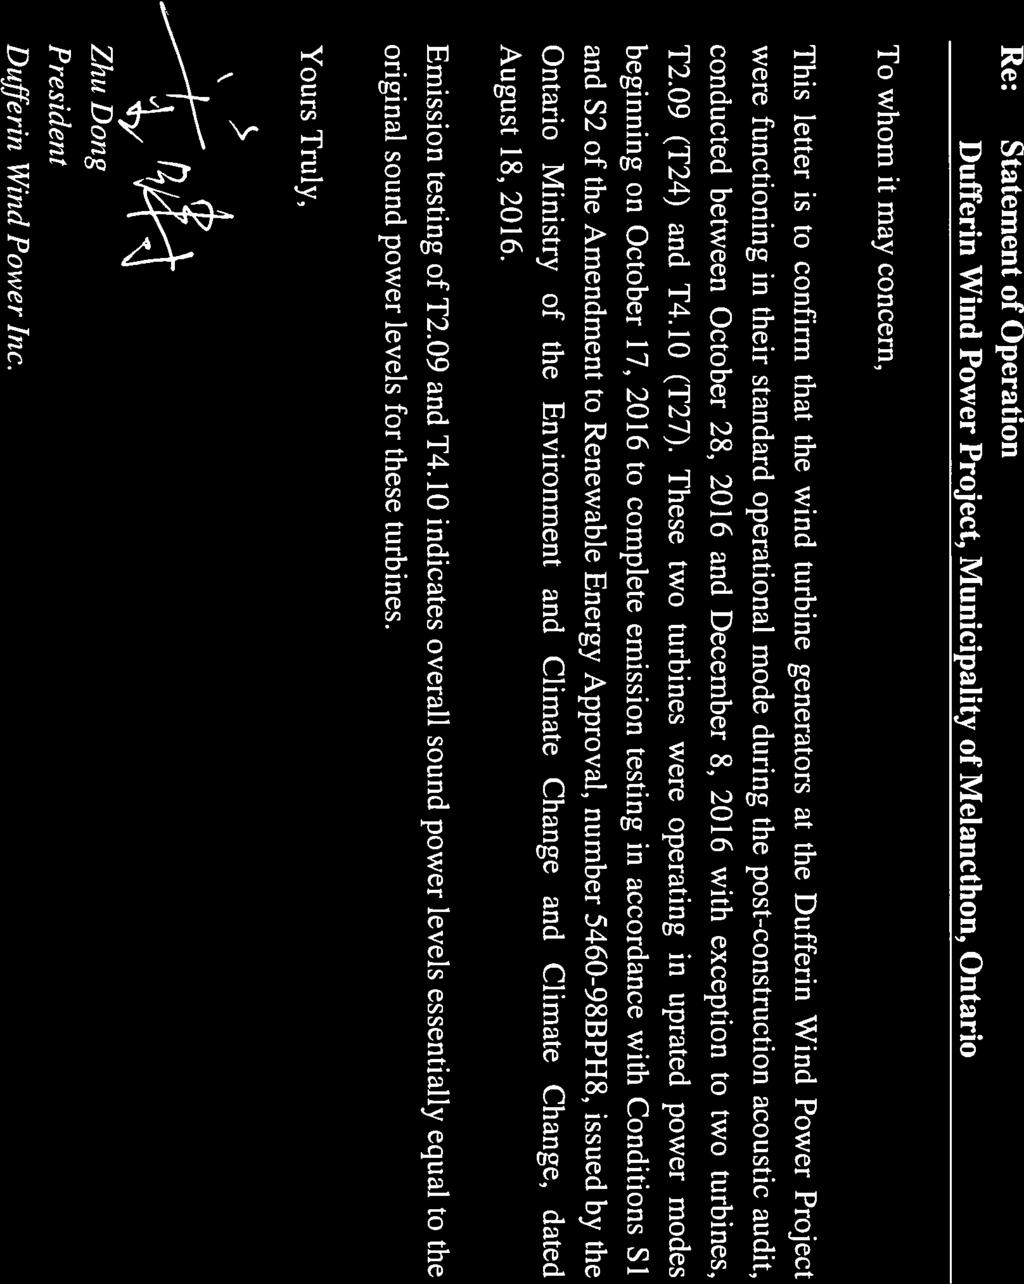
18 Dufferin Wind Power Inc. Page 14 Dufferin Wind Power Project, Fall Immission Audit February 28, RECEPTOR NP177 SUMMARY The sound level summary for data collected at NP177 is shown in Tables 9a and 9b below, and Figures 11a and 11b. Table 9a: Sound Level Summary for Receptor NP177 [dba] 10 metre Wind Speed Bins L EQ Sound Level [dba] 4 m/s 5 m/s 6 m/s 7 m/s Average Operating (ON) / std dev Average Ambient (OFF) / std dev Wind Project Only / std dev. N/A N/A N/A Criteria Excess The wind project only sound level cannot be calculated as the average ambient sound level was greater than the average operating sound level. Table 9b: Summary of Valid Data Points for Receptor NP metre Wind Speed [m/s] Wind Project Condition Operating (ON) Ambient (OFF) This receptor location is located adjacent to Highway 124, a relatively busy roadway, and is significantly influenced by road traffic essentially during all hours. This is shown in the ON and OFF data, above, where the levels are essentially equivalent for all wind speeds. Based on the data presented above, and in Figures 11a and 11b, the wind energy facility is compliant with the MOECC sound level criteria at this location. Appendix D includes statements from Dufferin Wind Power Inc. indicating the wind turbines were operating normally for the duration of the measurement campaigns with exception to two turbines, T24 (T2.09) and T27 (T4.10). These two turbines were operating in uprated electrical power modes beginning on October 17, 2016, to complete emission testing in accordance with Conditions S1 and S2 of the Amendment to Renewable Energy Approval, number BPH8, issued by the Ontario Ministry of the Environment and Climate Change, dated August 18, Additional data collection at PR49 and NP177 during the fall of 2016 was not affected
19 Dufferin Wind Power Inc. Page 15 Dufferin Wind Power Project, Fall Immission Audit February 28, 2017 by the turbine electrical uprated modes because these turbines are more than 1500 metres from the two receptor locations and the emission testing indicates overall sound power levels that are essentially equal to the sound power levels under the original electrical power settings. 8 CONCLUSIONS The measurements and analysis, performed in accordance with the methods prescribed by the Ontario Ministry of the Environment and Climate Change publication Compliance Protocol for Wind Turbine Noise, indicates that the Dufferin Wind Power Project was operating within compliance of the MOECC s sound level criteria at the considered receptor locations during the Fall 2015 and Fall 2016 monitoring campaigns.
20 Dufferin Wind Power Inc. Page 16 Dufferin Wind Power Project, Fall Immission Audit February 28, 2017 REFERENCES 1. Ontario Ministry of the Environment Renewable Energy Approval Number BPH8, June 10, Dillon Consulting Limited, Noise Study Report Revised FINAL, May Ontario Ministry of the Environment Publication, Compliance Protocol for Wind Turbine Noise Guideline for Acoustic Assessment and Measurement. 4. Ontario Ministry of the Environment Publication, NPC-103, Procedures. 5. Ontario Ministry of the Environment Publication, Noise Guidelines for Wind Farms, Interpretation for Applying MOE NPC Publications to Wind Power Generation Facilities, October International Standards Organization , Acoustics Description, assessment and measurement of environmental noise Part 2: Determination of environmental noise levels, Environment Canada, Wind Atlas. August 28, Retrieved from &ni=944&nj=204.
 4894800 4894600 PVL12 PR27 4894600 PR25 4894400 4894200 4894400 4895000 4895000 4895200 4895200 Monitor VL93")
 4893800 NP111 FRAME COORDINATES ARE UTM IN METRES 559000 559200 559400 559600 559800 560000 560200 Figure 1a:")
21 PR22 20 Side Road PVL11 Fourth Line T33 (T2.08) T24 (T2.09) PVL12 PR PR Monitor VL PR26 PR T34 (T4.07) NP111 FRAME COORDINATES ARE UTM IN METRES Figure 1a: Sound Level Monitoring Location, VL93 Dufferin Wind Power Project
 4897000 4896700 PR9 4896700 4896600 T39 (T1.02) Monitor PR49 VL77 4896600 4896500 NP83 4896500 4896400 PR8 4896400 Fifth Line T40 (T1.")

22 PR7 NP T38 (T1.03) PR T39 (T1.02) Monitor PR49 VL NP PR Fifth Line T40 (T1.01) PR FRAME COORDINATES ARE UTM IN METRES Figure 1b: Sound Level Monitoring Location, PR49 Dufferin Wind Power Project


23 T3.11 Monitor NP PVL T VL NP T3.09 PR5 Mulmur Melanchton Townline VL94 T3.08 PVL FRAME COORDINATES ARE UTM IN METRES Figure 1c: Sound Level Monitoring Location, PVL19 Dufferin Wind Power Project


24 VL NP71 NP72 VL13 Tenth Line PR Monitor PR Fifth Line T1.04 PR PVL8 VL PR7 NP81 T FRAME COORDINATES ARE UTM IN METRES Figure 1d: Sound Level Monitoring Location, PR6 Dufferin Wind Power Project
 NP177 4893200 County Road 20 NP172 PVL23 Monitor 4893200 4893000 NP250 T20 (T4.")
 562200 FRAME COORDINATES ARE UTM IN METRES 562400 562600 562800 Figure 1e: Sound Level Monitoring")
25 Dufferin Road NP T18 (T4.13) PR17 T19 (T4.12) NP County Road 20 NP172 PVL23 Monitor NP250 T20 (T4.11) T21 (T4.14) FRAME COORDINATES ARE UTM IN METRES Figure 1e: Sound Level Monitoring Location, NP177 Dufferin Wind Power Project
26 Figure 2a: Wind Direction Receptor VL93 10 m Height, Wind Speeds 4 7 m/s ON Condition, Oct 1, 2015 to Jan 12, Total Figure 2b: Wind Direction Receptor VL93 10 m Height, Wind Speeds 4 7 m/s OFF Condition, Oct 1, 2015 to Jan 12, Total
27 Figure 3a: Wind Direction Receptor PR49 10 m Height, Wind Speeds 4 7 m/s ON Condition, Oct 1, 2015 to Jan 12, 2016 and Oct 28 to Nov 11, Total Figure 3b: Wind Direction Receptor PR49 10 m Height, Wind Speeds 4 7 m/s OFF Condition, Oct 1, 2015 to Jan 12, 2016 and Oct 28 to Nov 11, Total
28 Figure 4a: Wind Direction Receptor PVL19 10 m Height, Wind Speeds 4 7 m/s ON Condition, October 1, 2015 to November 24, Total Figure 4b: Wind Direction Receptor PVL19 10 m Height, Wind Speeds 4 7 m/s OFF Condition, October 1, 2015 to November 24, Total
29 Figure 5a: Wind Direction Receptor PR6 10 m Height, Wind Speeds 4 7 m/s ON Condition, Oct 1, 2015 to Jan 12, Total Figure 5b: Wind Direction Receptor PR6 10 m Height, Wind Speeds 4 7 m/s OFF Condition, Oct 1, 2015 to Jan 12, Total
30 Figure 6a: Wind Direction Receptor NP m Height, Wind Speeds 4 7 m/s ON Condition, Oct 1, 2015 to Jan 12, 2016 and Oct 28 to Dec 8, Total Figure 6b: Wind Direction Receptor NP m Height, Wind Speeds 4 7 m/s OFF Condition, Oct 1, 2015 to Jan 12, 2016 and Oct 28 to Dec 8, Total
31 55 Figure 7a: Dufferin Wind Power Project, Fall Immission Results Receptor VL93, October 1, 2015 to January 12, Sound Pressure Level [dba] m Height Wind Speed [m/s] ON OFF ON OFF Criteria ON OFF
32 55 Figure 7b: Dufferin Wind Power Project, Fall Immission Results Receptor VL93, October 1, 2015 to January 12, Sound Pressure Level [dba] m Height Wind Speed [m/s] ON OFF Criteria ON OFF
33 Figure 8a: Dufferin Wind Energy Project, Fall Acoustic Audit Immission Results Receptor PR49, Oct 1, 2015 to Jan 15, 2016 and Oct 28 to Nov 15, Sound Pressure Level [dba] m Height Wind Speed [m/s] ON ON OFF OFF Criteria ON OFF
34 Figure 8b: Dufferin Wind Energy Project, Fall Acoustic Audit Immission Results Receptor PR49, Oct 1, 2015 to Jan 15, 2016 and Oct 28 to Nov 15, Sound Pressure Level [dba] m Height Wind Speed [m/s] ON OFF Criteria ON OFF
35 55 Figure 9a: Dufferin Wind Power Project, Fall Immission Results Receptor PVL19, October 1, 2015 to November 24, Sound Pressure Level [dba] m Height Wind Speed [m/s] ON OFF ON OFF Criteria ON OFF
36 55 Figure 9b: Dufferin Wind Power Project, Fall Immission Results Receptor PVL19, October 1, 2015 to November 24, Sound Pressure Level [dba] m Height Wind Speed [m/s] ON OFF Criteria ON OFF
37 55 Figure 10a: Dufferin Wind Power Project, Fall Immission Results Receptor PR6, October 1, 2015 to January 12, Sound Pressure Level [dba] m Height Wind Speed [m/s] ON OFF ON OFF Criteria ON OFF
38 55 Figure 10b: Dufferin Wind Power Project, Fall Immission Results Receptor PR6, October 1, 2015 to January 12, Sound Pressure Level [dba] m Height Wind Speed [m/s] ON OFF Criteria ON OFF
39 Figure 11a: Dufferin Wind Energy Project, Fall Acoustic Audit Immission Results Receptor NP177, Oct 1, 2015 to Jan 15, 2016 and Oct 28 to Dec 8, Sound Pressure Level [dba] m Height Wind Speed [m/s] ON ON OFF OFF ON OFF
40 Figure 11b: Dufferin Wind Energy Project, Fall Acoustic Audit Immission Results Receptor NP177, Oct 1, 2015 to Jan 15, 2016 and Oct 28 to Dec 8, Sound Pressure Level [dba] m Height Wind Speed [m/s] ON Criteria ON OFF OFF
41 APPENDIX A: Receptor Selection Information
42 Figure A1: Annual Wind Rose [7]
43 ID Description Table A1: Receptor Selection Receptor Height (m) Distance to Turbine (m) Turbine ID Sound Level [dba]* Comments NP133 Non - Participating T17 (T4.04) 39.8 Not in the Prevailing Wind Direction NP250 Non - Participating T19 (T4.12) 39.8 Permission Not Granted VL57 Vacant Lot T5 (T3.09) 39.8 Poor Monitoring Location VL58 Vacant Lot T11 (T3.03) 39.8 Poor Monitoring Location VL66 Vacant Lot T11 (T3.03) 39.8 Poor Monitoring Location VL93 Vacant Lot T25 (T4.06) 39.8 Selected Monitoring Location NP15 Non - Participating T48 (T1.11) 39.7 Not in the Prevailing Wind Direction NP83 Non - Participating T40 (T1.01) 39.7 Permission Not Granted NP151 Non - Participating T10 (T3.04) 39.7 Poor Monitoring Location NP158 Non - Participating T7 (T3.07) 39.7 Not in the Prevailing Wind Direction NP178 Non - Participating T2 (T3.12) 39.7 Not in the Prevailing Wind Direction PR49 Participating T40 (T1.01) 39.7** Selected Monitoring Location NP40 Non - Participating T47 (T1.10) 39.6 Not in the Prevailing Wind Direction NP127 Non - Participating T15 (T4.02) 39.6 Not in the Prevailing Wind Direction NP174 Non - Participating T18 (T4.13) 39.6 Permission Not Granted VL91 Vacant Lot T15 (T4.02) 39.6 Not in the Prevailing Wind Direction VL104 Vacant Lot T23 (T2.01) 39.6 Permission Not Granted NP177 Non - Participating T18 (T4.13) 39.5** Selected Monitoring Location NP43 Non - Participating T44 (T1.08) 39.5 Not in the Prevailing Wind Direction NP101 Non - Participating T32 (T2.07) 39.5 Poor Monitoring Location VL7 Vacant Lot T13 (T3.01) 39.5 Permission Not Granted VL62 Vacant Lot T15 (T4.02) 39.5 Not in the Prevailing Wind Direction NP66 Non - Participating T43 (T1.06) 39.4 Poor Monitoring Location NP86 Non - Participating T35 (T4.08) 39.4 Not in the Prevailing Wind Direction NP89 Non - Participating T41 (T2.06) 39.4 Poor Monitoring Location NP168 Non - Participating T18 (T4.13) 39.4 Poor Monitoring Location NP172 Non - Participating T18 (T4.13) 39.4 Poor Monitoring Location VL4 Vacant Lot T42 (T1.05) 39.4 Permission Not Granted VL67 Vacant Lot T12 (T3.02) 39.4 Not in the Prevailing Wind Direction NP128 Non - Participating T27 (T4.10) 39.3 Not in the Prevailing Wind Direction VL105 Vacant Lot T24 (T2.09) 39.3 Permission Not Granted NP84 Non - Participating T41 (T2.06) 39.2 Not in the Prevailing Wind Direction VL76 Vacant Lot T28 (T2.04) 39.2 Represented by PR49 VL77 Vacant Lot T40 (T1.01) 39.2 Represented by PR49 VL90 Vacant Lot T41 (T2.06) 39.2 Poor Monitoring Location NP57 Non - Participating T42 (T1.05) 39.1 Poor Monitoring Location NP81 Non - Participating T38 (T1.03) 39.1 Permission Not Granted VL10 Vacant Lot T24 (T2.09) 39.1 Permission Not Granted PR6 Participating T37 (T1.04) 39.0** Selected Monitoring Location NP59 Non - Participating T42 (T1.05) 39.0 Not in the Prevailing Wind Direction NP126 Non - Participating T13 (T3.01) 39.0 Poor Monitoring Location NP175 Non - Participating T1 (T3.13) 39.0 Poor Monitoring Location VL73 Vacant Lot T16 (T4.03) 39.0 Poor Monitoring Location PVL19 Participating Vacant Lot T4 (T3.10) 39.1 Selected Monitoring Location NP142 Non - Participating T21 (T4.14) 38.9 Not in the Prevailing Wind Direction NP143 Non - Participating T2 (T3.12) 38.9 Not in the Prevailing Wind Direction NP155 Non - Participating T1 (T3.13) 38.9 Not in the Prevailing Wind Direction NP162 Non - Participating T15 (T4.02) 38.9 Poor Monitoring Location
44 ID Description Receptor Height (m) Distance to Turbine (m) Turbine ID Sound Level [dba]* Comments VL61 Vacant Lot T14 (T4.01) 38.9 Poor Monitoring Location PVL19 Participating Vacant Lot T4 (T3.10) 38.8 Selected Monitoring Location NP58 Non - Participating T42 (T1.05) 38.7 Poor Monitoring Location NP60 Non - Participating T42 (T1.05) 38.7 Poor Monitoring Location NP156 Non - Participating T14 (T4.01) 38.7 Poor Monitoring Location VL59 Vacant Lot T8 (T3.06) 38.7 Poor Monitoring Location VL60 Vacant Lot T14 (T4.01) 38.7 Poor Monitoring Location NP10 Non - Participating T22 (T1.13) 38.6 Not in the Prevailing Wind Direction NP141 Non - Participating T9 (T3.05) 38.6 Not in the Prevailing Wind Direction NP159 Non - Participating T14 (T4.01) 38.5 Poor Monitoring Location NP160 Non - Participating T14 (T4.01) 38.5 Poor Monitoring Location NP184 Non - Participating T2 (T3.12) 38.5 Not in the Prevailing Wind Direction VL63 Vacant Lot T44 (T1.08) 38.5 Not in the Prevailing Wind Direction NP98 Non - Participating T29 (T2.05) 38.4 Not in the Prevailing Wind Direction NP111 Non - Participating T25 (T4.06) 38.4 Poor Monitoring Location NP125 Non - Participating T12 (T3.02) 38.4 Not in the Prevailing Wind Direction NP61 Non - Participating T42 (T1.05) 38.3 Poor Monitoring Location NP112 Non - Participating T25 (T4.06) 38.3 Poor Monitoring Location NP124 Non - Participating T27 (T4.10) 38.3 Not in the Prevailing Wind Direction NP161 Non - Participating T8 (T3.06) 38.3 Poor Monitoring Location NP259 Non - Participating T44 (T1.08) 38.3 Not in the Prevailing Wind Direction VL9 Vacant Lot T40 (T1.01) 38.3 Not in the Prevailing Wind Direction VL52 Vacant Lot T3 (T3.11) 38.3 Represented by PVL19 VL89 Vacant Lot T10 (T3.04) 38.3 Not in the Prevailing Wind Direction PR49 Participating T40 (T1.01) 38.2 Selected Monitoring Location NP95 Non - Participating T35 (T4.08) 38.2 Not in the Prevailing Wind Direction NP113 Non - Participating T25 (T4.06) 38.2 Permission not granted NP132 Non - Participating T26 (T4.05) 38.2 Permission not granted NP115 Non - Participating T25 (T4.06) 38.1 Poor Monitoring Location NP138 Non - Participating T2 (T3.12) 38.1 Not in the Prevailing Wind Direction NP163 Non - Participating T1 (T3.13) 38.1 Not in the Prevailing Wind Direction VL1 Vacant Lot T14 (T4.01) 38.1 Poor Monitoring Location VL8 Vacant Lot T14 (T4.01) 38.1 Poor Monitoring Location NP56 Non - Participating T42 (T1.05) 38.0 Permission not granted NP63 Non - Participating T37 (T1.04) 38.0 Not in the Prevailing Wind Direction VL13 Vacant Lot T37 (T1.04) 38.0 Represented by PR6 VL47 Vacant Lot T1 (T3.13) 38.0 Not in the Prevailing Wind Direction VL86 Vacant Lot T40 (T1.01) 38.0 Not in the Prevailing Wind Direction NP72 Non - Participating T37 (T1.04) 37.9 Represented by PR6 NP171 Non - Participating T18 (T4.13) 37.9 Poor Monitoring Location NP177 Non - Participating T18 (T4.13) 37.9 Selected Monitoring Location PR6 Participating T37 (T1.04) 37.2 Selected Monitoring Location *Predicted sound levels from Acoustic Assessment Report [2] **Predicted sound levels from acoustic model.
45 APPENDIX B: Receptor Location Photos

46 Meteorological Tower Sound Level Meter Receptor Location VL93


47 Sound Level Meter Meteorological Tower Receptor Location PR49 Fall 2016

48 Meteorological Tower Sound Level Meter Receptor Location PR49 Fall 2015

49 Meteorological Tower Sound Level Meter Receptor Location PVL19

50 Sound Level Meter Meteorological Tower Receptor Location NP177 Fall 2016


51 Sound Level Meter Meteorological Tower Receptor Location NP177 Fall 2015


52 Sound Level Meter Meteorological Tower Receptor Location PR6
53 APPENDIX C: Instrument Calibration Certificates
54
55
56 SOH Wind Engineering LLC 141 Leroy Road Williston, VT USA Tel Fax CERTIFICATE FOR CALIBRATION OF ANEMOMETER Certificate number: 14.US Date of issue: September 11, 2014 Type: NRG #40C Serial number: Manufacturer: Renewable NRG Systems Inc, 110 Riggs Road, Hinesburg, VT 05461, USA Client: Renewable NRG Systems Inc, 110 Riggs Road, Hinesburg, VT 05461, USA Anemometer received: September 3, 2014 Anemometer calibrated: September 11, 2014 Calibrated by: mej Certificate prepared by: Software Revision 3 Calibration equation obtained: v [m/s] = f [Hz] Calibration procedure: IEC :2005(E) Annex F Approved by: Calibration engineer, rds Standard uncertainty, slope: Standard uncertainty, offset: Covariance: (m/s)²/hz Coefficient of correlation: Absolute maximum deviation: m/s at m/s Barometric pressure: hpa Relative humidity: 46.7% Succession Velocity Temperature in Wind Frequency, Deviation, Uncertainty pressure, q. wind tunnel d.p. box velocity, v. f. d. u c (k=2) [Pa] [ C] [ C] [m/s] [Hz] [m/s] [m/s] last first AC-1746 Standard: ISO/IEC Page 1 of 2
57 EQUIPMENT USED Serial Number Description Njord 1 Wind tunnel, blockage factor = Control cup anemometer - Mounting tube, D = 12.7 mm TT001 Summit RT-AUI, wind tunnel TP001 Summit RT-AUI, differential pressure box DP005 Setra Model 239 pressure transducer HY002 Dwyer Instruments RHP-2D20 humidity transmitter BP001 Setra Model 278 barometer PL5 Pitot tube XB001 Computer Board. 16 bit A/D data acquisition board 9PRZRW1 PC dedicated to data acquisition Traceable calibrations of the equipment are carried out by external accredited institutions: TRANSCAT, Atlantic Scale, & Furness Controls. A real-time analysis module within the data acquisition software detects pulse frequency. Photo of the wind tunnel setup. The cross-sectional area is 2.5 x 2.5 m. UNCERTAINTIES The documented uncertainty is the total combined uncertainty at 95% confidence level (k=2) in accordance with EA- 4/02. The uncertainty at 10 m/s comply with the requirements in the IEC :2005 procedure. See Document US.DC.016 for further details. Certificate number: 14.US This certificate must not be reproduced, except in full, without the approval of SOH Wind Engineering LLC Page 2 of 2

58

59
60
61
62 SOH Wind Engineering LLC 141 Leroy Road Williston, VT USA Tel Fax CERTIFICATE FOR CALIBRATION OF ANEMOMETER Certificate number: 15.US Date of issue: January 8, 2015 Type: NRG #40C Serial number: Manufacturer: Renewable NRG Systems Inc, 110 Riggs Road, Hinesburg, VT 05461, USA Client: Renewable NRG Systems Inc, 110 Riggs Road, Hinesburg, VT 05461, USA Anemometer received: December 23, 2014 Anemometer calibrated: January 8, 2015 Calibrated by: mej Certificate prepared by: Software Revision 3 Calibration equation obtained: v [m/s] = f [Hz] Calibration procedure: IEC :2005(E) Annex F Approved by: Calibration engineer, rds Standard uncertainty, slope: Standard uncertainty, offset: Covariance: (m/s)²/hz Coefficient of correlation: Absolute maximum deviation: m/s at m/s Barometric pressure: hpa Relative humidity: 8.5% Succession Velocity Temperature in Wind Frequency, Deviation, Uncertainty pressure, q. wind tunnel d.p. box velocity, v. f. d. u c (k=2) [Pa] [ C] [ C] [m/s] [Hz] [m/s] [m/s] last first AC-1746 Standard: ISO/IEC Page 1 of 2
63 EQUIPMENT USED Serial Number Description Njord 1 Wind tunnel, blockage factor = Control cup anemometer - Mounting tube, D = 12.7 mm TT001 Summit RT-AUI, wind tunnel TP001 Summit RT-AUI, differential pressure box DP005 Setra Model 239 pressure transducer HY002 Dwyer Instruments RHP-2D20 humidity transmitter BP001 Setra Model 278 barometer PL7 Pitot tube XB002 Computer Board. 16 bit A/D data acquisition board 9PRZRW1 PC dedicated to data acquisition Traceable calibrations of the equipment are carried out by external accredited institutions: TRANSCAT, Atlantic Scale, & Furness Controls. A real-time analysis module within the data acquisition software detects pulse frequency. Photo of the wind tunnel setup. The cross-sectional area is 2.5 x 2.5 m. UNCERTAINTIES The documented uncertainty is the total combined uncertainty at 95% confidence level (k=2) in accordance with EA- 4/02. The uncertainty at 10 m/s comply with the requirements in the IEC :2005 procedure. See Document US.DC.016 for further details. Certificate number: 15.US This certificate must not be reproduced, except in full, without the approval of SOH Wind Engineering LLC Page 2 of 2
64
65
66
67
68 SOH Wind Engineering LLC 141 Leroy Road Williston, VT USA Tel Fax CERTIFICATE FOR CALIBRATION OF ANEMOMETER Certificate number: 14.US Date of issue: June 2, 2014 Type: NRG #40C Serial number: Manufacturer: Renewable NRG Systems Inc, 110 Riggs Road, Hinesburg, VT 05461, USA Client: Renewable NRG Systems Inc, 110 Riggs Road, Hinesburg, VT 05461, USA Anemometer received: May 13, 2014 Anemometer calibrated: June 2, 2014 Calibrated by: mej Certificate prepared by: Software Revision 3 Calibration equation obtained: v [m/s] = f [Hz] Calibration procedure: IEC :2005(E) Annex F Approved by: Calibration engineer, rds Standard uncertainty, slope: Standard uncertainty, offset: Covariance: (m/s)²/hz Coefficient of correlation: Absolute maximum deviation: m/s at m/s Barometric pressure: hpa Relative humidity: 40.9% Succession Velocity Temperature in Wind Frequency, Deviation, Uncertainty pressure, q. wind tunnel d.p. box velocity, v. f. d. u c (k=2) [Pa] [ C] [ C] [m/s] [Hz] [m/s] [m/s] last first AC-1746 Standard: ISO/IEC Page 1 of 2
69 EQUIPMENT USED Serial Number Description Njord 2 Wind tunnel, blockage factor = Control cup anemometer - Mounting tube, D = 12.7 mm TT003 Summit RT-AUI, wind tunnel TT002 Summit RT-AUI, differential pressure box DP007 Setra Model 239 pressure transducer HY003 Dwyer Instruments RHP-2D20 humidity transmitter BP003 Setra Model 278 barometer PL4 Pitot tube XB002 Computer Board. 16 bit A/D data acquisition board 66GSPS1 PC dedicated to data acquisition Traceable calibrations of the equipment are carried out by external accredited institutions: TRANSCAT, Atlantic Scale, & Furness Controls. A real-time analysis module within the data acquisition software detects pulse frequency. Photo of the wind tunnel setup. The cross-sectional area is 2.5 x 2.5 m. UNCERTAINTIES The documented uncertainty is the total combined uncertainty at 95% confidence level (k=2) in accordance with EA- 4/02. The uncertainty at 10 m/s comply with the requirements in the IEC :2005 procedure. See Document US.DC.016 for further details. Certificate number: 14.US This certificate must not be reproduced, except in full, without the approval of SOH Wind Engineering LLC Page 2 of 2
70

 Annex F Approved by: Calibration engineer, rds Standard uncertainty, slope: 0.")
71 SOH Wind Engineering LLC 141 Leroy Road Williston, VT USA Tel Fax CERTIFICATE FOR CALIBRATION OF ANEMOMETER Certificate number: 14.US Date of issue: June 2, 2014 Type: NRG #40C Serial number: Manufacturer: Renewable NRG Systems Inc, 110 Riggs Road, Hinesburg, VT 05461, USA Client: Renewable NRG Systems Inc, 110 Riggs Road, Hinesburg, VT 05461, USA Anemometer received: May 13, 2014 Anemometer calibrated: June 2, 2014 Calibrated by: mej Certificate prepared by: Software Revision 3 Calibration equation obtained: v [m/s] = f [Hz] Calibration procedure: IEC :2005(E) Annex F Approved by: Calibration engineer, rds Standard uncertainty, slope: Standard uncertainty, offset: Covariance: (m/s)²/hz Coefficient of correlation: Absolute maximum deviation: m/s at m/s Barometric pressure: hpa Relative humidity: 40.4% Succession Velocity Temperature in Wind Frequency, Deviation, Uncertainty pressure, q. wind tunnel d.p. box velocity, v. f. d. u c (k=2) [Pa] [ C] [ C] [m/s] [Hz] [m/s] [m/s] last first AC-1746 Standard: ISO/IEC Page 1 of 2
72 EQUIPMENT USED Serial Number Description Njord 2 Wind tunnel, blockage factor = Control cup anemometer - Mounting tube, D = 12.7 mm TT003 Summit RT-AUI, wind tunnel TT002 Summit RT-AUI, differential pressure box DP007 Setra Model 239 pressure transducer HY003 Dwyer Instruments RHP-2D20 humidity transmitter BP003 Setra Model 278 barometer PL4 Pitot tube XB002 Computer Board. 16 bit A/D data acquisition board 66GSPS1 PC dedicated to data acquisition Traceable calibrations of the equipment are carried out by external accredited institutions: TRANSCAT, Atlantic Scale, & Furness Controls. A real-time analysis module within the data acquisition software detects pulse frequency. Photo of the wind tunnel setup. The cross-sectional area is 2.5 x 2.5 m. UNCERTAINTIES The documented uncertainty is the total combined uncertainty at 95% confidence level (k=2) in accordance with EA- 4/02. The uncertainty at 10 m/s comply with the requirements in the IEC :2005 procedure. See Document US.DC.016 for further details. Certificate number: 14.US This certificate must not be reproduced, except in full, without the approval of SOH Wind Engineering LLC Page 2 of 2

73
74
75 SOH Wind Engineering LLC 141 Leroy Road Williston, VT USA Tel Fax CERTIFICATE FOR CALIBRATION OF CUP ANEMOMETER Certificate number: 15.US Date of issue: January 8, 2015 Type: NRG #40C Serial number: Manufacturer: Renewable NRG Systems Inc, 110 Riggs Road, Hinesburg, VT 05461, USA Client: Renewable NRG Systems Inc, 110 Riggs Road, Hinesburg, VT 05461, USA Anemometer received: December 23, 2014 Anemometer calibrated: 11:23 January 8, 2015 Calibrated by: mej Certificate prepared by: Software Revision 6 Calibration equation obtained: v [m/s] = f [Hz] Calibration procedure: IEC :2005(E) Annex F Approved by: Calibration engineer, rds Standard uncertainty, slope: Standard uncertainty, offset: Covariance: (m/s)²/hz Coefficient of correlation: Absolute maximum deviation: m/s at m/s Barometric pressure: hpa Relative humidity: 10.4% Succession Velocity Temperature in Wind Frequency, Deviation, Uncertainty pressure, q. wind tunnel d.p. box velocity, v. f. d. u c (k=2) [Pa] [ C] [ C] [m/s] [Hz] [m/s] [m/s] last first AC-1746 Standard: ISO/IEC Page 1 of 2

76 EQUIPMENT USED Serial Number Description Njord 2 Wind tunnel, blockage factor = Control cup anemometer - Mounting tube, D = 12.7 mm TT004 Summit RT-AUI, wind tunnel TP001 Summit RT-AUI, differential pressure box DP007 Setra Model 239 pressure transducer HY003 Dwyer Instruments RHP-2D20 humidity transmitter BP002 Setra Model 278 barometer PL4 Pitot tube XB001 Computer Board. 16 bit A/D data acquisition board 66GSPS1 PC dedicated to data acquisition Traceable calibrations of the equipment are carried out by external accredited institutions: TRANSCAT, Atlantic Scale, & Furness Controls. A real-time analysis module within the data acquisition software detects pulse frequency. Photo of the wind tunnel setup. The cross-sectional area is 2.5 x 2.5 m. UNCERTAINTIES The documented uncertainty is the total combined uncertainty at 95% confidence level (k=2) in accordance with EA- 4/02. The uncertainty at 10 m/s comply with the requirements in the IEC :2005 procedure. See Document US for further details. Certificate number: 15.US This certificate must not be reproduced, except in full, without the approval of SOH Wind Engineering LLC Page 2 of 2
77

 Annex F Approved by: Calibration engineer, rds Standard uncertainty, slope: 0.")
 [Pa] [ C] [ C] [m/s] [Hz] [m/s] [m/s] 2 10.")
78 SOH Wind Engineering LLC 141 Leroy Road Williston, VT USA Tel Fax CERTIFICATE FOR CALIBRATION OF CUP ANEMOMETER Certificate number: 16.US Date of issue: February 9, 2016 Type: RNRG 40C Anemometer Serial number: Manufacturer: Renewable NRG Systems Inc, 110 Riggs Road, Hinesburg, VT 05461, USA Client: Renewable NRG Systems Inc, 110 Riggs Road, Hinesburg, VT 05461, USA Anemometer received: February 2, 2016 Anemometer calibrated: 12:54 February 9, 2016 Calibrated by: mej Certificate prepared by: Software Revision 7 Calibration equation obtained: v [m/s] = f [Hz] Procedure: MEASNET, IEC :2005(E) Annex F Approved by: Calibration engineer, rds Standard uncertainty, slope: Standard uncertainty, offset: Covariance: (m/s)²/hz Coefficient of correlation: Absolute maximum deviation: m/s at m/s Barometric pressure: hpa Relative humidity: 11.8% Succession Velocity Temperature in Wind Frequency, Deviation, Uncertainty pressure, q. wind tunnel d.p. box velocity, v. f. d. u c (k=2) [Pa] [ C] [ C] [m/s] [Hz] [m/s] [m/s] last first AC-1746 Page 1 of 2

79 EQUIPMENT USED Serial Number Description Njord 2 Wind tunnel, blockage factor = Control cup anemometer - Mounting tube, D = 12.7 mm TT002 Summit RT-AUI, wind tunnel TP001 Summit RT-AUI, differential pressure box DP008 Setra Model 239 pressure transducer HY002 Dwyer Instruments RHP-2D20 humidity transmitter BP002 Setra Model 278 barometer PL3 Pitot tube XB001 Computer Board. 16 bit A/D data acquisition board 66GSPS1 PC dedicated to data acquisition Traceable calibrations of the equipment are carried out by external accredited institutions: Atlantic Scale, & Furness Controls. A real-time analysis module within the data acquisition software detects pulse frequency. Photo of the wind tunnel setup. The cross-sectional area is 2.5 x 2.5 m. UNCERTAINTIES The documented uncertainty is the total combined uncertainty at 95% confidence level (k=2) in accordance with EA- 4/02. The uncertainty at 10 m/s comply with the requirements in the IEC :2005 procedure. See Document US for further details. Certificate number: 16.US This certificate must not be reproduced, except in full, without the approval of SOH Wind Engineering LLC Page 2 of 2

80
81 SOH Wind Engineering LLC 141 Leroy Road Williston, VT USA Tel Fax CERTIFICATE FOR CALIBRATION OF ANEMOMETER Certificate number: 15.US Date of issue: January 8, 2015 Type: NRG #40C Serial number: Manufacturer: Renewable NRG Systems Inc, 110 Riggs Road, Hinesburg, VT 05461, USA Client: Renewable NRG Systems Inc, 110 Riggs Road, Hinesburg, VT 05461, USA Anemometer received: December 23, 2014 Anemometer calibrated: January 8, 2015 Calibrated by: mej Certificate prepared by: Software Revision 3 Calibration equation obtained: v [m/s] = f [Hz] Calibration procedure: IEC :2005(E) Annex F Approved by: Calibration engineer, rds Standard uncertainty, slope: Standard uncertainty, offset: Covariance: (m/s)²/hz Coefficient of correlation: Absolute maximum deviation: m/s at m/s Barometric pressure: hpa Relative humidity: 8.5% Succession Velocity Temperature in Wind Frequency, Deviation, Uncertainty pressure, q. wind tunnel d.p. box velocity, v. f. d. u c (k=2) [Pa] [ C] [ C] [m/s] [Hz] [m/s] [m/s] last first AC-1746 Standard: ISO/IEC Page 1 of 2

82 EQUIPMENT USED Serial Number Description Njord 1 Wind tunnel, blockage factor = Control cup anemometer - Mounting tube, D = 12.7 mm TT001 Summit RT-AUI, wind tunnel TP001 Summit RT-AUI, differential pressure box DP005 Setra Model 239 pressure transducer HY002 Dwyer Instruments RHP-2D20 humidity transmitter BP001 Setra Model 278 barometer PL7 Pitot tube XB002 Computer Board. 16 bit A/D data acquisition board 9PRZRW1 PC dedicated to data acquisition Traceable calibrations of the equipment are carried out by external accredited institutions: TRANSCAT, Atlantic Scale, & Furness Controls. A real-time analysis module within the data acquisition software detects pulse frequency. Photo of the wind tunnel setup. The cross-sectional area is 2.5 x 2.5 m. UNCERTAINTIES The documented uncertainty is the total combined uncertainty at 95% confidence level (k=2) in accordance with EA- 4/02. The uncertainty at 10 m/s comply with the requirements in the IEC :2005 procedure. See Document US.DC.016 for further details. Certificate number: 15.US This certificate must not be reproduced, except in full, without the approval of SOH Wind Engineering LLC Page 2 of 2


83
84 APPENDIX D: Statements of Operation
85
86