Overview of Global Climate Change. Barry Lefer University of Houston 29 Jan 2007
|
|
|
- Garey Jonathan Holmes
- 5 years ago
- Views:
Transcription

1 Overview of Global Climate Change Barry Lefer University of Houston 29 Jan 2007

2

3
4
5 Global CO snapshot MOPPITT satellite October 3, 2003

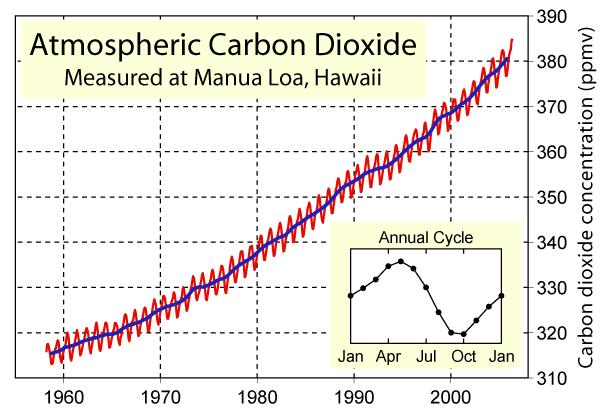
6 More Recent carbon dioxide
 T F = (1.")
7 Temperature Scales Gabriel Fahrenheit Anders Celsius William Thomson T C = 0.55 (T F 32) T F = (1.8 *T C ) + 32 Ave Temp = 15 C = 59 F Typical Range = 0-30 C = F

8 Earth s Radiation Budget 31 C Warmer 96% longwave

9 Shortwave vs. Longwave radiation Note: Earth magnified 2,850,000 times.

10 Greenhouse effect: Earth and Venus
11 Climate vs. Weather Weather Shorter-term fluctuations in atmospheric environment (e.g., temp, press, ws, wdir, rainfall amount, etc) Hours, Days, Weeks Specific location for specific time Climate Longer-Term Changes broad composite of average (or mean) condition of a region (e.g., temp, rainfall, snowfall, ice cover, winds) Years (and longer) Mean state of a specific region (e.g., continent, ocean, or entire planet)

12 Components of Climate System

13 Interactions between Climate System Components
14 Some basic reactions Organic-C + O 2 CO 2 + H 2 O + heat H 2 O + CO 2 C 6 H 12 O 6 + O 2 Organic-C + O 2 CO 2 + H 2 O + heat + NO + SO 2 NO HNO 3 SO 2 H 2 SO 4 sulfate aerosol NO + Organic-C + sunlight O 3
15 Climate System Response
16 Response Times
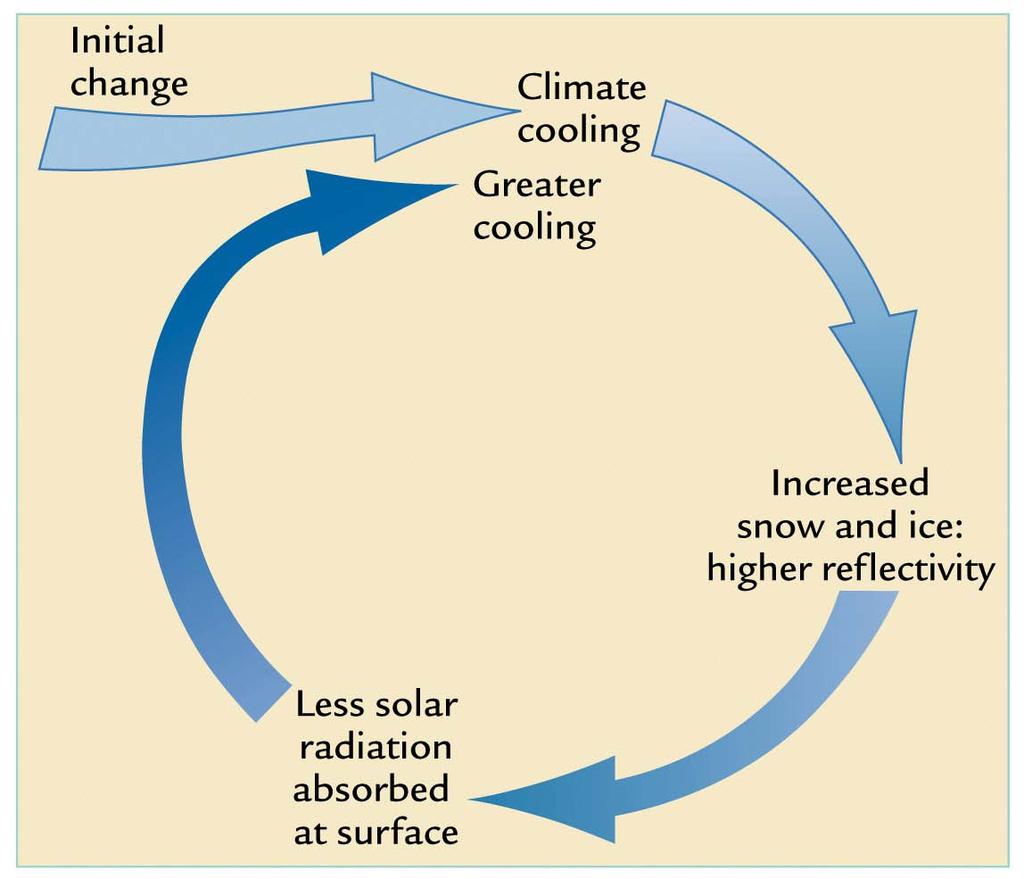
17 Albedo-Temperature Feedback

18 Albedo-Temperature Feedback

19 Albedo-Temperature Feedback
20 Water vapor feedback

21 Time Scales of Climate Change


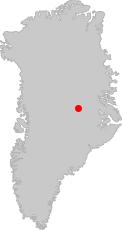
22 Coring Earth s ice sheets


23 Bubbles Trapped in ice core

24 Ice core record
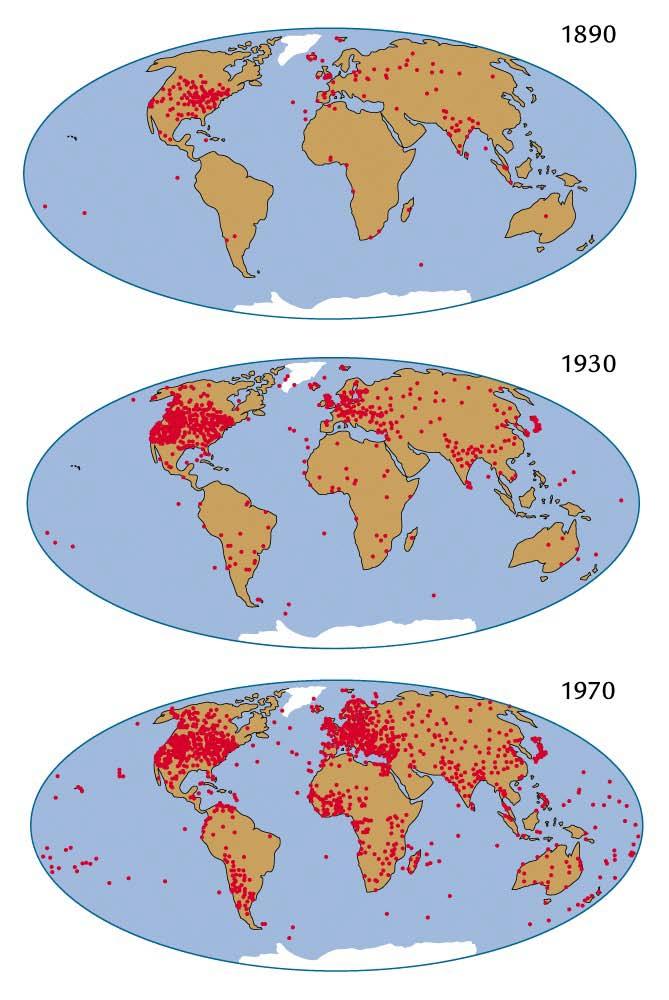
25 Temperature stations


26 Change in surface temperature in 20 th century


27 Volcanic cooling and El Nino warming

28 Retreat of mountain glaciers

29

30 Melting of Greenland Icesheet


31 Global rise in sea level last 20,000 years

32 Global rise in sea level in the 20 th century
33 Project future rise in sea level
34 Anthropogenic CO2

35 Pre-industrial and anthropogenic CO2


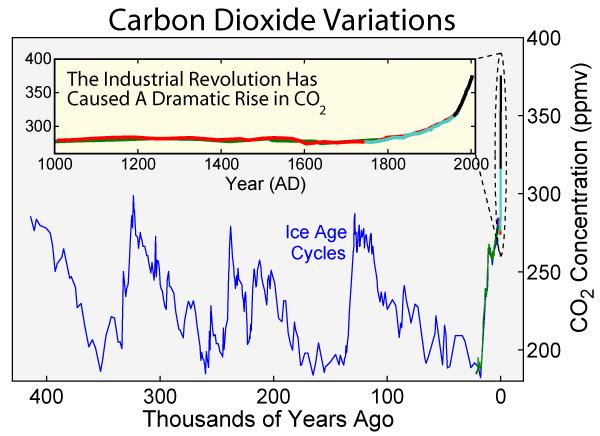
36 Ice core CO 2 record

37 Observed temperature changes

38 Natural warming and greenhouse effects

39 Natural temperature changes

40 Temperature increases caused by humans?

41 Response to abrupt CO 2 and SO 2 emissions?

42 Response to abrupt CO 2 and SO 2 emissions?

43 Response to abrupt CO 2 and SO 2 emissions?

44 How does the U.S. rank?

45 How does the U.S. rank?

46 Climate change in the next 100 to 1000 years Estimated present-day reserves of fossil fuels (mainly coal) should last for another few hundred years and will add far more CO 2 to the atmosphere than has accumulated so far. Unless technology or conservation efforts reduces this excess emission of CO 2 to the atmosphere, atmospheric CO 2 will increase within the next 200 years to levels 2X 4X pre-industrial levels. Resulting in CO 2 levels comparable to 10s of millions of years ago in warmer greenhouse worlds. This warming will overwhelm natural variations in climate and could cause climatic and environmental changes unprecedented in human experience. As regional patterns of temperature and precipitation change, impacts on human populations will vary from favorable to unfavorable by region and season. Atmospheric CO 2 levels will remain high for 1000 years or more, until the ocean absorbs the excess CO 2.
47 Greenhouse and natural changes Inherent uncertainties make it difficult to predict climate over the next few decades. However, 50 yrs from now, as equivalent-co 2 concentrations approach 2X the pre-industrial value, climate change will have overwhelmed natural variability. Impact of our unintended experiment should be obvious, and debate over Earth s sensitivity to ghg will have been settled.

48 Greenhouse and natural changes Natural climatic variability over a few years (i.e., El Nino, volcanic eruptions), represent only brief departures from longer-term underlying trends. These short oscillations are irrelevant to projections over next 1000 years. Global temp. changes produced by all natural causes unlikely to reach 1 C over next 1000 years. Projected ghg warming for same interval is between 2-8 C, with a likely value of 4-5 C.
49 Projected Carbon Emissions Atmospheric CO 2 levels continue to rise at rate of 1.5 ppm (0.4%) per year because of fossil fuel combustion and clearing of forests. Rate of increase will probably accelerate in future, but at unknown rates. Uncertainties center on two issues: 1) How much carbon will human activities emit? 2) How will Earth system distribute this additional CO 2 among its atmospheric, oceanic and terrestrial reservoirs of carbon? Projections of future carbon emissions based on three factors: 1) Population 2) Emissions per person 3) Carbon use efficiency (CUE) %Δ carbon emissions = %Δ population x %Δ emissions/person x %Δ CUE
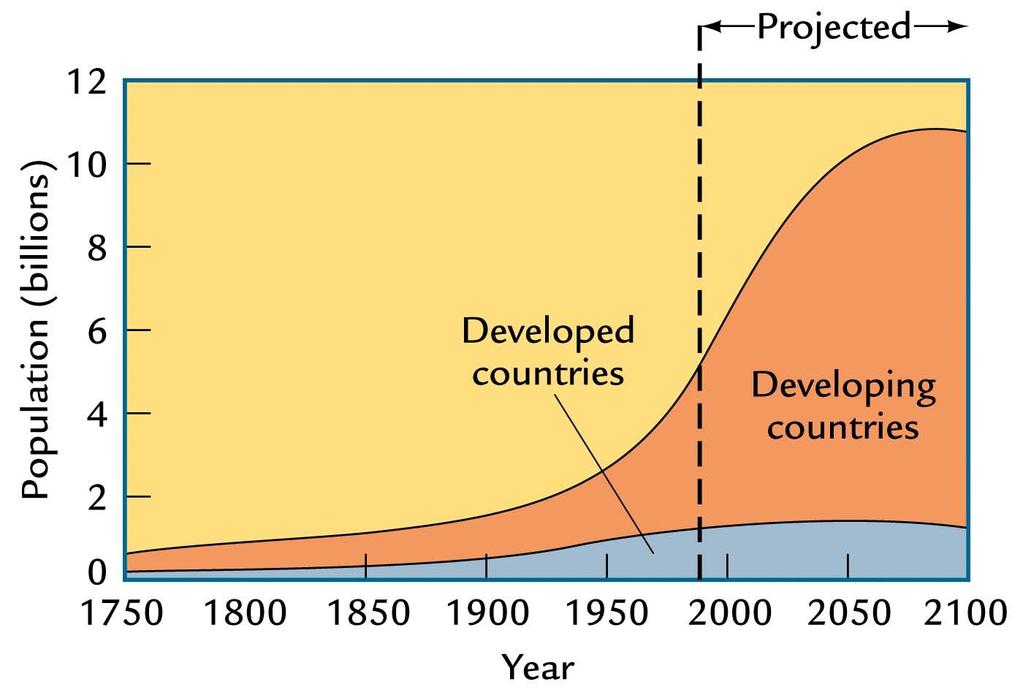
50 Future Population
51 Emissions per person Emissions per person is linked to the average standard of living. In many nations, standards of living increase over time, and in the past this process has required more carbon-based fuel for industrialization and day-to-day individual consumption (for cars and home heating or cooling). In the near term, largest changes will occur in SE Asia as nations moving from semiindustrialized economies to join industrialized nations. Some developing countries will also move from farm-based economies to semiindustrialized status.
52 What can you do? Buy a fuel-efficient car Take mass transit (bicycle or walk) to work Car-pool Take a look at other ways in which you waste energy at home or at work Education: Learn more about this issue.
53 What can you do? Buy products from companies that are trying to reduce their own impact on the climate (e.g., Wal-Mart, Green Mountain Energy) In October 2005, CEO H. Lee Scott announced a goal to transform Wal-Mart into a company that runs on 100 percent renewable energy and produces zero waste. In addition, he recently articulated commitments: - to cut the corporation's greenhouse-gas emissions by 20 percent over the next seven years, - double the fuel efficiency of its truck fleet within 10 years, - reduce solid waste from U.S. stores by 25 percent in the next three years - double offerings of organic foods this spring, selling them at prices more affordable to the masses.
54 Websites for more information Feb 2 nd 2007 Assessment gcmd.gsfc.nasa.gov Global Climate Change Master Directory U.S. Global Change Data and Information System

55 Global CO snapshot MOPPITT satellite October 3, 2003

56

57

58 More Recent carbon dioxide

59

60

61

62


63 Contact Information Barry Lefer