Arrow Reservoir Constant Mid-Elevation Scenarios: Scoping Evaluation
|
|
|
- Russell Holt
- 5 years ago
- Views:
Transcription
1 Arrow Reservoir Constant Mid-Elevation Scenarios: Scoping Evaluation September 12, 2016 Fauquier Community Hall Presented by: Alan Thomson Mountain Station Consultants Inc., Nelson, B.C. Bill Green Canadian Columbia River Inter-tribal Fisheries Commission, Cranbrook, B.C. Greg Utzig Kutenai Nature Investigations Ltd., Nelson, B.C. Nicole Kapell Ktunaxa Nation Council, Cranbrook, B.C.

2 Arrow Reservoir Management Scoping Evaluation of 2 Alternative Scenarios Evaluation of two scenarios, including : potential benefits and negative impacts information gaps scenario alternatives to increase benefits and/or offset impacts criteria for assessing future modeling 2
3 Assessment Criteria Vegetation Wildlife Fish and aquatic resources Recreation Agriculture Erosion Archaeology Commercial navigation Power generation Flood Storage 3

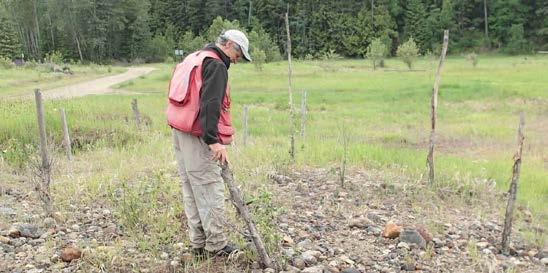
4 Information Sources Literature review Selected data analysis Interviews with and reviews by experts and stakeholders Site visits 4
5 Arrow Lakes Pre and Post Regulation 1,455 1,450 1,445 1,440 Pre-regulation Pre-regulation average Post regulation Post regulation average 1,435 1,430 1,425 1,420 Elevation (ft) 1,415 1,410 1,405 1,400 1,395 1,390 1,385 1,380 1,375 1,370 1-Jan 1-Feb 1-Mar 1-Apr 1-May 1-Jun 1-Jul 1-Aug 1-Sep 1-Oct 1-Nov 1-Dec 5
 Streams 52 ha (93 km) Uplands 3844")

6 Dam Footprint Impacts - Examples Ecosystems and Habitat Lakes 34,992 ha Wetlands/ Ponds 3,535 ha Rivers/Floodplains 8,849 ha (110 km) Streams 52 ha (93 km) Uplands 3844 ha Farmland/ Orchards 2,300 ha of active agricultural lands 260 farmsteads Numerous rural communities and infrastructure C. Spicer From: Utzig and Schmidt 2011 and Penfold
7 Pre Regulation Hydrograph Elevation of Reservoir (feet) 1,450 1,445 1,440 1,435 1,430 1,425 1,420 1,415 1,410 1,405 1,400 1,395 1,390 1,385 1,380 1,375 ~21 ft Pre Regulation Average Jan Feb Mar Apr May Jun Jul Aug Sep Oct Nov Dec 7
8 Post Regulation Hydrograph Elevation of Reservoir (feet) 1,450 1,445 1,440 1,435 1,430 1,425 1,420 1,415 1,410 1,405 1,400 1,395 1,390 1,385 1,380 1,375 ~41 ft Post Regulation Average Jan Feb Mar Apr May Jun Jul Aug Sep Oct Nov Dec 8
9 Scenario 1 Elevation of Reservoir (feet) 1,450 1,445 1,440 1,435 1,430 1,425 1,420 1,415 1,410 1,405 1,400 1,395 1,390 1,385 1,380 1,375 Post Regulation Average S1: 1 of 5 yrs S1: 4 of 5 yrs Jan Feb Mar Apr May Jun Jul Aug Sep Oct Nov Dec 9
10 Scenario 2 Elevation of Reservoir (feet) 1,450 1,445 1,440 1,435 1,430 1,425 1,420 1,415 1,410 1,405 1,400 1,395 1,390 1,385 1,380 1,375 S2: 1 in 7 yrs S2: 6 of 7 yrs Post Regulation Average Jan Feb Mar Apr May Jun Jul Aug Sep Oct Nov Dec 10
11 Scenarios 1 & 2 Elevation of Reservoir (feet) 1,450 1,445 1,440 1,435 1,430 1,425 1,420 1,415 1,410 1,405 1,400 1,395 1,390 1,385 1,380 1,375 S2: 1 in 7 yrs S1: 1 of 5 yrs S1: 4 of 5 yrs S2: 6 of 7 yrs Post Regulation Average Pre Regulation Average Jan Feb Mar Apr May Jun Jul Aug Sep Oct Nov Dec 11

12 Scenario 2 Scenario 1 Reservoir Operations Scenario 1 reservoir generally held at approx. 1,425 dips to approx. 1,421 in spring and late fall fills to 1,444 at freshet in 1 of 5 years on average empties slowly over a couple months or more Scenario 2 reservoir generally held at approx. 1,420 fills to 1,444 at freshet in 1 or 7 years on average empties down to 1,430 within 35 days, and then slowly to 1,420 over the next couple months 12

13 Scenario Issue Evaluation When compared to existing ALR operation o Positive Neutral / No effect Negative? Unknown / Uncertain 13
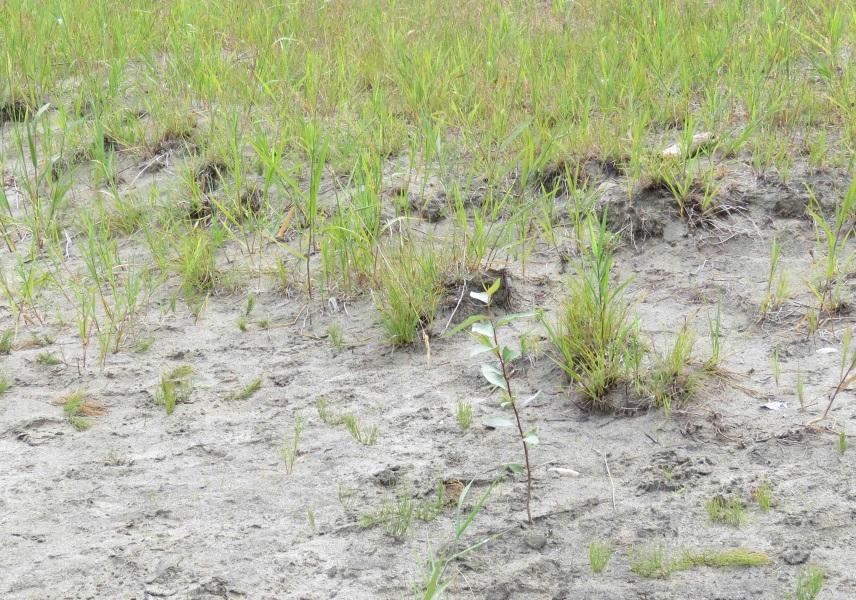
14 Vegetation 14
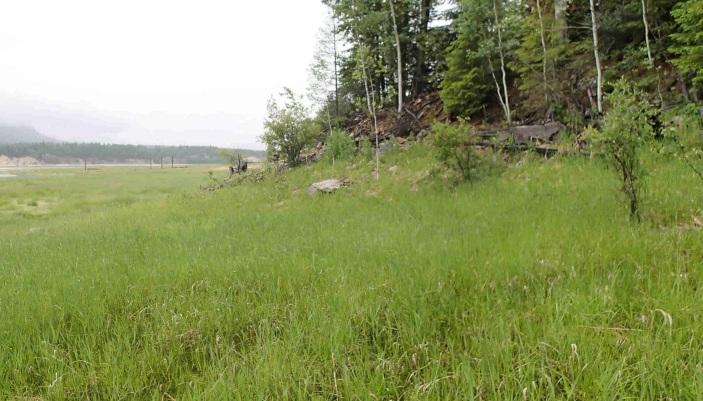
15 Current vegetation mostly limited to herbaceous grass and sedges below 1,440 due to lengthy inundation and wave scour limited development of trees and shrubs in upper 4 ft. of drawdown zone Vegetation Scenario 1 herbaceous vegetation increases cover and vigour above 1,425 species diversity increases during nonflood years and then decreases after flood years somewhat reduced vegetation loss due to wave/debris scour tree/shrub communities do not develop S1 Evaluation: Terrestrial: + Wetland: + Scenario 2 herbaceous vegetation increases in diversity, cover and vigour above 1,420 species diversity decreases slightly after flood years significantly reduced vegetation loss due to wave/debris scour tree/shrub and riparian communities develop above 1,430 S2 Evaluation: Terrestrial: +++ Wetland: ++ 15

16 Wildlife - Songbirds Current songbird diversity and abundance significantly limited due to the lack of tree/shrub habitats significant mortality due to nest flooding Scenario 1 minor increase in grassland songbird species due to increase in herbaceous cover decrease in nest losses in non-flood years S1 Evaluation: + Scenario 2 significant increase in songbird species diversity and abundance due to increase in tree/ shrub communities and increased availability of wetland and riparian habitats decrease in nest losses in non-flood years S2 Evaluation: ++ 16

17 Wildlife Waterbirds and Shoreline Birds Current limited access to shoreline, wetland and pond habitats due to periodic spring, summer and fall inundation nesting failures due to nest flooding Scenario 1 complete access to wetland, pond and shoreline habitats above 1,425 in 4 of 5 years establishment of semi-permanent shoreline habitats at approx. 1,425 reduced nesting losses due to flooding in non-flood years S1 Evaluation: ++ Scenario 2 complete access to wetland, pond and shoreline habitats above 1,420 in 6 of 7 years establishment of semi-permanent shoreline habitats at approx. 1,420 reduced nesting losses due to flooding in non-flood years development of riparian habitats above 1,430 S2 Evaluation:


18 Wildlife - Herptiles Current limited use by frogs, toads, turtles and snakes mainly in Revelstoke Reach wetlands/ponds habitat access limited by spring/summer/fall inundation Scenario 1 during non-flood years, increased yearround habitat access for all species above 1,425 during flood years access limited by spring/summer/fall inundation S1 Evaluation: + Scenario 2 during non-flood years, increased yearround habitat access for all species above 1,420 during flood years access limited by spring/ early summer short duration inundation increased riparian and other tree/ shrub habitats likely decrease of grassland habitat for some snakes S2 Evaluation: ++ 18

19 Wildlife - Mammals Current small mammals and bats frequently use the drawdown zone use by large mammals is limited and sporadic Scenario 1 mammal use may increase slightly in non-flood years due to increased vegetation cover S1 Evaluation: o Scenario 2 potentially significant increase in mammal use due to development of riparian habitats and tree/ shrub communities availability of browse and cover will contribute to increased mammal use likely will contribute to ungulate winter range a key limiting factor S2 Evaluation: + 19

20 Agriculture Current agricultural production limited to grazing and hay production on approx. 400 ha in the Revelstoke reach limitations due to inundation during the growing season and occasional inwashed debris Scenarios 1 and 2 agricultural production potential would increase in areas above 1,425 (S1) or 1,420 (S2) principally in the Revelstoke reach, but also in small local areas in other parts of the reservoir potential for annual crops in non-flood years productivity would increase significantly in nonflood years due to lack of annual inundation S1 Evaluation: + S2 Evaluation:

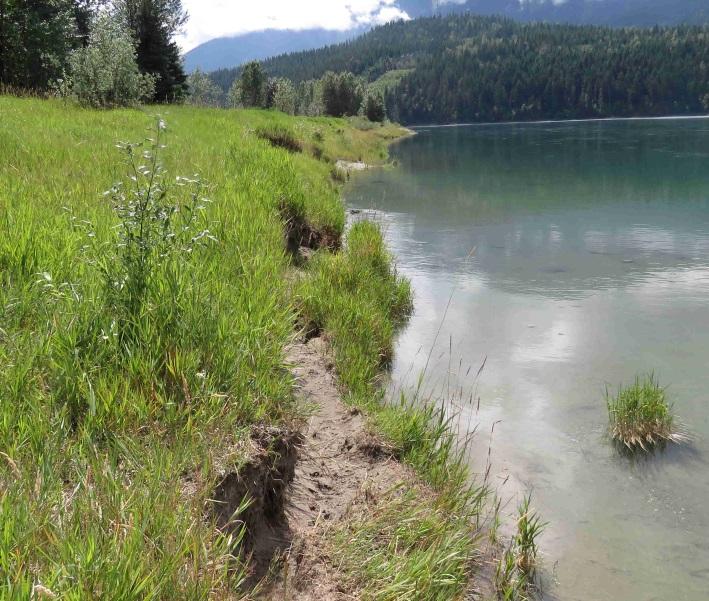
21 Erosion and Sediment Deposition 21
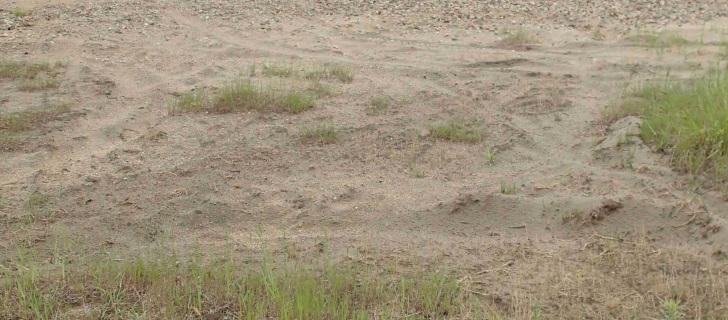
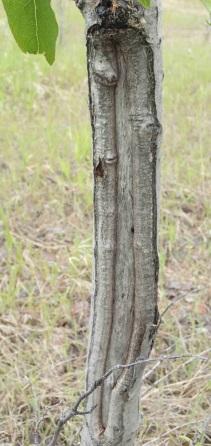
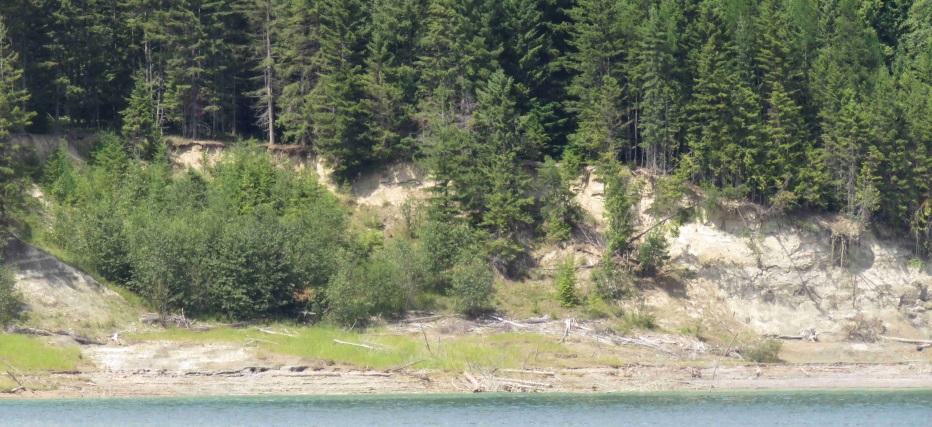
22 Erosion, Sediment Deposition & Slumping Current ongoing bank erosion and slumping in fine textured terrace faces sediment deposition on flooded stream fans significant erosion and redistribution of sediments in waveexposed zones localized and periodic erosion due to debris pounding dust generation Scenario 1 above 1,425 somewhat decreased erosion due to lack of inundation 4/5 years decreased erosion below 1,421 due to lack of exposure to wave action ongoing erosion and beach formation at 1,425 reduction in dust generation uncertain as to changes to mass wasting events S1 Evaluation: Shoreline: + Mass Wasting:? Scenario 2 decreased erosion above 1,430 due to revegetation and above 1,420 due to lack of inundation 6/7 years decreased erosion below 1,420 due to lack of exposure to wave action ongoing erosion and beach formation at 1,420 greater reduction in dust generation uncertain as to changes to mass wasting events S2 Evaluation: Shoreline: +++ Mass Wasting:? 22

23 Fish Pelagic (open water) Current fisheries production variable, supported by nutrient restoration and expanded pelagic (open/deep lake) area during the growing season effects of current operations on nutrient dynamics complex and highly variable year over year Scenarios 1 and 2 net reduction in pelagic (kokanee, etc.) habitat area during productive late spring-summer for S1, greater reduction for S2 high degree of uncertainty regarding impacts on nutrient retention and primary productivity uncertain effects on kokanee and piscivores abundance S1 Evaluation:? S2 Evaluation:? 23

24 Fish Tributary Access/ Spawning/ Rearing Current water levels sometimes impair fall spawner access to tributaries tributary spawning success limited due to stream channel instability and reservoir level fluctuations access changes will vary from tributary to tributary, overall effect likely negative for fall spawners modest improvement in tributary spawning and incubation habitat conditions within the drawdown reaches Scenarios 1 and 2 improved access into tributaries as channel stability improves significantly due to riparian vegetation significant improvement in spawning and incubation habitat conditions S1 Evaluation: +/- S2 Evaluation: ++ 24
 significantly impaired Scenarios 1 and 2 significant improvement in littoral habitat conditions and productivity ; may result in increased")
25 Aquatic Littoral Habitats Current significantly impaired and unstable littoral (shoreline/shallow water) habitats. development of macrophyte communities (aquatic vegetation) significantly impaired Scenarios 1 and 2 significant improvement in littoral habitat conditions and productivity ; may result in increased nutrient retention expansion of macrophyte communities (aquatic vegetation) possibly increased support for invasive species (e.g. northern pike) S1 Evaluation: -/+ S2 Evaluation: -/+ 25

26 Aquatic Large River Productivity Current riverine habitat at upper end of Revelstoke Reach only occurs seasonally habitat conditions and productivity impaired by reservoir operations and peaking at Revelstoke Dam Scenario 1 longer length of riverine habitat during productive late spring to early fall benefits are uncertain due to overall negative effects of Revelstoke Dam peaking Scenario 2 longer length of riverine habitat during productive late spring-early fall when compared to current operations and S1 benefits are uncertain due to overall negative effects of Revelstoke Dam peaking S1 Evaluation:? S2 Evaluation:? 26

27 Aquatic Burbot and sturgeon Current Current operations unlikely to affect burbot spawning and incubation White sturgeon spawning and incubation habitat at Revelstoke affected by hydro peaking and reservoir operations Scenarios 1 and 2 Unlikely to affect burbot in comparison to current Likely beneficial for sturgeon spawning and incubation; uncertain for larval dispersal S1 Evaluation: +/? S2 Evaluation: +/? 27
28 Archaeology Current archaeological sites in and around the reservoir have been recorded between 1,407 and 1,500 sites within the drawdown zone are regularly disturbed and destroyed by wave action erosion exposure of artifacts leads to loss to pothunters Scenario 1 sites below 1,420 would be inundated sites between 1,420 and 1,426 (1,430 some locations) would likely be destroyed by continuous wave action without mitigation efforts erosion of sites above 1,426 would be decreased due to lack of inundation in 4 of 5 years; but pot-hunting may increase S1 Evaluation: + Scenario 2 sites below 1,419 would be inundated sites between 1,419 and 1,421 (1,425 in some locations) would likely be destroyed by continuous wave action without mitigation efforts erosion of sites above 1,422 would be decreased due to lack of inundation in 6 of 7 years; pot-hunting should decrease above 1,421 due to revegetation S2 Evaluation: ++ 28


29 Commercial Navigation Current log towing operates with no limitation with reservoir >1,420 minor limitations to towing when reservoir 1,410-1,420 major limitations to towing when reservoir < 1,410 Scenarios 1 and 2 exceeds minimum elevation for full tows through the Narrows no days with limitations to log towing significant improvement in log dump efficiency and safety S1 Evaluation: +++ S2 Evaluation:

30 Power Generation Arrow Lks. Gen. Station Current as reservoir elevations vary through the year, power generation at ALGS increases with increasing elevation and discharge, and decreases with lower elevations and lessor discharge Scenario 1 modelling suggests moderate increase in average power production over current production at ALGS S1 Evaluation: + Scenario 2 modelling suggests power production roughly equal to current production at ALGS S2 Evaluation: o 30
 Scenarios 1 and 2 in flood years storage of 2.8 million acre-ft (S1) and 2.")
31 Flood Storage Current since 2008, annual storage has ranged from million acre-ft maximum storage capacity is 7.1 million acre-ft (1,378-1,444 ) Scenarios 1 and 2 in flood years storage of 2.8 million acre-ft (S1) and 2.9 million acre-ft (S2) S1 Evaluation: - - S2 Evaluation: - -/

32 Boat-based Recreation Current main concern is boat ramps that are accessible at all elevations some launches now not available at extreme low water no strong preference for specific elevation slight aversion to very low and very high elevations Scenarios 1 and 2 increased certainty in non-flood years boat ramps available all year likely improved beach development potentially decreased boat launch maintenance costs S1 Evaluation: +/o S2 Evaluation: +/o 32

33 Shoreline-based Recreation Current shoreline land owners are unhappy with current regime most would prefer constant elevation at 1,430-1,435 shoreline-based marinas unhappy with current regime especially extreme low water Scenarios 1 and 2 not shoreline land owners preferred regime, but could adapt preferable to present regime; would be more agreeable with mitigation assistance shoreline-based marinas would benefit from certainty in non-flood years; concern regarding current in Narrows and near dam S1 Evaluation: ++/- S2 Evaluation: ++/- 33
 likely decreased maintenance costs to trails and other facilities S1 Evaluation: + S2")
34 Terrestrial Recreation Current limited access to drawdown area due to annual inundations, especially during spring and summer more area available when water very low Scenarios 1 and 2 year-round access for activities in non-flood years increase in available area except winter/early spring (greater in S2) likely decreased maintenance costs to trails and other facilities S1 Evaluation: + S2 Evaluation: ++ 34
35 Conclusions Scenario 1 Scenario 2 Vegetation Terrestrial Wetland + ++ Wildlife Herptiles + ++ Songbirds + ++ Water/shoreline birds Mammals o + Fisheries Pelagic productivity?? Pelagic fish?? Tributary access - ++ Tributary spawn/rear + ++ Littoral habitat + + Macrophytes & Invasive spp. - - Large River Productivity?? + relative benefits - relative negative impacts o changes are neutral? effects uncertain 35
36 Conclusions Scenario 1 Scenario 2 Fisheries (cont d) Burbot & sturgeon +/? +/? Recreation Boating +/o +/o Shoreline ++/- ++/- Terrestrial + ++ Agriculture Erosion Shoreline Mass Wasting?? Archaeology +/? ++/? Commercial Navigation ALGS Power Gen. + o Flood Storage relative benefits - relative negative impacts o changes are neutral? effects uncertain 36

37 Suggested Further Work Review of concept by community and experts Vegetation response to inundation depth and duration Fisheries responses to scenarios Refinement of agricultural potential Identification of erosion hazards at 1,420 and 1,425 Detailed power generation and flood control modelling Modeling of down stream flows and system-wide impacts of the options 37
38