GE 2211 Environmental Science and Engineering Unit I Energy Resources. M. Subramanian
|
|
|
- Shona Jefferson
- 5 years ago
- Views:
Transcription
1 GE 2211 Environmental Science and Engineering Unit I Energy Resources M. Subramanian Assistant Professor Department of Chemical Engineering Sri Sivasubramaniya Nadar College of Engineering Kalavakkam , Kanchipuram (Dist) Tamil Nadu, India msubbu.in[at]gmail.com 6-July-2009
2 Contents energy resources: growing energy needs, renewable and non renewable energy sources, use of alternate energy sources case studies 06-July-2009 M Subramanian
3 Coal Readily combustible material, black or brownish-black material Coal was formed from layer upon layer of annual plant remains accumulating slowly that were protected from biodegradation by usually acidic covering waters that gave a natural antiseptic effect combating microorganisms and then later mud deposits protecting against oxidization Coal, a fossil fuel, is the largest source of energy for the generation of electricity worldwide, as well as one of the largest worldwide anthropogenic sources of carbon dioxide emissions Approximately 40% of the world electricity production uses coal To last for another 200 years, at the present rate of utilization 06-July-2009 M Subramanian
4 Types of Coal Peat a precursor of coal Lignite brown coal, the lowest rank of coal, exclusively used for electricity generation Sub-bituminous coal used as fuel for electricity generation, synthesis of light aromatic hydrocarbons Bituminous fuel for electricity, coke Anthracite residential and commercial space heating Graphite difficult to ignite, used for producing lubricants 06-July-2009 M Subramanian

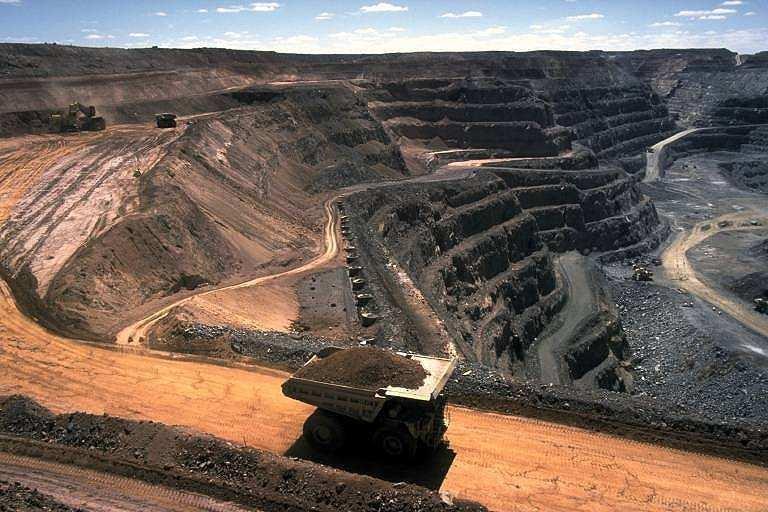
5 Coal Coal mining: 14-May July-2009 M Subramanian
6 Environmental Effects of Coal Usage Release of carbon dioxide Coal is the largest contributor to the human-made increase of CO 2 in the air Generation of hundred of millions of tons of waste products, including fly ash, bottom ash, flue gas desulfuriation sludge, that contain mercury, uranium, thorium, arsenic, and other heavy metals Acid rain from high-sulfur coal Dust nuisance 06-July-2009 M Subramanian
7 Fossil Fuel Reserves Coal -1 trillion ton (as on 2003) Rank Country % share 1 USA 25.4 Oil -0.2 trillion m 3 (in 2003) Saudi Arabia the largest share of 23% 2 Russia China India 8.6 Coal reserves Gas -176 trillion m 3 (2003) ~ 0.16 trillion ton Russia has the largest share of 27% 06-July-2009 M Subramanian
8 Energy Content of Fuels Coal: energy content ~ 24 GJ/Ton (6.67 kw h/kg) The typical thermodynamic efficiency of coal power plants is about 30%, so of the 6.67 kw h of energy per kilogram of coal, 30% of that 2.0 kw h/kg can successfully be turned into electricity; the rest is waste heat. So coal power plants obtain approximately 2.0 kw h per kilogram of burned coal. Oil: 42 GJ/Ton Natural Gas: 54 GJ/Ton 06-July-2009 M Subramanian
9 Energy Usage Distribution 06-July-2009 M Subramanian
10 Energy Usage Distribution The world average energy consumption per person is equivalent to 2.2 ton of coal per year (~ 1 ton of oil) In industrialized countries people use four to five time more than the world average An American uses 32 times more commercial energy than an Indian 06-July-2009 M Subramanian

11 Rate of world energy usage in terawatts (TW) ( ) 06-July-2009 M Subramanian Global energy consumption rate (2006): 16 TW
12 Global Energy Usage (2006) 06-July-2009 M Subramanian
 The US consumes 25% of the world's energy (with a share of the world population at 5%).")
13 Energy Consumption Per capita (GNP) (2004) India: 0.7 kw; Bangladesh: 0.2 kw (least) The US consumes 25% of the world's energy (with a share of the world population at 5%). 06-July-2009 M Subramanian
14 Energy Use by Sector Industry (agriculture, mining, manufacturing, and construction) 37% Personal and commercial transportation 20% Residential heating, lighting, and appliances 11% Commercial uses (lighting, heating and cooling of commercial buildings, and provision of water and sewer services) 5% Energy losses in generation and transmission 27% 06-July-2009 M Subramanian

15 Available Renewable Energy 07-July-2009 M Subramanian


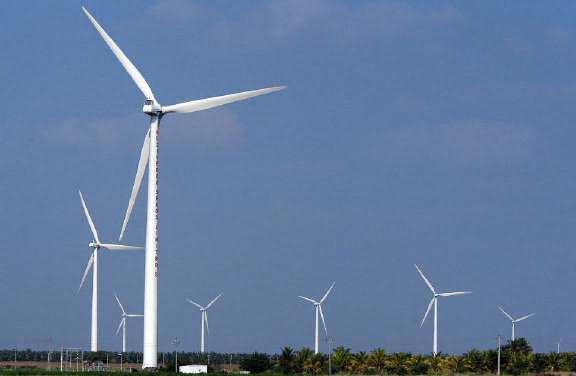
16 Wind Energy 07-July-2009 M Subramanian
17 Wind Power in India Wind power generation in India during : 1.1 GW Estimated wind power potential of India: 20 GW Wind power density map 07-July-2009 M Subramanian
 : 20,600 MW Target: 20 GW, by the year 2020 07-July-2009 M Subramanian")
18 Currently producing: Nuclear Power Plants in India Under construction (6 units) : 3160 MW Planned (10 units) : 20,600 MW Target: 20 GW, by the year July-2009 M Subramanian
19 Solar Power 07-July-2009 M Subramanian

20 Geothermal Energy 07-July-2009 M Subramanian

21 07-July-2009 M Subramanian
22 Geothermal Power - Status USA, Philippines, Italy, Mexico, Iceland Indonesia, Japan and New Zealand are the largest users of geothermal energy resources Currently there are an estimated 12,000 MW of direct use and over 8,000 MW of generating capacity in geothermal resources world-wide. To put geothermal generation into perspective, this generating capacity is about 0.4% of the World total installed generating capacity 07-July-2009 M Subramanian
23 CO 2 Emissions 07-July-2009 M Subramanian
24 Environmental Impacts of Energy Production The amount of energy consumed per capita standard of living. Demand for energy increases accordingly Most of our energy is currently produced from fossil fuels increase of CO 2 production Increase of CO 2 global warming, climate changes Current reserves of fossil fuels: Oil -40 years, Gas -70 years, Coal -250 years The alternatives are expensive at present little economic incentive to reduce consumption of fossil fuels 07-July-2009 M Subramanian
25 Environmental Impacts of Energy Production (contd.) Production and consumption of almost any type of energy have environmental impacts. Harvesting of fuel-wood, in particular, contributes to deforestation, soil erosion, and desertification. Use of fuel-wood as an energy source can also contribute to the accumulation of CO 2, the main greenhouse gas, both because burning fuel-wood produces CO 2, and because deforestation destroys an important CO 2 sink. Use of biomass in traditional stoves exposes the users, mainly women and children, to high levels of indoor air pollution. The environmental consequences of energy production and use also adds on to waste management. 07-July-2009 M Subramanian
26 CO 2 Release due to Fossil Fuel Consumption Global combustion of fossil fuels and other materials places almost 7 billion tons of carbon, in the form of carbon dioxide (CO 2 ), into the atmosphere each year. On average, Earth's oceans, trees, plants and soils absorb about one-half of this carbon. The balance remains in the air and is responsible for the annual increase. 07-July-2009 M Subramanian
27 Tracking CO 2 levels Each year since global measurements of CO 2 began, the amount of carbon dioxide in the atmosphere has increased. Scientific measurements of levels of CO 2 contained in cylinders of ice, called ice cores, indicate that the preindustrial carbon dioxide level was 278 ppm. That level did not vary more than 7 ppm during the 800 years between 1000 and 1800 A.D. Atmospheric CO 2 levels have increased from about 315 ppm in 1958 to 378 ppm at the end of 2004, which means human activities have increased the concentration of atmospheric CO 2 by 100 ppm or 36 percent. 07-July-2009 M Subramanian