Surviving the Local WIP: a practical guide on nutrient accounting for the Chesapeake Bay TMDL
|
|
|
- Harriet Morris
- 5 years ago
- Views:
Transcription

1 Surviving the Local WIP: a practical guide on nutrient accounting for the Chesapeake Bay TMDL
2 otos: Chesapeake Bay Program Welcome to the Webcast To Ask a Question Submit your question in the chat box located to the left of the slides. We will answer as many as possible during Q&A. To Answer a Poll Question Simply select the preferred option. For those viewing this session alongside several colleagues, respond in a manner that represents your organization as a whole. We ARE Recording this Session All comments and questions will be recorded and included in the archives. We Appreciate Your Feedback Fill out our evaluations our funders need to hear it! 2
3 otos: Chesapeake Bay Program Session Resources Today s presentation and resources will be posted at R1. Early Review Draft Technical Bulletin 9 R2. Weblinks to State and EPA WIP Guidance R3. Weblinks to State and Federal WIP Tools R4. Watershed Treatment Model R5. Updated ESD to MEP Spreadsheet for MD R6. LGAC Guide to WIP Process R7. Pdf of this presentation To Learn More About the Chesapeake Bay TDML, we recommend this webcast:
4 POLL Question 1 I am interested in the Bay-wide TMDL because I: work for a local government am a private consultant work for a state or federal regulatory agency work for a watershed or advocacy group other

5 Speaker Info Tom Schueler Chesapeake Stormwater Network and Chesapeake Bay Program Stormwater Coordinator Baltimore, MD


6 Visit: To learn how you can have access to: Discounted Webcasts Free One-day design workshops Intensive master stormwater design seminars Direct On-site technical assistance Self guided web-based learning modules
7 Webcast Agenda What we know about nutrients in stormwater A short primer on the Bay-wide TMDL and the WIP plans Recommended process for computing your local nutrient load 11 low cost strategies to reduce your local nutrient loads
8 Webcast Caveats & Ground Rules The opinions in this webcast are exclusively those of CSN Check with your state agency for updates on the WIP process While the process is frustrating, please no whining or hand-wringing Based on feedback, the webcast info will be expanded in a CSN Technical Bulletin
9 Technical Bulletin # 9 Nutrient Accounting Methods to Document Local Stormwater Load Reductions in the Chesapeake Bay Nutrients and the Chesapeake Bay Why we need to become nutrient accountants What we know about nutrients and stormwater Tools to estimate nutrient loads Defining the local baseline load Pollutant removal rates for urban BMPs * Strategy for achieving local load reductions Analyzing the cost of implementation * official CBP rates and proposed interim planning rates

10 Part 1: Urban Nutrients Where do they come from?

11 There are many sources of N and P in the urban environment
12 Much of the nitrogen in urban runoff is derived from atmospheric deposition, either in the form of dryfall or wetfall Relationship of Atmospheric Deposition to Urban Runoff Quality Nutrient Atmospheric Deposition 1 Stormwater Runoff Load 2 Pounds per impervious acre per year Total Phosphorus Total Nitrogen 13 to measured rates during Washington NURP Study (MWCOG, 1983) 2 Simple Method annual stormwater runoff loads for one acre of impervious cover (Schueler, 1987)

13 Other sources of nitrogen in urban runoff include: Washoff of fertilizers Nitrogen attached to eroded soils and streambanks Organic matter and pet wastes on IC
 75% of turf is home")
14 What we know about turf and its management in the Bay Watershed 3.8 million acres of turf Represents 9.5% of watershed area Exceeds area devoted to row crops (corn, wheat, soybeans) 75% of turf is home lawn
15 Nitrogen EMCs for different urban land covers Urban Land Cover Source; CWP, 2003 Total N (mg/l) Lawns 9.70 Highway 2.95 Streets (Variable) 1.40 Parking Lots 1.94 Rooftops 1.50 Runoff sampling shows that lawn runoff is very high in nitrogen. Also, rooftop runoff concentration shows effect of atmospheric deposition

16 What do we know about home lawns and nutrients? About 50% to 65% fertilize their yard 15 to 20% hire lawn care company Average of two applications per year 50% of homeowners over-fertilize Estimated N Fertilizer inputs by lawns: 215 million lbs/yr
17 Phosphorus EMCs for different urban land covers Urban Land Cover Source; CWP, 2003 Total P (mg/l) Lawns 1.90 Highway 0.60 Streets (Variable) 0.50 Parking Lots 0.16 Rooftops 0.12 The sources of phosphorus are more complex. While lawn runoff is high in nitrogen, atmospheric deposition is less important as a source of TP
18 Many sources of TP in urban runoff Blow in of organic matter onto impervious surfaces (leaves, pollen, clippings, flowers, etc.) Phosphorus attached to eroded soils and streambanks Fertilizer washoff Human detritus Atmospheric deposition
19 Phosphorus EMCs for different urban land uses Urban Land Use Total P (mg/l) Residential 0.30 Commercial 0.22 Industrial 0.26 Freeway 0.25 Source: Pitt et al 2004 Residential runoff is slightly higher in TP concentration, which reflects the effect of vegetation and fertilization
20 Comparison to Non-Urban Runoff Median Nutrient Concentrations from Various Land Uses Land Use Total P Soluble P Total N (mg/l) Urban Cropland to 8.0 Forest from Pitt et al from various sources, range reflects differences in crop type, management, slope and manure/fertilization regime 3 from Cappiella et al 2006
21 Comparison to Wastewater and CSO s Strengths of nitrogen and phosphorus in natural waters, stormwater and wastewater* (expressed in mg/l) Parameter Natural Waters Urban Stormwater Untreated sewage CSOs Treated sewage** Nitrogen Phosphorus ** current technology in Chesapeake Bay

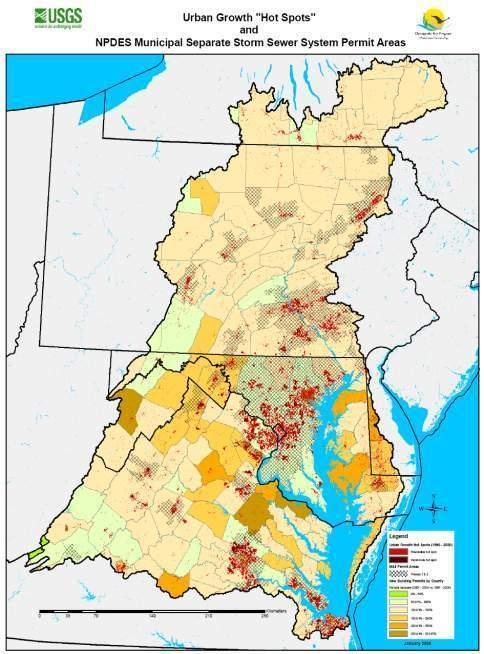
22 Urban Nutrient Hotspots Urban Lawn * Low Density Residential w/ Septics * Urban Areas w/poor House-keeping * Golf Courses * Numerically definable

23 Calculating Urban Nutrient Loads
24 Runoff Coefficient (Rv) Relationship of IC and Runoff Coefficient (Rv) 1 Relationship Between Watershed Imperviousness (I) and the Storm Runoff Coefficient (Rv) (Source: Schueler, 1987) Rv = I Watershed Imperviousness (%)
25 The Simple Method (Schueler, 1987) L = [ P * Pj* Rv/12 ] [ C * A *2.72] Where: L = Annual load (lbs) P = Annual rainfall (in) Pj = Fraction of storms producing runoff Rv = runoff coefficient C = Pollutant concentration EMC (mg/l) A = Site Area (acres) 2.72 = Unit conversion factor
26 Site Runoff Coefficients (Rv) Cover HSG A HSG B HSG C HSG D Forest Managed Turf / Disturbed Soil Impervious Cover
27 Comparison of Average Annual Loads for Simple Method vs. CB Watershed Model % of Impervious Cover in Drainage Area Total Phosphorus (lbs/ac/yr) Simple Method Watershed Model Simple Method Total Nitrogen (lbs/ac/yr) Watershed Model 10 % * 50 % % * The Watershed Model includes both stormwater and septic system leachate for nitrogen which is why the agreement between the two methods is poor for low density suites This comparison is currently being reviewed by Bay modelers to ensure accuracy
28 The Evolution of Nutrient Reduction Efficiencies for Stormwater Practices
29 10 Different Removal Rates Published MWCOG, 1987 Schueler, 1992 Brown and Schueler, 1997 Winer, 2000 Baldwin et al 2003 CWP, 2007 CWP and CSN, 2008 Simpson and Weammert, 2009 ISBD, 2010 CSN, 2011 More BMP Panels in 2011 and 2012
30 Why the Numbers Change Over Time More research studies Newer LID technologies Shift away from percent removal and toward runoff reduction Higher volumetric treatment standards Discounting for poor installation and maintenance
31 Runoff Reduction Rates (%) Infiltration 50 to 90 Bioretention 40 to 80 Pervious Pavers 45 to 75 Green Roof 45 to 60 Dry Swale 40 to 60 Rain Tanks/Cisterns 40 Roof Disconnection 25 to 50 Grass Channel 15 to 30 Dry ED Pond 0 to 15 Wet Pond 0 Sand Filter 0 Source: CWP and CSN (2008)
32 Practice Design Level 1 TN Load Removal 4 TP Load Removal 4 Rooftop Disconnect 1 25 to to Filter Strips 1 25 to to to to 75 Green Roof Rain Tanks & Cisterns 1 15 to to to to 90 Permeable Pavers Infiltration Practices Bioretention Practices Dry Swales Wet Swales Filtering Practices Constructed Wetlands Wet Ponds 1 30 (20) 50 (45) 2 40 (30) 75 (65) ED Ponds

33 Questions and Answers

34 Part 2 A short primer on the Bay-wide TMDL and the Local WIP Process
35 POLL Question 2 I would rate my knowledge about Bay-wide TMDL implementation as being: Really strong Pretty good, but a lot of questions Fair, but not sure about its local impact Really weak First I have ever heard about it
36 POLL Question 3 What is your biggest concern going forward about local implementation of the Bay-wide TMDL? Unclear as to what I will need to actually do Not getting clear guidance from state or EPA My local load reduction is too much Not sure where funding will come from Huge impact on local budgets Lack local political support to get it done Short time frame to do WIP planning

 Potential")

37 Some folks think the WIP process is scary Billions in potential costs Short planning horizon (draft plan due Dec 1, 2011) Potential regulatory liability High planning costs Lots of complex documents = major local headaches
38 The WIP Process is not as Scary as it Looks Each state works with its local governments to develop strategies for nutrient reduction The jurisdictional unit could be a MS4 permitee, planning district commission, county or conservation district, depending on the state The liability for not meeting the load reductions is a state liability, and not a local one (unless tied into MS4 permit)
39 What to expect: Locals will need to submit data, have a strategy and report on BMP implementation Locals will need to follow state and/or CBP approved procedures for tracking and verifying BMPs States have the responsibility for aggregating local data and submitting it to EPA to show progress in load reductions
40 The WIPs are a long term process Progress is assessed based on two year milestones Implementation of the WIP is a 15 year iterative process Many opportunities for adaptive management and collaboration


41 Check the resource weblinks to find who is responsible for WIPs in your state and the process they will follow (they differ a lot)
42 Part 3: Process for estimating your local baseline load Not all states will require you to do it, but it really helps you find the most costeffective combination of BMPs to reduce nutrient loads
43

44 Step 1 Do your exclusions DEDUCT State and Federal Roads State and Federal Lands Incorporated Lands Rural Zoning Parklands Industrial Stormwater Permits Source: MCDEP, 2011
 May want to delineate subwatersheds too Helps keep track of local TMDLs as")
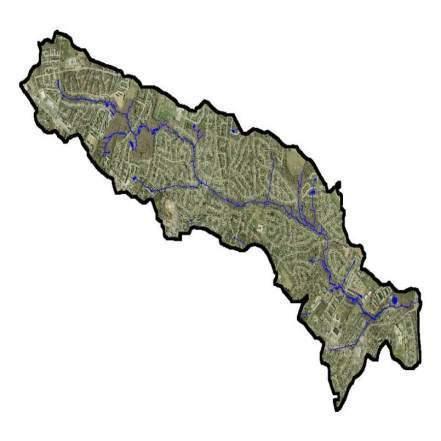
45 Step 2 Break your MS4 Area into Major Watershed Units 12 digit USGS HUC Codes (15 to 75 sm) May want to delineate subwatersheds too Helps keep track of local TMDLs as well


46 Step 3 Convert your most recent land use data into land cover units Forest Cover Turf Cover Impervious Cover
47 Land Use Should Be Converted Into Land Cover Recommended Splits for Land Cover within Land Use Categories LAND USE Impervious Cover Forest Cover Turf Cover Low Density Residential Medium Density Resid High Density Residential Multifamily Residential Commercial Industrial Roadway Intensive Muni/Institutional Extensive Muni/Institutional

48 Step 4 Merge Your BMP Inventory into Your Watershed GIS Show total drainage area where Existing IC is effectively treated Not as simple as it appears May need further desktop or field investigation to assess actual BMP performance Don t over-estimate removal by existing BMPs T O T I B

49 Step 5 Select Your Local Loading Model Watershed Treatment Model: Your WIP workhorse New version available from Center for Watershed Protection
50 The Watershed Treatment Model Based on Simple Method and Unit Loads Don t worry about exactly replicating the Bay TMDL baseline numbers (your WTM model is more accurate) Test multiple BMP scenarios to get to your nutrient load allocation
51 Other Models and Tools Are Also Designed to Help You Do Your WIP Planning EPA Scenario Builder MD Assessment and Scenario Tool (MAST) Virginia: VAST (coming soon) These tools use Watershed Model loads and approved BMP rates Excellent for agricultural BMPs, a bit limited for urban analysis They will ultimately be used to track local WIP outputs See Weblinks Resources for more detail

52 Step 6 Analyze a Broad Range of Urban BMPs Fertilizer restrictions Redevelopment credits New stormwater regs Reforestation and stream buffer upgrades Stream restoration Maintenance upgrades Intensive street sweeping Septic upgrades and illicit discharges Stormwater Retrofits

53 Part 4 9 Steps to Reduce Your Local Nutrient Load Before You Consider Stormwater Retrofits
54 # 1 Take credit for fertilizer reductions on urban turf Reflects recent MD and VA P Ban in Fertilizer Modeled as an application reduction, with an estimated 17 to 19% TP reduction in urban loads Research in other regions put it closer to 10 to 12% TN reductions are minor unless regional education campaign program to reduce N fertilization

55 # 2 Take nutrient reduction credits for more stringent stormwater requirements at redevelopment projects Calculate the expected acres of impervious cover slated for redevelopment Estimate the runoff capture volume and design level using new regs Calculate the aggregate nutrient reduction credit
56 Nutrient Reduction Credits for Redevelopment Lbs/acre/year Rainfall depth for which stormwater treatment is computed (inches) Nutrient LO 1 HI 2 LO HI LO HI LO HI LO HI LO HI Total P Total N Multiply aggregate acres of redeveloped IC by the per acre load reduction credit Can be an important strategy in several Bay cities

57 # 3 Become an Early Adopter of Stormwater Regulations This ensures that your nutrient liability won t continue to increase
58 Variability in Bay State Stormwater Regulations Considerable confusion in terminology among the states (ESD, LID, RR, treatment trains) Each state/locality is on a different schedule for implementing them (2009 to 2013) Each state has a unique hydrologic performance standard Differential standards for new and redevelopment Individual sites may not fully comply with standard

59 Will the new standards lead to nutrient neutrality for new development projects in the future?
60 What is an acceptable runoff nutrient load? TP Loads, By Land Based Sector in Maryland Bay TMDL Loading Sector 2009 Load Target Load Million pounds per year Forest Runoff Urban and Suburban Runoff Agricultural Runoff ALL RUNOFF SOURCES Acceptable Load (lbs/acre) excludes CAFO portion of agricultural runoff Wastewater sources excluded Same Analysis Yield an Acceptable TN Load of 4.4 lbs/acre Results differ slightly for each state based on distance to the Bay
61 Nutrient Reduction Based on Stormwater Treatment and Technology (lbs/acre/year) Nutrient Rainfall capture volume for which stormwater treatment is computed (inches) LO 1 HI 2 LO HI LO HI LO HI LO HI LO HI Total P Total N Practices employed employ stormwater treatment but have low or no runoff reduction capability 2 Practices employed maximize runoff reduction and designed to VADCR Level 2 3 expressed in annual load reduced per IC acre treated (lbs/acre/year) To Get to Nutrient Neutrality: TP needs a 83% reduction (1.66 lbs) TN needs a 71% reduction (11 lbs)

62 What local safeguards are needed to ensure the load limits are actually achieved on the ground? Practices designed in accordance with Bay-wide Design Specs Post-construction certification that it was installed properly and works Municipality meets minimum performance standards for: ongoing performance inspections maintenance enforcement
 CSN and VADCR spreadsheet rates are about the same Get extra credit for Treating runoff from adjacent IC Stream or shoreline buffer")
63 # 4 Take Credit for Community Reforestation Set goal to reforest 5% of current turf cover 10 to 1 Rule (ten acres of reforestation equals one acre of impervious cover treated) CSN and VADCR spreadsheet rates are about the same Get extra credit for Treating runoff from adjacent IC Stream or shoreline buffer upgrades?

64 # 5 Take credit for current and future stream restoration projects High nutrient reduction rates for qualifying projects Provides both a local benefit and a Bay benefit Generally popular with the public Cost competitive with pond retrofits
65 CBP BMP Panel to Update Stream Restoration Rates U of MD Literature Review Review of 20 + studies on various parts of the urban stream nutrient cycle Develop concept model for predicting rates Should be done by early 2012

66 Proposed Interim Stream Restoration Rate Removal rate per Linear foot of Qualifying Stream Restoration Source TN TP TSS CBP 2005 N=1 CSN 2011 N=6 U of MD Study N= lbs lbs 0.20 lbs lbs 310 lbs Scheduled for early 2012

67 What s a Qualifying Project? Can t just dump rip-rap Comprehensive stream design Flood plain re-connection Minimum reach size In-stream habitat features


68 # 6 Re-tool your stormwater maintenance program Inspect the performance of your existing BMP inventory Field Research Indicates about 30% of the BMP Inventory needs a makeover Significant nutrient reductions are possible through these low cost BMP makeovers Performance downgrades must be reflected in local WIP baseline load By Retooling existing Maintenance Budget, it is possible to eliminate eyesores and clean the Bay

 Use Retrofit Design points method (Schueler")
69 Options to Upgrade to Older BMPs Three Ways: Go from Level 1 rates to Level 2 on VA DCR spreadsheet Direct mass reductions for sediment cleanouts (aka street sweeping) Use Retrofit Design points method (Schueler et al, 2008)
70 Dealing with the Local BMP Legacy Thirty Years of BMPs. The BMP Inventory in a Maryland County Potentially High Performers Known Low Performers Bioretention/Dry Swales 49 Underground 270 Detention Sand Filters 279 Dry Ponds 528 Wet pond 212 Oil Grit Separators 805 Pond Wetland 98 Proprietary Practices 239 Infiltration Basin 58 Flow Splitter 321 Infiltration Trench 459 Other (plunge pools) 30 Adapted from MCDEP


71 # 7 Take the Mass Credit for Intensive Street Sweeping New CBP Method based on Actual Pollutant Mass Picked Up Qualifying Frequency and Technology Incentive for Sweeping Crews to Maximize Pickup

72 #8 Investigate Septic Hookups and Upgrades Key Strategy for TN removal Relict septics in sewered catchments Upgrade N technology in existing septics Sewer extensions and cluster satellites CBP Rates available

73 # 9 Take Credit for Eliminating Illicit Discharges For chronic and episodic sewage discharges that are physically eliminated Reduction based on rate of dry weather flow and outfall concentration above background levels CWP research indicates this can be an important strategy in some urban watersheds available


74 # 10 Retrofit Existing Stormwater Ponds Source: CWP


75 # 11 Residential LID Retrofits Subsidies, technical assistance, stormwater utility credits and other incentives to build LID retrofits on private land
76 More on Retrofitting August 18 Webcast Basics of Stormwater Retrofits How to quickly find the best opportunities on public land desktop and field methods How to calculate their nutrient reduction capability Tips on reducing the costs of local retrofit programs

77 The Cost Challenge The weakest link in local WIPs are accurate cost data for practices Need to acquire better cost data and share it Possibility of Bay-wide database Millions vs. billions


78 otos: Chesapeake Bay Program Thanks! Thanks to our funders, we have provided this webcast for free. Please take 3-5 minutes to let us know how we did! Our funders need to hear! Or your comments directly to
79 Upcoming Webcasts for 2011 August 11 LID Changes Everything: the new stormwater maintenance paradigm August 18 Stormwater Retrofits to Maximize Nutrient Reduction September 15 Increasing the Delivery of Residential Stewardship Practices September 22: ESD in MD Critical Area (postponed)

80 Questions and Answers