Water Quality in Seneca Lake Tributary Streams
|
|
|
- Shannon Pearson
- 5 years ago
- Views:
Transcription
1 Water Quality in Seneca Lake Tributary Streams Stephen Penningroth, Director Community Science Institute Hobart and William Smith Colleges March 24, 2018
2 Community Science Institute Independent, nonprofit, tax-exempt environmental organization founded in 2000, website: communityscience.org Budget and Staff: Four (4) full-time, four (4) part-time; $268,000 in 2017, ~37 % from local governments and other stakeholders in Tompkins County Certified water quality testing lab: NY State and EPA certified for both non-potable water and drinking water since QAPP-based, affordable monitoring partnerships between certified lab and volunteer groups: We recruit, train and partner with community-based volunteer groups to build scientifically credible, long-term data sets -- at less than half the cost of environmental consulting firms -- with the goal of understanding and protecting water resources locally and regionally Free online access to raw data and interpretive maps and graphs: Public can view raw data with maps and graphs, also search and download results, at database.communityscience.org Biological stream monitoring: CSI staff also partner with volunteer groups to monitor the health of streams as aquatic ecosystems by collecting and identifying small bottom-dwelling organisms called benthic macroinvertebrates (BMI), on a par with NYSDEC s stream monitoring program


3 Maintaining a Certified Lab Benefits and Challenges Maintaining a certified lab is a lot of work! The quality assurance and quality control measures are extensive. The amount of paperwork involved is sizable. Inspections are rigorous. So why make the effort? Certified data can be used for regulatory purposes. It is difficult for citizen science groups to ensure that their data is taken seriously. Certification is one way. Maintaining certification also allows CSI to address the community s potable water testing needs.

4 Volunteer Water Monitoring Partnerships Three Volunteer Water Monitoring Programs Synoptic Sampling Red Flag Monitoring Biomonitoring Synoptic Monitoring Partnerships Certified laboratory analyses Red Flag Monitoring Partnerships Quality-assured field measurements Biomonitoring Partnerships Benthic macroinvertebrates


5 CSI Monitoring Programs Synoptic Sampling Three Volunteer Water Monitoring Programs Synoptic Sampling Certified Lab Analyses Analytes include: E. coli Total Phosphorus Soluble Reactive Phosphorus Nitrate -+ Nitrite Nitrogen Total Kjeldahl Nitrogen Ammonia Nitrogen Turbidity Total Suspended Solids Chloride Chlorophyll a And others Primary focus of program is monitoring nutrients, sediment, and pathogenic bacteria Synoptic Sampling Process Sample Water samples are collected by teams of volunteers three to four times a year including once under storm water conditions. Sampling of a single stream, from headwaters to mouth, occurs within a few hours to get a snap-shot of water quality. Drop off Volunteers bring samples to CSI s certified lab and complete a chain of custody. Analyze Samples are analyzed by CSI staff using certified methods. Database Test results are entered into CSI s online public database: www. database.communityscience.org
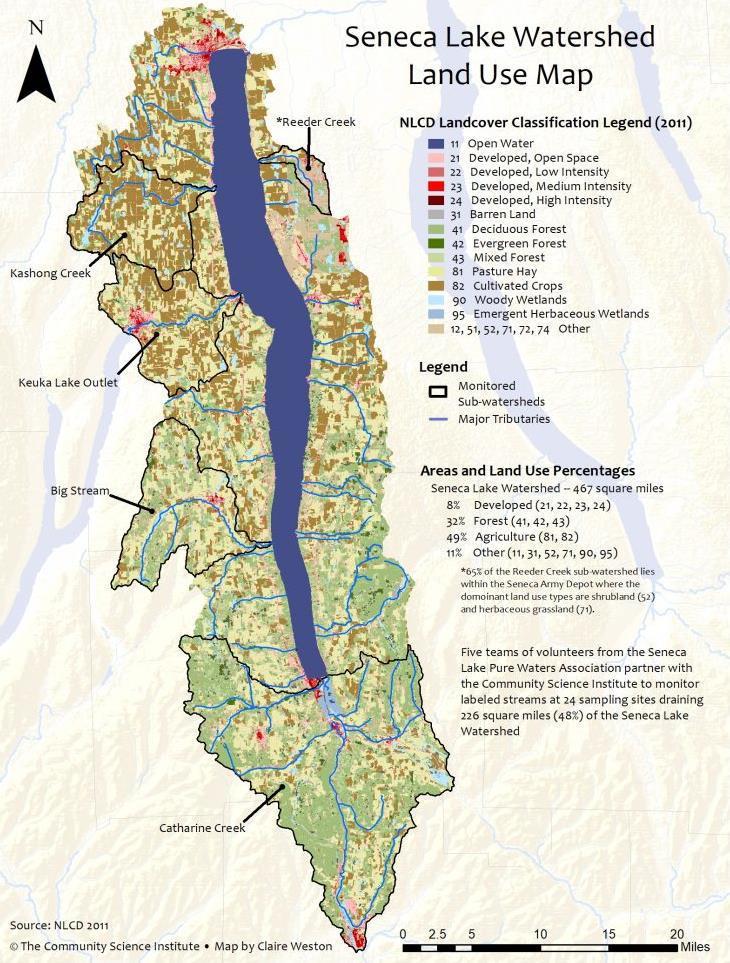
6 Seneca Lake Tributary Stream Volunteer Monitoring A Volunteer-CSI Synoptic Monitoring Program Water quality in Seneca Lake is determined largely by water quality in its many tributary streams Water quality in streams is, in turn, determined largely by land use in their watersheds, for example, forest, agriculture, waste water treatment plants, natural areas, and diverse types of businesses SLPWA volunteers collect samples several times a year at ~25 fixed locations on 5 tributary streams draining 48% of the Seneca Lake watershed Locations have been chosen to maximize the likelihood of documenting potential impacts

7 Kashong Creek Keuka Outlet Reeder Creek Fixed Locations Monitored Regularly by SLPWA Volunteers on Seneca Lake Tributary Streams Big Stream Catharine Creek Total drainage area monitored: ~226 mi² Total number of monitoring sites: ~25 View, search and download raw data free at database.communityscience.org
8
9 Program Focus is on Nutrients, Bacteria, Sediment and Hazardous Chemicals Monitoring partnership between SLPWA and CSI produces reliable measurements of water quality indicator concentrations under base flow and high flow conditions Concentrations at stream mouths reflect total watershed contributions to water quality, including groundwater (base flow) plus surface and sub-surface runoff (at high flows) Concentrations at stream mouths are also general indicators of nearby nutrient concentrations in the lake Note: Concentrations are not the same as the amounts or loads (mass) of nutrients entering Seneca Lake
10 No Evidence of Hazardous Substances in Reeder Creek Downstream from Seneca Army Depot N. Patrol Rd. Access Rd. Rte 96A Mouth Drinking Water Standard Gross Alpha Radioactivity (pci/l) pci/l Gross Beta Radioactivity (pci/l) pci/l Arsenic (mg/l) <0.01 <0.01 <0.01 < Beryllium (mg/l) <0.001 <0.001 <0.001 < Copper (mg/l) < Lead (mg/l) <0.01 <0.01 <0.01 < VOCs (58 total) (mg/l) < < < <
11 Average E. coli Counts Contact Recreation Limit = 235 colonies/100 ml Kashong Creek Reeder Creek Stream (North to South) Average E. coli at stream mouth, base flow (colonies/ 100 ml) Total Phosphorus Average E. coli at stream mouth, stormwater (colonies/ 100 ml) Reeder Creek ,500 Kashong Creek ,000 Keuka Outlet Big Stream Key Baseflow Stormwater Keuka Outlet ,250 Big Stream ,175 Catharine Creek 349 2,615 Catharine Creek
12 Average E. coli Counts Contact Recreation Limit = 235 colonies/100 ml Kashong Creek Reeder Creek Stream (North to South) Average E. coli at stream mouth, base flow (colonies/ 100 ml) Total Phosphorus Average E. coli at stream mouth, stormwater (colonies/ 100 ml) Reeder Creek ,500 Kashong Creek ,000 Keuka Outlet Big Stream Key Baseflow Stormwater Keuka Outlet ,250 Big Stream ,175 Catharine Creek 349 2,615 Catharine Creek
13 Average Dissolved (~Bioavailable) Phosphorus Concentrations Measured at Stream Mouths Kashong Creek Reeder Creek Stream (North to South) Average Dissolved Phosphorus, Base Flow Total Phosphorus ( g P/L) Average Dissolved Phosphorus, Stormwater ( g P/L) Reeder Creek Kashong Creek Keuka Outlet Big Stream Catharine Creek Keuka Outlet Big Stream Key Baseflow Stormwater Catharine Creek
14 General Comparison Between Dissolved P in Seneca Lake Streams and Cayuga Lake Streams Reeder Creek: Dissolved P is extremely high in groundwater feeding Reeder Creek, possibly due to legacy contamination from munitions disposal at the Seneca Army Depot Base flow dissolved P concentrations average ~3x higher in the other four monitored Seneca Lake streams, ~37 ug/l, compared to ~13.4 ug/l in five Cayuga Lake streams Stormwater dissolved P concentrations average ~2x higher in Seneca Lake streams, ~81 ug/l, compared to ~45 ug/l in five Cayuga Lake streams
15 Average Particulate Phosphorus Concentrations at Stream Mouths = Total P Dissolved P (Not Readily Bioavailable) Kashong Creek Reeder Creek Stream (North to South) Average Particulate Phosphorus, Total Phosphorus Base Flow ( g P/L) Average Particulate Phosphorus, Stormwater ( g P/L) Reeder Creek (-22.9) Kashong Creek Keuka Outlet Big Stream Catharine Creek Keuka Outlet Big Stream Key Baseflow Stormwater Catharine Creek
16 What is Particulate Phosphorus? Particulate phosphorus is the phosphorus associated with particles that do not pass through a fine (0.45 micron) filter Particulate phosphorus is calculated as the difference between two measured quantities: Total phosphorus, which includes dissolved and particulate phosphorus, and dissolved phosphorus: Particulate P = Total P Dissolved P High particulate phosphorus is generally correlated with high concentrations of suspended soil and sediment at high flows, e.g., in Big Stream and Keuka Outlet Particulate P is mostly stored in lake sediments and is believed to have only a small degree of bioavailability compared to dissolved P
17 Average Total Nitrogen Concentrations Measured at Stream Mouths (NOx + Total Kjeldahl Nitrogen) Kashong Creek Reeder Creek Stream (North to South) Average Total Nitrogen, Base Flow Total Phosphorus (mg/l) Average Total Nitrogen, Stormwater (mg/l) Reeder Creek Kashong Creek Keuka Outlet Big Stream Catharine Creek Keuka Outlet Big Stream Key Baseflow Stormwater Catharine Creek
18 General Comparison Between Total Nitrogen in Seneca Lake Streams and Cayuga Lake Streams Total nitrogen is the sum of inorganic nitrogen including nitrate (NO 3 ) and nitrite (NO 2 ); ammonia (NH 4 ); and organic nitrogen, mainly protein (N org ) Main source of inorganic nitrogen is fertilizer; main sources of organic nitrogen and ammonia are animal waste and decaying plant matter Base flow: Total N concentrations are similar, 1.8 mg/l in five monitored Seneca Lake streams and 2.0 mg/l in five Cayuga Lake streams Stormwater: Average total N concentration increases to 4.5 mg/l in monitored Seneca Lake streams, somewhat more than the increase to 3.5 mg/l in five Cayuga Lake streams
19 Nutrient concentrations are great to know. So are loads. Why? A load is the actual amount, or mass, of a pollutant that enters a waterbody such as Seneca Lake For non-point source pollutants, the load depends on pollutant concentration and the size of the stream Having the data that s needed to estimate loads makes it possible to prioritize streams, and catchment areas within a stream s watershed, for pollutant reduction efforts A load reduction strategy called Total Maximum Daily Load (TMDL) is incorporated into the Clean Water Act
20 To Calculate Load: Combine Nutrient Concentrations with USGS Flow Measurements Nutrient Load = Nutrient Concentration x Stream Flow = [Nutrient] (ug/l or mg/l) x [Flow] (cfs) Transform units and calculate load in tons/year Concentrations are measured in CSI s certified lab (ELAP# 11790) on samples collected by trained volunteers Flows are measured by USGS gauging station, if there is one Flows are estimated using drainage area ratio, if there isn t Estimate assumes flow is proportional to drainage area Concentrations and flows are needed to calibrate Loadest software


21 Calculating Loads When Flows Are Measured or Can Be Reasonably Extrapolated From USGS Gauging Station Measurements
22 Predicting Nutrient Loading When Flows Cannot Be Reasonably Extrapolated From Gauged Streams There are no USGS gauging stations providing continuous flow measurements on any Seneca Lake tributary stream Nevertheless, nutrient loading from monitored streams to Seneca Lake can be predicted to a reasonable degree of approximation if it is assumed that: 1. Load is proportional to a stream s drainage area 2. Load is proportional to stormwater nutrient concentrations 3. Load can be indexed to loading from a reference stream Reference stream: Fall Creek in Cayuga Lake watershed, which has USGS gauging station. Drainage area is 129 mi 2, average stormwater dissolved P at mouth = 25 ug/l, and dissolved P loading to Cayuga Lake = 4.34 tons/year (3-year average) Test of prediction approach to estimating loads: Predicted P loads averaged 95 % +/- 18% of calculated P loads for five (5) Cayuga Lake streams Example prediction for a Seneca Lake stream: Dissolved P loading from the Keuka Outlet = 4.34 tons/year x (31.7 mi 2 /129 mi 2 ) x (176.5 ug/l/25.06 ug/l) = 7.51 tons/year
 Drainage Area (mi²) ~")


23 Prediction of Dissolved and Particulate Phosphorus Loading to Seneca Lake (tons/year) Kashong Creek Reeder Creek Monitored Subwatersheds (226 mi 2 ) Drainage Area (mi²) ~ Dissolved Phosphorus (tons/year) Total Phosphorus ~ Particulate Phosphorus (tons/year)) Reeder Creek Kashong Creek Keuka Outlet Big Stream Keuka Outlet Big Stream Key Dissolved Particulate Catharine Creek Seneca Lake Watershed Cayuga Lake Watershed Catharine Creek
24 Seneca Lake Tributary Streams: Conclusions Total nitrogen concentrations are elevated in predominantly agricultural areas, similar to Cayuga Lake streams E. coli counts are above the recreational limit at base flow, similar to many Cayuga Lake streams. But there are extraordinary rises in E. coli counts at high flows, by a factor of as much as 100 Dissolved (mostly bioavailable) phosphorus concentrations average roughly 2x to 3x higher in Seneca Lake streams than in Cayuga Lake streams The Seneca Lake watershed loads (exports) a ~50% greater mass of dissolved phosphorus per square mile to Seneca Lake than the Cayuga Lake watershed loads to Cayuga Lake
25 Implications for Risks from Pathogenic Bacteria and HABs in Seneca Lake High E. coli counts point to the presence of significant sources of untreated animal and/or human waste that is readily mobilized in runoff High counts indicate health risks from swimming in streams Recommend checking E. coli counts in Seneca Lake High phosphorus levels are broadly correlated with increased HABs in freshwater lakes Shoreline concentrations of dissolved P are likely to be elevated near the mouths of many streams Average Nitrogen : Phosphorus > 26:1at stream mouths except: a) Reeder Creek at base flow (high dissolved P) b) Keuka Outlet and Big Stream at high flow (high particulate P) Near shore HABs are probably phosphorus-limited except possibly near Reeder, where HABs may be nitrogen-limited
26 Bonus Slides: Investigating Agriculture and Penn Yan WWTP as Pollutant Sources in the Keuka Outlet Watershed E. coli and dissolved P exhibit similar concentration profiles upstream to downstream across the Keuka Outlet watershed There is a spike at the mouth of Jakob s Brook; a decrease at Fox s Mills due to dilution; then a steady rise beginning downstream of the WWTP and continuing for the remaining ~3/4 of the length of the Outlet The Penn Yan WWTP may explain some of the small downstream increases in E. coli and dissolved P at base flow Agricultural land use is the logical explanation for high stormwater E. coli and phosphorus, both upstream of the WWTP at Jakob s Brook and downstream all the way to Seneca Lake If downstream E. coli and phosphorus were from WWTP, dilution should cause them to decrease

27 Monitoring Locations on Keuka Outlet

28 Keuka Outlet and Jacob s Brook Drainage Areas 1. Keuka Lake Boat Launch 2. Jacob s Brook at Birkett Mills 3. Keuka Outlet at Fox s Mill Rd. 4. Keuka Outlet at Ridge Rd. Bridge 5. Keuka Outlet mouth at Seneca Lake
29 Base flow E. Coli is highest at Jakob s Brook and in WWTP effluent (note reverse order of locations on graphs compared to maps)
30 Stormwater E. Coli peaks at Jakob s Brook, falls due to dilution, then rises post-wwtp and downstream agricultural areas
31 Stormwater phosphorus peaks at Jakob s Brook, falls due to dilution, then rises post- WWTP and downstream agricultural areas
32 Acknowledgements Sample collection in fair weather and foul: Seneca Lake Pure Waters Association Accurate laboratory analyses: Michi Schulenberg, Noah Mark, Laura Dwyer Graphs and slides: Claire Weston Database: Abner Figueroa