The New Global Energy Landscape
|
|
|
- Cordelia Barker
- 5 years ago
- Views:
Transcription
1 The New Global Energy Landscape Tuesday, May 1, 2012; 2:30 PM 3:45 PM Moderator: Brian Sullivan, Anchor, CNBC Speakers: Richard Kauffman, Senior Advisor to the U.S. Secretary of Energy Alex Pourbaix, President, Energy and Oil Pipelines, TransCanada Corp. Brian Schweitzer, Governor, State of Montana Rhonda Zygocki, Executive Vice President, Policy and Planning, Chevron

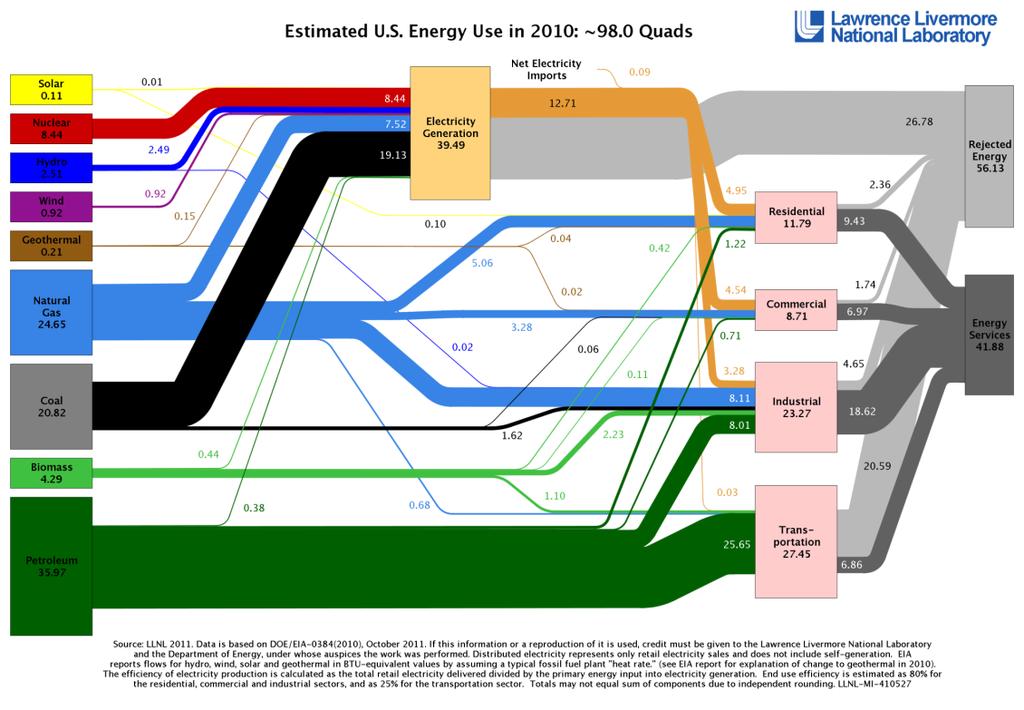
2 How is America powered? Primary energy consumption in the U.S., 2010 Renewable Energy 8.0% Nuclear Electric Power 9.0% Source Petroleum 37.0% Coal 21.0% Natural Gas 25.0% Source: U.S Energy Information Administration.
3 Petroleum consumption continues to significantly outweigh renewable energy Consumption by geographic region, 2009 Asia and Oceania Africa Middle East Eurasia Europe Petroleum Renewable energy Central and South America North America Quadrillion btu Source: U.S Energy Information Administration

4 Heating and cooling emit the most carbon dioxide in residential sectors Energy-related carbon dioxide emissions by end use, 2011 Clothes dryers 3.1% Color televisions 5.2% Refrigeration 5.5% Computers 2.8% Cooking 2.8% Dishwashers 1.4% Freezers 1.2% Clothes washers 0.5% Space heating 24.1% Lighting 10.6% Space cooling 12.2% Source: U.S Energy Information Administration. Water heating 14.0% Other uses 16.6%
5 Oil price volatility Global weekly oil prices US$ per barrel Source: U.S Energy Information Administration.
6 U.S. crude oil production has increased by 12 percent since 2008 Annual percentage changes in U.S. crude oil production Annual percentage change Source: U.S Energy Information Administration.
7 U.S. crude oil imports have steadily declined since 2005 U.S. crude oil imports since 2000 and projections Million barrels per day Source: U.S Energy Information Administration. Projected
8 How much does the U.S. pay for crude oil? U.S. crude oil imports in dollar values (non-seasonally adjusted) US$ billions Source: U.S Census Bureau Foreign Trade Division.
9 Global renewable energy consumption is trending upwards Fossil fuel vs. renewable energy consumption Quadrillion btu Source: U.S Energy Information Administration. Natural Gas (left) Quadrillion btu 9 Petroleum (left) 8 Renewable Energy (right) Coal (left)
10 U.S. energy dependency has been steadily decreasing U.S. fossil fuel imports Quadrillion btu Source: U.S Energy Information Administration. Petroleum (left axis) Natural gas (right axis) Crude oil (left axis) Quadrillion btu 5 5 Coal (right axis)
11 Led by wind and biomass, the U.S. projects increases in renewable energy generation Domestic non-hydro renewable energy generation Billion kilowatt hours Geothermal 20 Waste Source: U.S Energy Information Administration. Solar / PV Wind Biofuel
12 Hydroelectricity leads U.S. renewable production U.S. renewable energy supply, 2011 Wind 14% Geothermal 3% Other Renewables 6% Solar 1% Biodiesel 1% Hydroelectric 38% Ethanol 14% Production 8.4 quadrillion btu Source: U.S Energy Information Administration. Wood and Wood Waste 23%
13 Hydroelectricity leads U.S. renewable consumption U.S. renewable energy consumption, 2011 Geothermal 3% Solar 1% Biodiesel 1% Other Renewables 11% Ethanol 13% Hydroelectric 38% Consumption 8.3 quadrillion btu Source: U.S Energy Information Administration. Wind 14% Wood and Wood Waste 19%
14 Since 2010, China has surpassed the U.S. as the world leader in cumulative wind energy capacity Cumulative wind energy capacity by global leader, 2011 Denmark 1.7% Canada 2.2% United Kingdom 2.7% Italy 2.8% France 2.9% India 6.7% Source: National Renewable Energy Laboratory. Spain 9.1% Rest of World 13.6% Germany 12.2% China 26.3% United States 19.7%
15 Despite having 5 percent less wind capacity than China, the U.S. produced 42 percent more wind Wind energy production by global leader, 2010 Rest of World 14.4% Canada 2.4% Italy 2.5% France 2.9% United States 28.3% United Kingdom 3.0% India 6.1% Source: National Renewable Energy Laboratory. Germany 10.9% Spain 13.0% China 16.5%
16 Solar energy capacity and generation is increasing in the U.S. U.S. total installed solar energy capacity and generation Megawatts 3,000 2,500 2,000 1,500 1, Photovoltaics (PV) capacity (left axis) Concentrated solar power (CSP) capacity (left axis) Source: National Renewable Energy Laboratory. Solar energy generation (right axis) Gigawatthours 5,000 4,500 4,000 3,500 3,000 2,500 2,000 1,500 1,
17 Germany leads the world in installed solar energy capacity Global installed solar energy capacity leaders, 2010 Czech Republic 6% U.S. 8% France 3% China 2% Italy 10% Germany 49% Japan 10% Source: National Renewable Energy Laboratory. Spain 12%
18 California leads the U.S. in solar energy development U.S. leaders in photovoltaic (PV) development, 2010 State PV Cumulative Capacity (2010, MW) California 1,021.7 New Jersey Colorado Arizona Nevada Florida 73.5 New York 55.5 Pennsylvania 54.8 Hawaii 44.7 New Mexico 43.3 Source: National Renewable Energy Laboratory.
19 U.S. leads the world in clean energy investment Investments by global rank US$ billions U.S. China Germany Italy India U.K. Japan Spain Brazil Source: Bloomberg New Energy Finance and Pew Environmental Group.
20 China is experiencing the highest growth in renewable energy capacity Top 10 five-year growth in capacity from Rank Country Increase in renewable energy capacity 1 China 92% 2 Turkey 58% 3 Brazil 49% 4 Italy 47% 5 Argentina 46% 6 South Korea 43% 7 France 41% 8 Canada 32% 9 Australia 29% 10 United States 28% Source: Bloomberg New Energy Finance and Pew Environmental Group.
21 Increase in supply, shale gas production, and a mild winter have contributed to current low prices U.S. natural gas wellhead prices US$ per thousand cubic feet Source: U.S Energy Information Administration. Projected
22 Natural gas production is supplied mostly by domestic reserves U.S. natural gas sources, % Canada and Mexico 10% 1% Trinidad Qatar Yemen Egypt Nigeria Norway Peru Source: U.S Energy Information Administration. Domestic production Import (Pipeline) Import (LNG)
23 Discovery of domestic natural gas reserves is reducing import volume Import vs. domestic production Trillion cubic feet Source: U.S Energy Information Administration. Imports (right) Domestic (left) Trillion cubic feet
24 Discovery of wells and low-cost extraction methods increase shale gas production U.S. domestic shale gas production Trillion cubic feet 60 Proved Reserves Production Shale gas makes up 23 percent of current U.S. production EIA estimates that production could double or triple over the next 25 years Source: U.S Energy Information Administration.
25 Iran s oil production has decreased since announcement of July 1 sanctions Current Iran crude oil production Million barrels per day /09 10/09 3/10 8/10 1/11 6/11 11/11 4/12 Source: Bloomberg. Iran sanctions announced and projection
26 Saudi Arabia is prepared to increase production Iran vs. Saudi Arabia Million barrels per day Million barrels per day 4.5 Saudi Arabia (left) 4.0 Iran (right) 0 5/09 9/09 1/10 5/10 9/10 1/11 5/11 9/11 1/12 5/ Source: Bloomberg. *Projections begin in 4/12.
27 Closure of the Strait of Hormuz will impact seaborne traffic 2011 Strait of Hormuz traffic data 17 million barrels per day in 2011 (6 percent increase from 2010) 14 crude oil tankers per day 35 percent of global seaborne trade 85 percent of exports to Asian markets Source: U.S Energy Information Administration.
28 Technology game changer U.S. now has the largest energy reserves in the world Total fossil fuel reserves, % of world total Note: Fossil fuels include oil, natural gas and coal. Source: U.S. Congressional Budget Office
29 Technology Cost and Performance Profiles Capital Cost ($/kw) Good Poor Gas Coal Nuclear Wind Solar PV Dependability Fuel Price ($/MMBtu) Land/Visual Impact Air Pollution Cost of Electricity* ($/MWh) Source: IHS CERA, TransCanada.
30 North American Power Generation by Fuel Type TWh 7,000 6,000 History Forecast 5,000 4,000 3,000 2,000 1,000 Oil Natural Gas Renewables Hydro Nuclear Coal

31 North American Oil Pipeline Infrastructure Crude oil is transported across a vast system of pipelines It is a fact that pipelines are the safest method for transporting oil - safer than tankers, trucks or rail In the U.S. alone, there are more than 2.5 million miles of oil and gas pipelines that operate safely every day
32 Pipeline Safety A Decade of Improvement Number of Spills per 1,000 Miles Barrels Released per 1,000 Miles % % Year Averages Ending in Year Shown SOURCE: Pipeline Performance Tracking System, a voluntary spill reporting system involving 85% of the U.S. liquids pipeline mileage. Percentage decline from average to average

33 The Ogallala Aquifer is Protected 174,000 square mile area covering portions of 8 states Already crossed by natural gas and petroleum pipelines, highways, railroads 21,000 miles of pipelines currently co-exist with the aquifer KXL would cross the aquifer for 250 miles Significant oil and natural gas production on top of the aquifer area, including in Nebraska Since 1950, 24 billion barrels of oil were produced through and transported over the aquifer without any serious incidents Keystone XL will use the latest satellite-linked, computerized leak detection and control systems

34 Canada s GHG Emissions In Context Source: CAPP, Achieving Balance, The Canadian Oil Sands Story, Insight Energy Conference, (February 2, 2010)

35 Greenhouse Gas Emissions From Canadian and U.S. Coalfired Power Plants and Oil Sands Operations, 2007 Source: CAPP, Canada s Oil Sands in a North American Policy Context, North American Energy Summit, May 6, 2010
36 Cumulative Global-Warming Impact of Oil Sands Production Degrees Celcius Economically Accessible Reserves All Reserves Oil Sands Shale Gas Coal Source: Nature Climate Change Journal
37 Nearly All Infrastructure Development Experiences Opposition 80% 70% 60% Oppose Support 50% 40% 30% 20% 10% 0% Nuclear Power Plant Oil Drilling Power Transmission Line Natural Gas Drilling Natural Gas Pipeline Wind Farm SOURCE: The Saint Consulting Group The Saint Index: United States, 2011


38 ENGO Tactics Celebrity Social Media Fear James Hansen NASA Scientist: [Keystone XL] is the fuse to the biggest carbon bomb on the planet." Jane Kleeb Director, Bold Nebraska: We are definitely playing Russian roulette with our land and water Misinformation Total potentially mineable area of Oil Sands 11
39 Keystone Oil Pipeline PADD III* * millions of barrels per day Canadian Imports Total Foreign Imports Refining Capacity PADD II* Source: 2010 EIA Actuals US$13.8 billion, including expansion projects 1.4 million Bbl/d ultimate capacity More than 1.1 million Bbl/d contracted for an average term of 17 years WCSB and Bakken Crude Oil MMBbl/d Supply Outlook History Forecast Bakken WCSB Bitumen Blend WCSB Upgraded Light 1.0 WCSB Conventional Heavy 0.5 WCSB Conventional Light
 offers opportunity to recover losses Examples of fuel cell CHP deployments")


40 Typical Electrical Efficiency (HHV) Opportunities for Distributed Generation (DG) and Efficient use of Natural Gas Combined Heat & Power (CHP) offers opportunity to recover losses Examples of fuel cell CHP deployments using natural gas Bank of Omaha (800kW) Price Chopper one of several in the food industry interested Source: Range of electrical efficiencies for DG technologies Typical Electrical Efficiency 70% Examples of companies 60% 50% 40% 30% 20% 10% 0% Steam Turbine Recip. Engine Gas Turbine Micro- Turbine Source: EPA, Catalog of CHP Technologies, December 2008 Fuel Cell Sources: ment.html, UTC Power announced that it will provide 12 fuel cells totaling 4.8MW of power to serve the new World Trade Center- Freedom Tower.


41 Spark-Spread Determines Regional Opportunities for DG from Natural Gas Source: NREL Spark spread determines regions for favorable use of natural gas Red/orange regions: High electricity cost, low natural gas cost- favorable for DG Lower natural gas prices offer increased opportunities for CHP and distributed generation- current vs. 2007
42
 The plant will capture 90 percent of the carbon dioxide (CO 2 ) it produces. Of the 2.")
 that does have additional supplies would require")
43 Enhanced Oil Recovery with CO2 Growing CO2-EOR Production (1990 to 2009) and CO2 Pipeline Infrastructure Texas Clean Energy Project (TCEP) The plant will capture 90 percent of the carbon dioxide (CO 2 ) it produces. Of the 2.9 million tons of CO 2 to be captured annually, 83 percent will be used in the West Texas Permian Basin for enhanced oil recovery. Natural sources of CO2 are in decline, and the one huge natural dome (McElmo Dome) that does have additional supplies would require billions in pipeline cost to transport.