ECOLOGICAL DISTURBANCES IN THE ST. LUCIE ESTUARY AND THE SOUTHERN INDIAN RIVER LAGOON, EASTERN FLORIDA, ELUCIDATED THROUGH MACROBENTHIC MONITORING
|
|
|
- David Carpenter
- 5 years ago
- Views:
Transcription
")
1 ECOLOGICAL DISTURBANCES IN THE ST. LUCIE ESTUARY AND THE SOUTHERN INDIAN RIVER LAGOON, EASTERN FLORIDA, ELUCIDATED THROUGH MACROBENTHIC MONITORING Bjorn Tunberg Scott Jones, Sherry Reed, Michelle Stephens (alphabetical) Benthic Ecology and Monitoring Group (BEAM) Smithsonian Marine Station, Fort Pierce, Florida Project Financed by South Florida Water Management District


2 Benthic Monitoring reliable indicators of habitat quality in aquatic environments. respond to multiple types of environmental stress. reflect environmental conditions that vary over time. live in bottom sediments where exposure to contaminants and oxygen stress are most frequent. indicate local conditions because they have limited mobility and cannot migrate to avoid stressful situations.
, 0.")

")
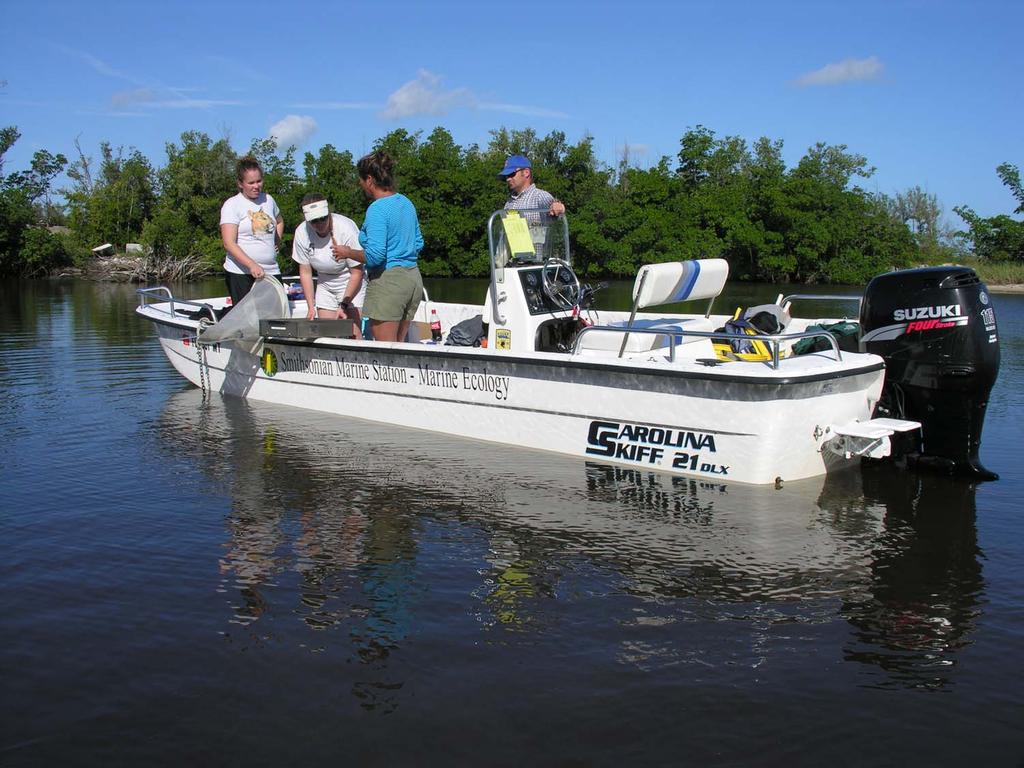
3 SAMPLING & LABORATORY PROCEDURES FOLLOW EPA AND ICES GUIDELINES 13 fixed sites sampled quarterly starting in February 2005 (15 sites from 2007), 0.02 m 2 Petite Ponar grab (three replicates per site) sieved through 0.5 mm, fixed in formalin & stained with Rose Bengal transferred to ethanol in lab Sediment cores 0-2 cm & 2-5 cm analyzed for percentage water and organic content (LOI) Environmental parameters (temp profile, salinity profile, ph, DO, turbidity, secchi depth, weather) Samples sorted in lab, identified to lowest possible taxonomic level

4 The Indian River Lagoon and The St. Lucie Estuary One of the largest estuarine water systems on the east coast of Florida The St Lucie Estuary includes: the North Fork and the South Fork (surface area of about 17 km 2 (6.4 square miles) a single Middle Estuary (surface area of 12 km 2 (4.7 square miles) C44 Canal SLE IRL HELL S GATE The middle estuary extends east for 8 km (5 miles) until it meets the Indian River Lagoon, opening to the Atlantic Ocean at the St. Lucie Inlet Diversity and function threatened by a host of ecological stressors: 1. Irregular, extreme salinity shifts 2. Accumulation of soft, reducing sediments 3. Elevated nutrient & DOM input
5 Distinct, consistent zonation patterns Structured by salinity ppt ppt ppt 3 19 ppt 2 12 ppt
6
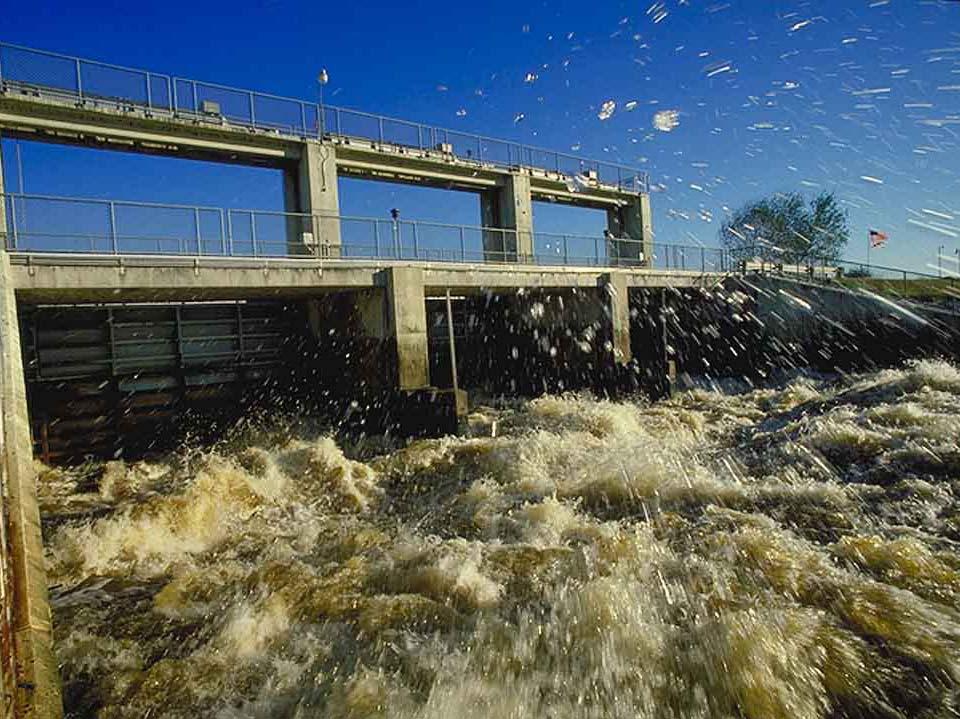
7 FRESHWATER INPUT Unstable estuarine salinity has the most significant effect Study period ( ) has witnessed extreme high flows (storm events and discharges) and extreme low flows (drought) Primary source of freshwater release is Lake Okeechobee via the C-44 canal MONTHLY MEAN DISCHARGE JANUARY JANUARY 2008 Wilma C44 C24 NORTH FORK Source: DBHYDRO 80 m 3 /sec NB! 20 0 JAN APR JUL OCT JAN APR JUL OCT JAN APR JUL OCT JAN
8 Periods of high and low discharge causes alternating shifts between estuarine and freshwater species Wilma Deteriorating water quality has led to an overall decrease in benthic diversity, coupled with an increase in pollutiontolerant species
9 CONTAMINATED SOFT SEDIMENTS (CSS) 2.0 LOI vs. TAXA and DIVERSITY Accompanies regulatory freshwater releases Large deposits of CSS affect the inner estuary Accumulation causes: oxygen depletion, build-up of ammonia and sulfide; settlement inhibition; filterfeeder exclusion STANDARD DEVIATES SLE HELL S GATE IRL LOI 0-2 cm LOI 2-5 cm TAXA DIVERSITY M1 M2 M3 M4 M5 M6 M7 M8 M9 M10 M11 M12 M13 Significant improvement past Hell s Gate and in the IRL (increased current velocity, increased tidal flushing) SITE
10 Hell s Gate a tipping point? Higher salinity (slightly) Dramatically better sediment quality Dramatic increases in species richness, diversity NUMBER OF TAXA
11 NUTRIENTS Throughout the study period, regulatory releases and precipitation (shown here) have delivered dramatic nutrient pulses to the SLE Results in classic symptoms of eutrophication, increasing biological oxygen demand, and severely decreasing D.O. in the sediment Source: DBHYDRO
12 FINDINGS Drought of has allowed assessment of low-flows to the St Lucie Estuary Initially, richness and abundance returned to the estuary A brief and relatively rainy period in late summer 2007, delivered a large pulse of nutrients to the estuary.inducing severe hypoxia and one of the worst decreases in species richness in the study period Established the importance of a wholewatershed approach and stormwater treatment STANDARD DEVIATES STANDARD DEVIATES DISSOLVED OXYGEN VS. ORGANIC NITROGEN INCREASE IN NUTRIENTS = DECREASE IN DO OXYGEN NITROGEN JAN APR JUL OCT JAN APR JUL OCT JAN APR JUL OCT SALINITY VS. TAXA DECREASE IN SALINITY = DECREASE IN SPECIES RICHNESS SALINITY M3-M6 TAXA M3-M6 JAN APR JUL OCT JAN APR JUL OCT JAN APR JUL OCT Source: DBHYDRO
13 THANK YOU!
14