Thailand s Master Plan for MSWManagement
|
|
|
- Alexis Miller
- 5 years ago
- Views:
Transcription
1 Thailand s Master Plan for MSWManagement Developments of Energy, Environment and Ecosystems (3E) Nexus Initiative for Sustainable Development in Asian Countries th January 2017 Tokyo, Japan

2 Outline Waste Classification and Technologies Waste Management and Examples in Thailand Ø Incineration (Direct burning) Ø Gasification Ø RDF (Refuse Derived Fuel) Ø Anaerobic digestion & Landfill gas Ø Plastic wastes to pyrolytic oil Co-processing in Cement Kilns Resource Recovery & Recycling Wastes having Calorific Value Thailand s MSW Situation and Master Plan Ø Energy Recovery Wastes without Calorific Value Ø Materials Recovery

3 Waste Classification Waste MSW (MunicipalSolid Waste) Industrial Wastes Hospital Wastes Non- Hazardous Hazardous Non- Hazardous Hazardous Infectious Recyclable Non- Recyclable Recyclable Non- Recyclable

 to recover Heat Energy Recovery")

4 MSW Management and Technologies MSW Non-Hazardous Hazardous Non-recyclable Recyclable Special Treatment Combustible Compostable Un-combustible and Inert Recycling Plant Combustion (direct/indirect) to recover Heat Energy Recovery Anaerobic Digestion to yield Biogas Waste-to-Energy Final Disposal or Co-processing in Cement Kiln Materials Recovery Resources Recovery
, June")
5 Source: Joint Graduate School of Energy and Environment (JGSEE), June 2016
, June")
6 Source: Joint Graduate School of Energy and Environment (JGSEE), June 2016
, June")
7 Source: Joint Graduate School of Energy and Environment (JGSEE), June 2016
, June")
8 Source: Joint Graduate School of Energy and Environment (JGSEE), June 2016
, June")
9 Source: Joint Graduate School of Energy and Environment (JGSEE), June 2016
, June")
10 Source: Joint Graduate School of Energy and Environment (JGSEE), June 2016

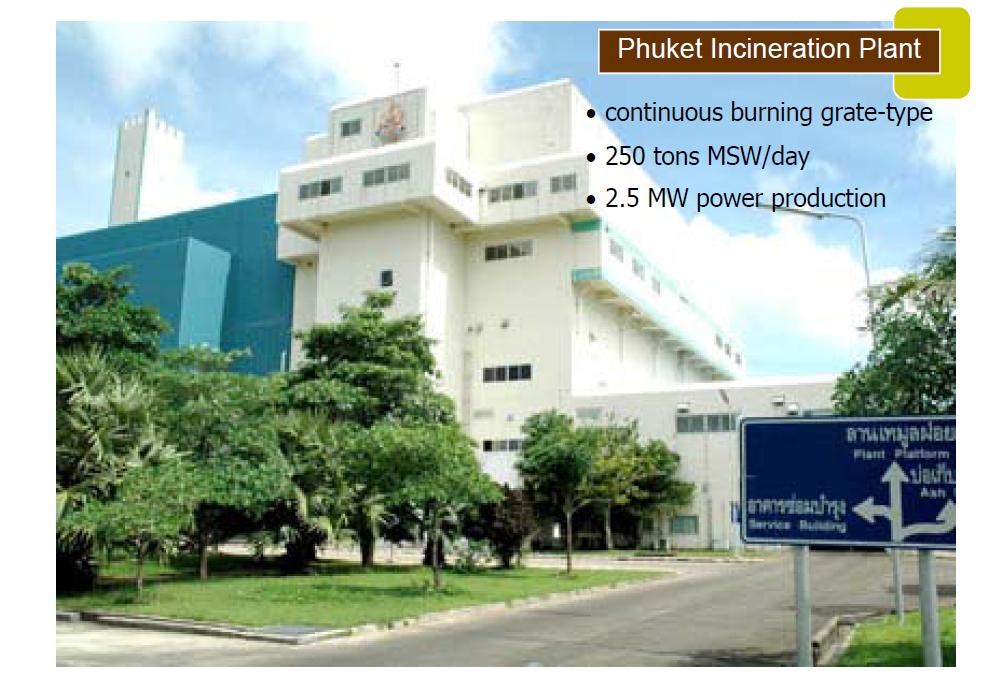
11 Combustible Wastes ð WtE / EfW

12 Combustible Wastes ð WtE / EfW Had Yai Gasification Power Plant MSW 250 tons/day 24 h Operation 1,200 o C 6.7 MW


13 Combustible Waste ð SRF/RDF Note: SRF = Solid Recovered Fuel RDF = Refuse Derived Fuel Source: Raja Equipment Ltd., 3 rd June 2011

14 Source: Raja Equipment Ltd.

15 RDF/SRF Power Plant in Thailand: TPI Polene Saraburi Province Source:
16 TPI Polene Power Public Company Limited: The Biggest WtE Power Plant in Thailand Transforming from Cement to Waste-to-Energy Play 3 WtE power plants with total licensed capacity of 143 MW. 100% stake of each project. Already signed a power purchasing agreement (PPA) with EGAT for the first two projects (total licensed capacity 73 MW) Already received LOI approval from EGAT for the 3 rd project (70 MW) Obtained a seven-year adder (incentive credit) of 3.50 THB per unit and the right of free corporate tax from BOI (the Board of Investment of Thailand ) for eight years and a 50% corporate tax discount for the next five years.
17 TPI Polene Power PLC: The Biggest WtE Power Plant in Thailand The 1 st WTE power plants (licensed capacity 18 MW): Waste Heat + RDF with installed capacity of 20 MW began operating on 16 Jan ð This project uses waste heat emitted from cement plant line No.3 line blended with RDF to generate electricity. The 2 nd WTE power plants (licensed capacity 55 MW): RDF with installed capacity of 60 MW began operating on August ð This project is designed to consume RDF to generate electricity. The 3 rd WTE power plants (licensed capacity 70 MW): Waste Heat + RDF with installed capacity of 90 MW began operating on August ð This project uses waste heat emitted from the new cement plant No.4 line. The remaining 60 MW output uses RDF. Total: = 143 MW

, but planning to reduce moisture by biological process before sending to produce RDF.")
18 Process Flow Plan Refuse Primary Crushing Drying Classifying Improve treatment effects RDF Pellets Increase calorific values and storing capability Pelletizing Remove incombustible materials Secondary Crushing Increase storing and handling Capability by pelletizing Reduce volume Note: Organic waste is now composted to produce fertilizer by Autothermal Thermophilic Aerobic Digestion (ATAD), but planning to reduce moisture by biological process before sending to produce RDF. Source: Krungsri securities Research, 4 th September 2015.

19 Process Flow Plan Fertilizer Source: TPIPL


20 RDF Specification for TPI Polene Type 1: MSW without separation No Buying 300 THB/Ton Fee Type 2: MSW with partial separation (GCV x 0.20 THB/Kcal) THB/ton Source: TPIPL
21 TPI Polene Waste heat from Cement Plant MSW, Landfill Waste, Industrial Waste RDF Organic Parts Waste Tires Waste heat recovery power RDF Plant Power Plant Organic Fertilizer Pyrolysis Oil Note: 3 Main sources for RDF (MSW 5,000 tons/day, Landfill 3,000 tons/day, Industrial Waste 1,000 tons/day)
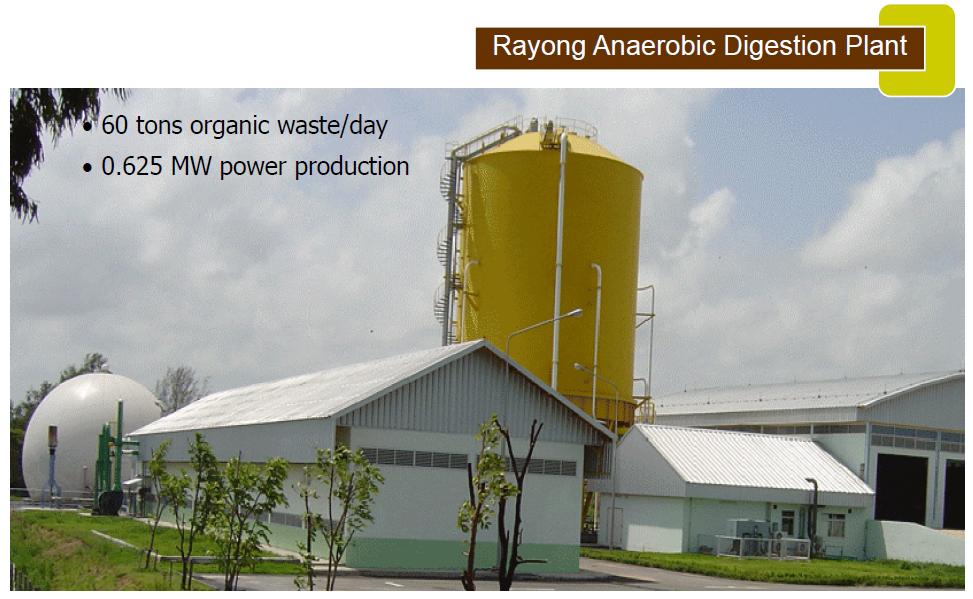

22 Compostable Wastes Biogas

23 Compostable Wastes Landfill Gas

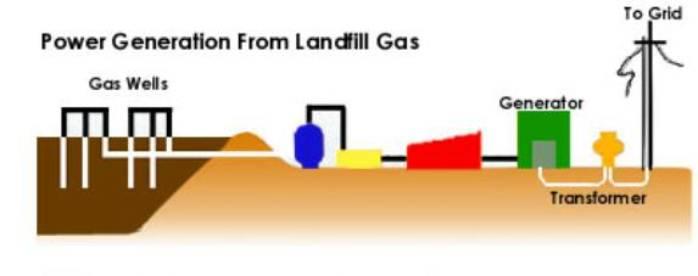
24 Landfill Site Power Plant

25 Landfill mining (mining of old landfill sites) to recovery energy and/or materials from waste is another type of resource recovery.

26 Recovery of Energy from Waste


27 Recovery of Energy from Waste

28 Pyrolysis Oil from Plastic Waste C1 C4 Liquid Oil Molten Plastic Degradation Impurities Refinery Reactor Plastic Waste Size Reduction Screw Heating Molten Plastic Source: TEI
 Pyrolysis Oil (50-60% Diesel) 4,000")
29 A Pilot Plant at Suranari University MSW MBT Plastic Waste 6,000 kg Note: MBT = Mechanical & Biological Treatment Source: TEI (Thailand Environment Institute) Pyrolysis Oil (50-60% Diesel) 4,000 5,000 L/day


30 Recovery of Metals from E-Waste Demand of material resources for 1 ton of metal: If 100 tons of electronic waste is processed then approximately 1.5 kg of gold could be recovered.
31

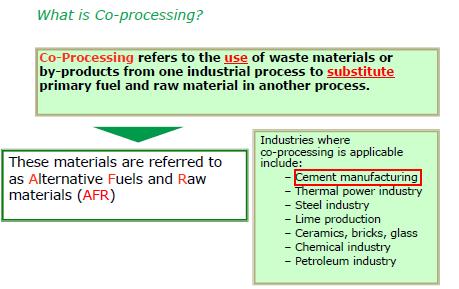
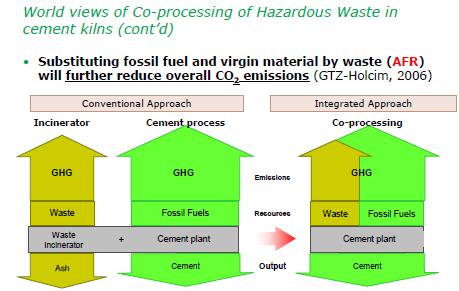
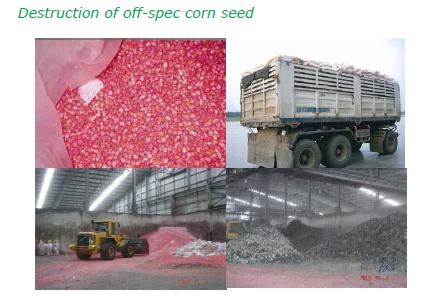
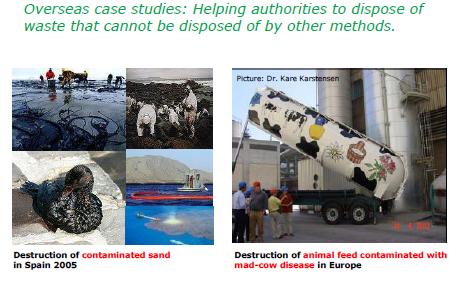
32 Transforming Waste into Alternative Fuels and Co-Process in Cement Kilns

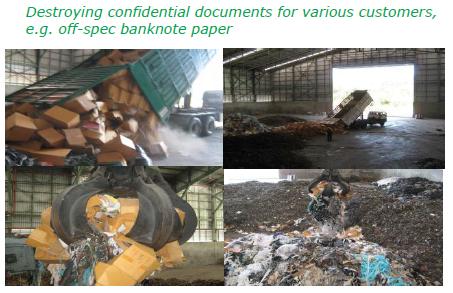
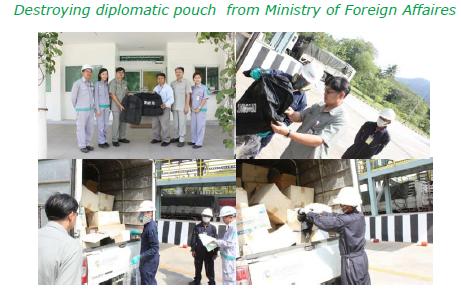
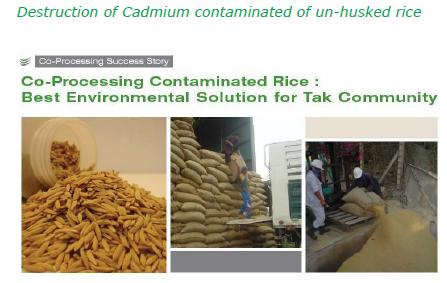
33 Cement Kilns can accept wastes with no calorific value and mineral contents ð Help solving local waste management problem. Cement industry can provide services by disposing of waste with no useful energy and mineral contents, and also heavy metal contaminated crops or even hazardous wastes.


34 Characteristics Temperature at main burner Residence time at main burner Temperature at precalciner Residence time at precalciner Temperature and Time > 1800 O C flame temperature > 5-6 sec and > 1800 O C > 1000 O C flame temperature > 2-6 sec and > 800 O C
35
36
37
38
39
40
41 Thailand s Waste Management Master Plan ( )
42 Thailand Solid Waste Situation Unit: Million Tons Generated Waste w/o Management Proper Management Utilization Pollution Control Department, September 2016

43 Thailand Solid Waste Situation 2015 Generated Waste Generated Rate Million Tons Approx. 73,560 Tons / Day Approx Kg./Person/ Day Utilization 19% 50% 50% Proper Management 31% Non-Proper Management 27% Remaining w/o Management 23% 4.94 Million Tons 8.34 Million Tons 7.15 Million Tons 6.22 Million Tons Note: As of 2014, Utilization 18%, Proper Mgt 30%, Non-proper Mgt + Remaining 52% ð Accumulated waste Million Tons, 65% of which have been managed under roadmap. Pollution Control Department, September 2016
44 More than half is non-proper management, but slightly improved from 2013 to 2015 New Generated Waste 2013 Proper Management 46% million tons Non-Proper Management + Remaining 54% million tons Utilization: 19% Proper Management 48% Utilization: 18% Non-Proper Management + Remaining 52% million tons Proper Management 50% Utilization: 19% Non-Proper Management + Remaining 50%
, June")
45 Source: Joint Graduate School of Energy and Environment (JGSEE), June 2016
46 National Waste Management Policy Promote 3R s Strategy with participation from community and recycling business, Encourage local administrations to establish central solid waste disposal facilities with integrated concept of appropriate technology and beneficial waste utilization Area Clustering Approach for establishing central MSW management facilities
47 MSW Strategic Approach 1: Integrated Waste Management System Source Reduction & Separation Waste Diversion Composting Energy Recovery Material Recovery Final Disposal (Sanitary Landfill) Opportunity: MSW Strategy and Roadmap AEDP (25% alternative energy by MW from MSW + Incentives (Adder/FIT, 8 years corporate tax exemption, 5 years 50% in corporate tax bill for AE project)
48 MSW Strategic Approach 2: Area Clustering Cluster Type Tons/Day Technology No. of area Large >500 Separation + Biological Decomposition + Incineration+ Landfill Medium Separation + Biological Decomposition + RDF/Incineration + Landfill Medium Separation + Biological Decomposition/RDF + Landfill Medium Separation + Biological Decomposition/RDF + Landfill Small <50 Separation + Biological Decomposition
, June")
49 >50% >30% Household HW 100% >75% Industrial HW 100% 100% Source: Joint Graduate School of Energy and Environment (JGSEE), June 2016
50 Promotion 3Rs Awareness raising 3 Knowledge & Technology Development Database networking Economic and social incentives. Measures 1 Reduce MSW at Source Reduce waste generation Source separation and recycling Environmental friendly production and consumption 2 Enhance Waste Management Efficiency Provide more effective waste collection Initiate waste collection cluster Provide sufficient areas for HW and infectious wastes disposal. Laws and regulations Source: Joint Graduate School of Energy and Environment (JGSEE), June 2016
51 Conclusion MSW generated million tons/year 50% non-proper management + remaining >30 million tons accumulated MSW Roadmap + AEDP All accumulated wastes & Hazardous Industrial wastes will be properly disposed by All infectious waste will be properly disposed by % LGOs have system for waste separation by % MSW and 30% HHW will be properly disposed by 2021.


52 Dr. Dawan Wiwattanadate Faculty of Engineering Chulalongkorn University Bangkok 10330, Thailand