Enhanced Nutrient Removal by Extended Aeration. Christina Edvardsson MicroSepTec, Inc
|
|
|
- Kerrie Lindsey
- 5 years ago
- Views:
Transcription
1 Enhanced Nutrient Removal by Extended Aeration Christina Edvardsson MicroSepTec, Inc
2 Typical Pathways & Conversions of Wastewater Treatment for Traditional Septic Tank with Leach Field and for the EnviroServer Influent 10 6 CFU/100 ml Fecal Coliform 260 TSS 220 CBOD 5 20 Organic-N 30 Ammonia 0 Nitrates Septic Tank: Primary Settling Anaerobic Digestion >10 5 CFU/100 ml Fecal Coliform 40 TSS 140 CBOD 5 19 Organic-N 29 Ammonia 0 Nitrates Leach Field: Filtering Anaerobic Digestion Ammonification Nitrification Nitrates Groundwater: Nitrate Contamination Traditional Influent 10 6 CFU/100 ml Fecal Coliform 260 TSS 220 CBOD 5 20 Organic-N 30 Ammonia 0 Nitrates EnviroServer: Primary/Secondary Settling Aerobic Digestion Ammonification Nitrification Denitrification Disinfection <2 CFU/100 ml Fecal Coliform 10 TSS 10 CBOD 5 4 Organic-N 1 Ammonia 2 Nitrates Subsurface Dispersal: No/Minor Reactions Biological Uptake Groundwater: <10 Nitrates EnviroServer
3 SYSTEM DRAWING High Efficiency Blowers On Board Computer Disinfection Unit Thermal Processor At Ground Level Primary Compartment Sludge Transfer Pump Aeration Diffusers Bio Solid Transfer & Denitrification Pump IAPMO TANK CERTIFICATION FOR: 600 Gallon per day Gallon per day Gallon per day
4 THERMAL PROCESSOR
5 ENVIROSERVER PROCESS REACTIONS First Comp. Second Comp. Third Comp. Forth Comp. CBOD 5 REMOVAL NITRIFICATION Organic Matter+O 2 +Nutrients NH 3 +O 2 +CO 2 +HCO 3 - Microbes Microbes DENITRIFICATION - Organic Matter+NO 3 Microbes New Microbes+N 2 +CO 2 +H 2 O New Microbes+CO 2 +H 2 O New Microbes+NO H + +H 2 O NO O 2 +CO 2 +HCO 3 Microbes - New Microbes+NO 3

6 MICROSEPTEC ENVIROSERVER SYSTEM

7 ONBOARD COMPUTER
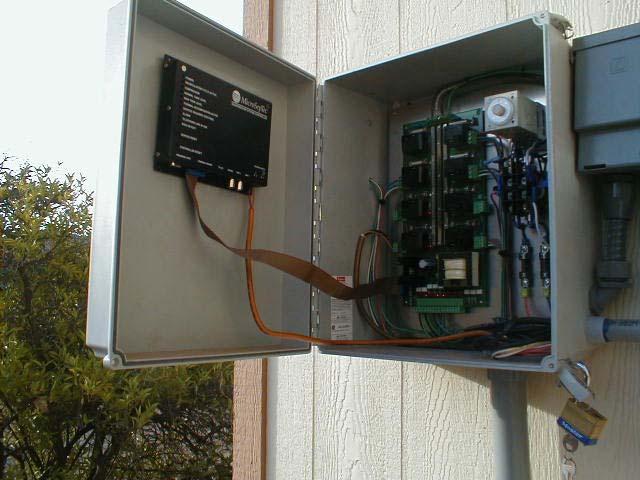
8 INSIDE CONTROLLER

9 SYSTEM STATUS VIA INTERNET
10 ENVIROSERVER RESULTS FROM THE FOLLOWING THIRD-PARTY STUDIES University of California Riverside (UCR) Ventura Regional Sanitation District (VRSD) NSF International
11 ENVIROSERVER 600 TEST UCR
12 AVERAGE HOURLY FLOW RATE 250 Flowrate, L/hr :00 4:00 8:00 12:00 16:00 20:00 Time of Day
13 WASTEWATER FLOW RATE PER PERSON DURING MAY 19 TO JULY 27, 1999 Average 39 gpcd Range 8 to 98 gpcd
14 HOURLY TKN CONCENTRATIONS FOR A WEEKDAY TKN Concentration, mg/l Influent Effluent 0 0:00 3:00 6:00 9:00 12:00 15:00 18:00 21:00 Time of Day
15 CBOD5, UCR DAILY COMPOSIT CBOD5 CONCENTRATIONS INFLUENT EFFLUENT 5/21 5/26 5/31 6/5 6/10 6/15 6/20 6/25 6/30 7/5 7/10 7/15 7/20 Date
16 UCR DAILY AVERAGE TOTAL NITROGEN TKN + NITRATE-N CONCENTRATIONS Total Nitrogen, INFLUENT EFFLUENT 0 5/21 5/26 5/31 6/5 6/10 6/15 6/20 6/25 6/30 7/5 7/10 7/15 7/20 7/25 Date
17 Total and Reactive Phosphorus, as PO UCR DAILY AVERAGE PHOSPHORUS CONCENTRATIONS TOTAL AND REACTIVE INFLUENT EFFLUENT 5/21 5/26 5/31 6/5 6/10 6/15 6/20 6/25 6/30 7/5 7/10 7/15 7/20 7/25 Date
18 MEASURED CONCENTRATIONS OF INFLUENT AND EFFLUENT WASTEWATER CONSTITUENTS CBOD5 TSS TKN Nitrate-N Total N Total P Septic Tank Typ. Influent: < Typ. Effluent: < EnviroServer, UCR Aver. Influent: Aver. Effluent: Mean Std. Dev No of Samples % Removal 97% 98% 79% 89%

19 ENVIROSERVER SYSTEM (VENTURA STUDY)

20 ONBOARD COMPUTER (VENTURA STUDY)
21 VENTURA STUDY DAILY RESULTS Total-N, CBOD5 () Influent Total-N CBOD 5 11/20 11/27 12/4 12/11 12/18 12/25 1/1 1/8 1/15 1/22 1/29 2/5 2/12 2/19 2/26 Date Influent Flow (GPD)
22 MEASURED CONCENTRATIONS OF INFLUENT AND EFFLUENT WASTEWATER CONSTITUENTS CBOD5 TSS TKN Nitrate-N Total N Total P Septic Tank Typ. Influent: < Typ. Effluent: < EnviroServer, Ventura Aver. Influent: Aver. Effluent: Mean Std. Dev No of Samples % Removal 97% 96% 48% N/A
23 TEST RESULTS FROM NSF TEST UNIT TSS - Final Effluent CBOD5 - Final Effluent Wash-Day Stress Working- Parent Stress 12-Aug Aug Aug Aug-99 1-Sep-99 6-Sep Sep Sep Sep Sep-99 1-Oct-99 6-Oct-99 Date Total Suspended Solids / CBOD5,
24 MEASURED CONCENTRATIONS OF INFLUENT AND EFFLUENT WASTEWATER CONSTITUENTS CBOD5 TSS TKN Nitrate-N Total N Total P Septic Tank Typ. Influent: < Typ. Effluent: < EnviroServer, NFS Aver. Influent: N/A Aver. Effluent: Mean N/A Std. Dev No of Samples % Removal 96% 96% 75%
25 TEST RESULTS FROM GRAB SAMPLING OF SYSTEMS CURRENTLY IN OPERATION Customer Application No. of People Vance 4 bdrm residence Fishburne 4 bdrm residence Ziegler 4 bdrm residence Cooper 6 bdrm residence Navarra Industrial Park Colison 4 bdrm residence Sampling Date BOD5 TSS TKN Nitrate-N Total-N 4 9/27/ /28/2001 < /28/ /5/ < /1/ < N/A 1/12/
26 CONCLUSIONS On-site treatment systems can efficiently remove nutrients like CBOD 5 & Total-N to less than 10, and Total-P to less than 2 during normal operation Total N & P removals are sensitive to change or upset conditions, but will return to normal after some period
27 CONCLUSIONS CBOD 5 are less sensitive for changes or upset conditions Normal hourly and daily variations of influent hydraulic and mass-loading rates had little effect on average effluent water quality
28 CONCLUSIONS Daily Composite Effluent Flows and Concentrations From UCR Study: Average Range Flow gpcd CBOD TSS 5.9 <1 14 Tot-N
29 THANK YOU MICROSEPTEC SEPTIC