TABLE OF CONTENTS LIST OF FIGURES
|
|
|
- Allen Morrison
- 5 years ago
- Views:
Transcription

1
2 TABLE OF CONTENTS 1.0 INTRODUCTION METHODS Study Area Electrofishing Surveys Snorkeling Surveys Physical Habitat Surveys Data Analysis RESULTS Electrofishing Results Snorkeling Results Physical Habitat Data DISCUSSION/CONCLUSIONS REFERENCES...23 LIST OF FIGURES Figure 1. Study area for hardhead population monitoring...3 Figure 2. Length weight regression for large rainbow trout (2007 electrofishing data) Figure 3. Length weight regression for large Sacramento suckers (2007 electrofishing data) Figure 4. Length frequency distribution of hardhead/pikeminnow for all study years (electrofishing data)...22 LIST OF TABLES Table 1. Electrofishing catch data and population estimates, SF American River, October Table 2. Summary of fish length weight data, abundance, and biomass, SF American River, October Hardhead Population Surveys Garcia and Associates (GANDA) El Dorado Hydroelectric Project (FERC No. 184) February 2008 i
3 Table 3A. Numbers of fish by species and length category observed during snorkel surveys and estimated biomass for Pool 1, SF American River, October Table 3B. Numbers of fish by species and length category observed during snorkel surveys and estimated biomass for Pool 2, SF American River, October Table 3C. Numbers of fish by species and length category observed during snorkel surveys and estimated biomass for Pool 3, SF American River, October Table 3D. Numbers of fish by species and length category observed during snorkel surveys and estimated biomass for Pool 4, SF American River, October Table 3E. Numbers of fish by species and length category observed during snorkel surveys and estimated biomass for Pool 5, SF American River, October Table 3F. Numbers of fish by species and length category observed during snorkel surveys and estimated biomass for Pool 6, SF American River, October Table 3G. Numbers of fish by species and length category observed during snorkel surveys and estimated biomass for Pool 7, SF American River, October Table 4. Physical habitat characteristics of fish population survey sites, SF American River, October Table 5. Biomass estimates (g/ac) of hardhead / Sacramento Pikeminnow in the habitat units surveyed in 2004, 2005, and APPENDICES Appendix A: Appendix B: Appendix C: 2007 Site Photos Field Datasheets for 2007 Fish Surveys Length Frequency Histograms for 2007 Electrofishing Data 2007 Hardhead Population Surveys Garcia and Associates (GANDA) El Dorado Hydroelectric Project (FERC No. 184) February 2008 ii
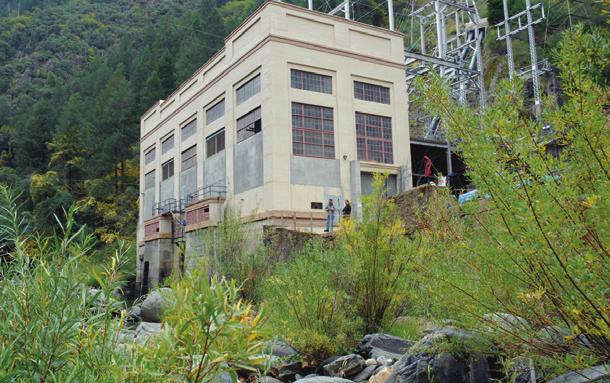
4 1.0 INTRODUCTION The El Dorado Relicensing Settlement Agreement (EID 2003) specified that at least three years of hardhead (Mylopharodon conocephalus) monitoring to be implemented by the El Dorado Irrigation District (EID) during operation of the El Dorado Hydroelectric Project (FERC #184). This effort also satisfies the Fish Population Monitoring requirements with respect to hardhead set forth in the U.S. Forest Service 4(e) License Condition No. 37 (USFS 2003), Section 7 of the El Dorado Relicensing Settlement Agreement (Settlement) Monitoring Program, and the California State Water Resources Control Board Section 401 Clean Water Act Water Quality Certification Condition No. 13a (SWRCB 2006). This monitoring effort was deemed necessary because existing data on hardhead were not sufficient to derive biomass indices for determining habitat quality in the vicinity of the Project; therefore, the USDA Forest Service (FS), the Ecological Resources Committee (ERC), and the California State Water Resources Control Board (SWRCB) requested that additional data on hardhead populations be collected for a period of three years. This additional monitoring effort focuses on the reach of the South Fork (SF) American River in the vicinity of Akin Powerhouse, where hardhead are known to be present. Ultimately, these data will be used by the resource agencies to derive biomass indices for fish in order to help describe the quality of the habitats present in the Project area. EID contracted with the Garcia and Associates (GANDA) to perform the 2007 fish population surveys near Akin Powerhouse. The 2007 surveys comprised the third year of the three year fish monitoring effort. To date, fish population monitoring in this reach has been conducted in 2004, 2005, and As in previous study years (ECORP 2005 and GANDA 2007), fish populations were surveyed in 2007 using a combination of electrofishing and snorkeling techniques. Results of the 2007 surveys are reported herein Hardhead Population Surveys Garcia and Associates (GANDA) El Dorado Hydroelectric Project (FERC No. 184) February
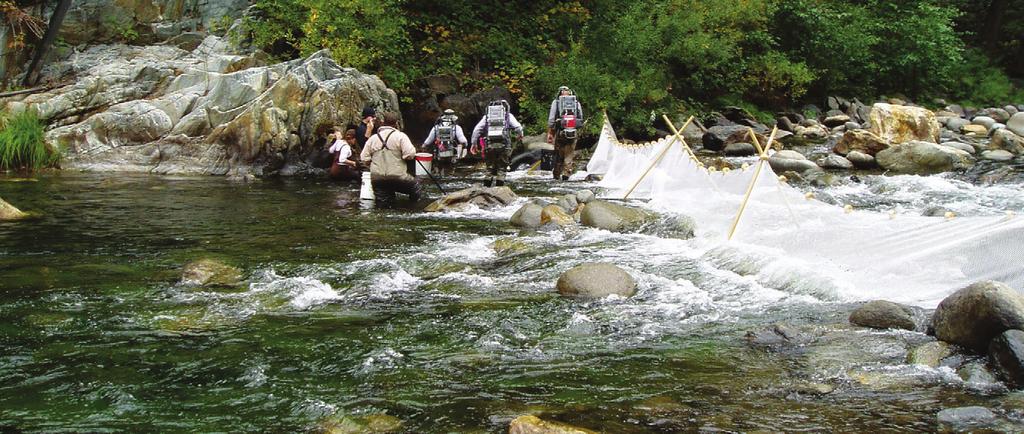
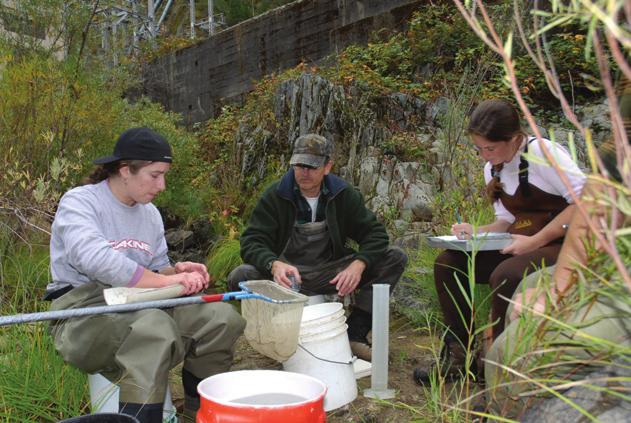
5 2.0 METHODS 2.1 Study Area The study area was comprised of the reach of the SF American River, adjacent to Akin Powerhouse, located just upstream from Slab Creek Reservoir (Figure 1). This area was identified by Thomas R. Payne Associates (TRPA) as being known to support hardhead (TRPA 1998; as cited in Exhibit E of the Settlement Agreement). Based upon TRPA s habitat evaluation, the distribution of hardhead in the SF American River is thought to be limited to an area approximately four kilometers upstream of Akin Powerhouse, just downstream of the confluence with Silver Creek. In 2007 electrofishing once again occurred in an established riffle/run site immediately adjacent to Akin Powerhouse, and snorkel surveys were conducted in the large pools upstream of the powerhouse (extending approximately 1.5 km upstream). 2.2 Electrofishing Surveys A team of eight biologists fished the 120 meter long electrofishing site adjacent to Akin Powerhouse in October 2007 using a three pass depletion method. The site was fished from bottom to top using four backpack electrofishers (Smith Root Models 12 and 15). Biologist worked in four teams of one electrofisher and one netter each. Two teams concentrated their efforts on the stream margins to focus on habitat for juvenile hardhead, while the other two teams worked together to fish the middle of the channel. All four teams moved upstream in unison. Fish collected during each pass were processed immediately upon completion of the pass. All specimens were identified to species, weighed to the nearest gram using an electronic balance, and measured to fork length (FL) using a metric fish board. A weight of 0.5 grams was assumed for fish smaller than 60 mm FL because most of these specimens were too small to reliably weigh as individuals. However, all the small hardhead (<60 mm FL) able to be identified were weighed in groups using water displacement in a graduated cylinder in order to derive a more accurate weight estimate for hardhead biomass calculations. Following each pass, processed fish were placed in a live car in an instream holding area located just outside the site. After the completion of the survey, all collected fish were redistributed throughout the site Hardhead Population Surveys Garcia and Associates (GANDA) El Dorado Hydroelectric Project (FERC No. 184) February


6 Study Area Electrofishing Snorkeling Pool 6 Pool 7 Pool 5 SMUD Power House E l d o r a d o Electrofishing Site Pool 3 Pool 2 Pool 4 o rk outh F A m er N a t i o n a l F o r e s t ive r ica n R S Akin Power House ek Pool 1 e S ilv Figure 1. Study area for hardhead population monitoring South Fork American River, California Project Location Meters Feet 1,000 rc re
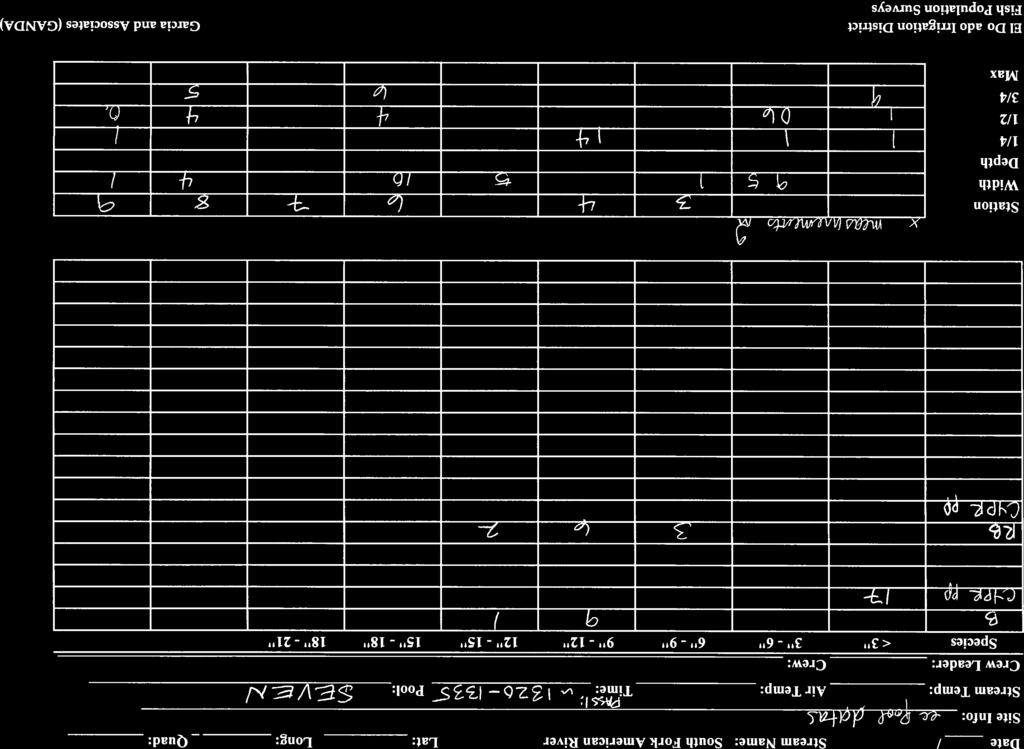
7 2.3 Snorkeling Surveys A team of five biologists performed quantitative two pass snorkel surveys in the first seven deep pools upstream of the Akin Powerhouse in October 2007 (Figure 1). At the beginning of the survey, divers entered the water at the downstream end of the pool and moved upstream at a slow and deliberate pace in parallel lanes. Divers enumerated, identified, and visually estimated the lengths of all fish observed while moving upstream in unison. Divers in the two outside lanes carefully searched the stream margins and submerged bank vegetation for juvenile fish. Special attention was paid to ensure that all members of the snorkeling team stayed on the same pace and covered all aspects of each pool. Divers in adjacent lanes communicated with each other regarding any fish that split lanes or moved from one lane to another so that no fish were missed or double counted. Fish of each species were categorized into predefined three inch (76mm) length classes (in order to be consistent with the previous survey efforts) and all data were recorded on wrist mounted dive slates. Juvenile hardhead and Sacramento Pikeminnow (<6 inches) were combined in the analysis of snorkeling data, because of the uncertainty of positively identifying these fish. For the first pass, divers began at Pool 1 and worked upstream through all seven pools. After completing the first pass in all pools, divers repeated their effort on a second pass in order to verify their observations. A minimum of 30 minutes was allowed for fish to re equilibrate in a given pool between passes. For logistical reasons, the second pass was made in reverse, beginning at Pool 7 and ending at Pool 1. Mean values from the two passes were used for calculating fish abundance and for estimating biomass. 2.4 Physical Habitat Surveys Physical habitat characteristics at each site were measured concurrently with fish population surveys (i.e., at the end of the three pass depletion for the electrofishing site, and between snorkeling passes for the pools). Measured parameters included site length, width, and depth. Mean depth and maximum depth were measured across a minimum of 10 width transects spaced evenly along the length of each site. For deeper pool transects, depths were estimated visually In 2007, physical habitat parameters were measured at Pools 3, 4, 6, and 7, where physical habitat surveys had not been completed during previous monitoring efforts. Physical habitat data for the electrofishing site and Pools 1, 2, and 5 were collected during the 2005 fish monitoring effort. It was assumed that site 2007 Hardhead Population Surveys Garcia and Associates (GANDA) El Dorado Hydroelectric Project (FERC No. 184) February
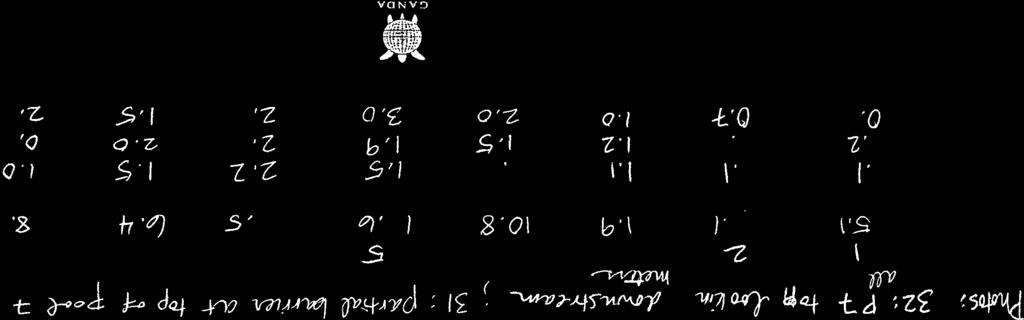
8 dimensions did not change significantly between surveys years given the stability of the channel in this reach (e.g., the predominance of bedrock features, etc.). In 2007, all sites were documented with digital photographs and the locations of each site (i.e., the upstream and downstream boundaries) were recorded using a hand held Garmin GPS unit. 2.5 Data Analysis All data were entered into Microsoft Excel spreadsheets. Electrofishing data were analyzed using the MicroFish 3.0 software package, which is based on the removal depletion model (Van Deventer and Platts 1989) in order to generate fish population estimates per site. Fish abundance was calculated as the number of fish per acre for each species based on site dimensions. Biomass estimates were made by extrapolating the total weight of the catch per species (using the population estimates and length weight relationships of the fish captured) and dividing by total site area. Biomass estimates are reported as grams of fish per acre for each species. Biomass estimates for the snorkeling data were determined by extrapolating the length weight data from the electrofishing survey. For each species and (3 inch) size class observed, the mean value for the corresponding fish species and size measured during the electrofishing effort was used to estimate weights per fish. This value was then multiplied by the mean number of fish observed in each size class during the snorkel surveys (fractional mean values were rounded up to the nearest whole number by convention such that a mean of 4.5 fish was treated as 5 fish). This method was used in all cases except for the two largest size classes (i.e., the and inch classes; [ mm and mm]) of rainbow trout (Oncorhynchus mykiss) and Sacramento sucker (Catostomus occidentalis), where the specimens observed during snorkeling were larger than any captured during the electrofishing survey. Weights for these larger fish were calculated using the length weight relationship for the larger sized fish (>6 inches FL) of each species captured during electrofishing. These specimens were assigned the estimated weight of the median fish in each three inch size class (i.e., a 13.5 inch [343 mm] fish for the inch class, and a 16.5 inch [419 mm] fish for the inch class) based on the length weight regression equations for each species. Age structure of the sampled populations was determined from lengthfrequency relationships for individual species. Growth rates reported by Moyle (2002) were compared with the length frequency histograms created from this data set to verify reasonable growth rates and generate realistic age structures Hardhead Population Surveys Garcia and Associates (GANDA) El Dorado Hydroelectric Project (FERC No. 184) February
9 Condition factor (the ratio of fish weight to length) was calculated for electrofishing data following Anderson and Gutreuter (1983) as: CF = [Weight (g) X 100,000]/Length (mm)³ Condition factor is commonly used as a general measure of fish health. Condition factor calculations were limited to fish 60 mm or larger, because this is roughly the minimum size for which an accurate individual weight can be obtained in the field using an electronic balance. Furthermore, condition factor values are interpreted for trout species only, because it is unclear how condition factor varies among species or groups of fishes with different body plans (e.g., cyprinids such as hardhead and Sacramento pikeminnow [Ptychocheilus grandis], which tend naturally to be more fusiform. Among trout, condition factors greater than 1.0 are considered indicative of relatively good health. It is assumed, for example, that for most cyprinids (e.g., hardhead, pikeminnow), slightly lower condition factor values would be expected because these fish are typically thinner than trout of a given length. However, because variations in condition factor values are poorly understood for non trout species, condition factor interpretations are limited to trout only. Although all fish were identified to species in 2007, small hardhead and small Sacramento pikeminnow specimens are somewhat difficult to distinguish from each other in the field. Indeed, small hardhead and small Sacramento pikeminnow were not completely differentiated during the field surveys in 2004 and Therefore, for any between year comparisons (of 2004, 2005, and 2007 data), juveniles specimens (approximately 60mm with fish in the hand and approximately 150 mm for observations made while snorkeling) of these species are lumped together as hardhead/pikeminnow Hardhead Population Surveys Garcia and Associates (GANDA) El Dorado Hydroelectric Project (FERC No. 184) February
10 3.0 RESULTS Seven species of fish were observed during the 2007 hardhead surveys. Juvenile hardhead (Mylopharodon conocephalus) and Sacramento pikeminnow (Ptychocheilus grandis) were the most abundant species during both electrofishing and snorkeling surveys. Sacramento sucker (Catostomus occidentalis) was also relatively common. Rainbow trout (Oncorhynchus mykiss), brown trout (Salmo trutta), speckled dace (Rhinichthys osculus), and riffle sculpin (Cottus gulosus) were observed in relatively small numbers. Photographs of electrofishing and snorkeling sites are provided in Appendix A. Copies of original field datasheets are provided in Appendix B. Lengthfrequency histograms for each species collected during electrofishing are presented in Appendix C. 3.1 Electrofishing Results GANDA biologists captured a total of 662 fish from the 120 meter electrofishing site (for an estimated population of 1,022 fish total, a total abundance 1,529 fish/acre, and a total biomass of 6,860 g/acre). Catch data and population estimates for each species are provided in Table 1. Summaries of fish lengthweight data, abundance, and biomass estimates by species are presented in Table 2. Hardhead was the most abundant species captured during the electrofishing survey (721 fish/acre). The length frequency distribution for this species (Appendix C) suggests that all of the hardhead collected were young of the year (YOY), ranging in size from 29 mm to 83 mm FL. Hardhead had the third highest biomass of all species collected at the electrofishing site despite the presence of only smaller fish (747 g/acre). Sacramento pikeminnow was the second most abundant species collected (494 fish/acre). Most pikeminnow appear to have been YOY (in the mm FL range), although a few of the larger fish ( mm FL) may have been age 1+ fish (Appendix C). Pikeminnow had the fourth highest biomass of all species collected at the electrofishing site (541 g/acre). Sacramento sucker was the third most abundant species collected (156 fish/acre). Suckers ranged in size from 57 mm to 274 mm FL. More age classes are apparent on length frequency distribution for this species including YOY, age 1+, and age 2007 Hardhead Population Surveys Garcia and Associates (GANDA) El Dorado Hydroelectric Project (FERC No. 184) February
11 2+ fish (Appendix C). Suckers, which tended to be among the largest specimens collected, had the highest biomass of all species collected at the electrofishing site (2,613 g/acre). Riffle sculpin was the next most abundant species collected during electrofishing (73 fish/acre). Sculpin were common in the riffle habitats within the electrofishing site. Sculpin ranged in size from 35 mm to 100 mm FL. The length frequency distribution for sculpin suggests the presence of YOY, age 1+, and age 2+ fish (Appendix C). Age 2+ fish appeared to be the most abundant age class (although, age 3+ may also be included in this group), which may reflect a higher capture efficiency for larger sculpin. Sculpin had the sixth highest biomass of all species collected during electrofishing (295 g/acre). Rainbow trout was the next most abundant species collected during electrofishing (41 fish/acre). Rainbow trout ranged in size from 59 mm to 320 mm FL. Most rainbow trout captured were YOY and age 1+ fish with several 2+ or possibly older fish (the ability to interpret the length frequency distribution in Appendix C is somewhat limited with respect to the larger rainbow specimens due to the limited number of individuals captured). These trout were in good condition as indicated by a mean condition factor of 1.05 (Table 2). Rainbow trout, which tended to be among the largest specimens collected, had the second highest biomass of all species collected at the electrofishing site (2,374 g/acre). Speckled dace was equally abundant as rainbow trout at the electrofishing site (41 fish/acre). Speckled dace were more common in riffle habitats. Dace ranged in size from 40 to 96 mm FL. Most dace were YOY, age 1+ and age 2+ fish (Appendix C). Dace had the lowest biomass of all species collected during electrofishing (81 g/acre). Brown trout was the least abundant species collected at the electrofishing site (3 fish/acre). Brown trout was the only non native fish species encountered. The two brown trout collected (89 and 300 mm FL) were probably YOY and age 2+, respectively. These fish were in good condition as indicated by a mean condition factor of 1.07 (Table 2). Brown trout had the fifth highest biomass of all species collected during electrofishing (504 g/acre) despite the fact that only two individuals were captured Hardhead Population Surveys Garcia and Associates (GANDA) El Dorado Hydroelectric Project (FERC No. 184) February
12 Table 1. Electrofishing catch data and population estimates, SF American River, October FISH SPECIES Pass 1 Pass 2 Pass 3 Total Catch Lower 95% Confidence Limit Upper 95% Confidence Limit Population Estimate Rainbow trout Brown trout Hardhead Sacramento pikeminnow Sacramento sucker Riffle sculpin Speckled dace TOTAL ,348 1,022 Table 2. Summary of fish length weight data, abundance, and biomass, SF American River, October FISH SPECIES Length Range (mm FL) Mean length (mm FL) Mean Weight (g) Mean Condition Factor 2 Total Weight (g) Abundance (fish/acre) Biomass (g/acre) Rainbow trout , ,374 Brown trout Hardhead Sacramento pikeminnow Sacramento sucker , ,613 Riffle sculpin Speckled dace TOTAL 1,529 6,860 1 Values are based on fish >60mm FL (n=4), the minimum size to obtain an accurate individual weight in the field 2 Fish smaller than 60 mm FL were assumed to weigh 0.5 g, except hardhead, for which a group weight was calculated: 242 fish weighed 190 grams (0.79 g/fish). Biomass estimates were based on population estimates calculated with Microfish Hardhead Population Surveys Garcia and Associates (GANDA) El Dorado Hydroelectric Project (FERC No. 184) February
13 3.2 Snorkeling Results Juvenile hardhead and pikeminnow were also the most abundant species observed during the snorkeling portion of the 2007 surveys. Most of these fish were found along the vegetated margins, although some schools appeared to move into the middle of the channel by afternoon. Hardhead were observed through Pool 7, where there may be a partial barrier to migration in some years (see Figure A 17); however, we were unable to confirm the upstream extent to the distribution of hardhead. Rainbow trout was the next most abundant species observed. Rainbow trout were concentrated around the head of the pools during snorkel surveys. Rainbow trout observed ranged from age 1+ to age 4+ (possibly 5+). No YOY trout were observed in pools. Sacramento sucker was the only other species observed during snorkel surveys (four adult suckers were observed during the snorkel surveys). No brown trout, riffle sculpin, or speckled dace were observed during snorkel surveys. Of the seven pools surveyed, the highest total fish abundance was observed in Pool 1 (1,061 fish/acre) and the lowest abundance was observed in Pool 2 (125 fish/acre). Total fish biomass was highest for Pool 7 (27,639 g/acre) and lowest for Pool 3 (1,617 g/acre). High fish biomass in Pool 7 was due to the presence of numerous large rainbow trout within a relatively small total pool area (0.12 acres) fish observations and biomass estimates are summarized per species in Tables 3A 3G below. As described in the methods section, biomass estimates for larger rainbow trout and suckers that were only observed during snorkeling were derived from length weight regressions of the electrofishing data. The regressions are presented in Figures 2 and 3 below. 3.3 Physical Habitat Data The 120 meter long electrofishing site covered 0.70 acres, averaging 23.6 meters wide and 0.5 meters deep (max depth 1.0 meters). Of the seven pools surveyed, Pool 1 was the largest, covering 1.69 acres. Pool 1 was 230 meters long and averaged 29.7 meters wide and 2.7 meters deep (max depth 8.0 meters). Pool 7 was the smallest pool surveyed, covering only 0.12 acres. Pool 7 was 50 meters long and averaged 9.9 meters wide and 1.5 meters deep (max depth 12.0 meters). Physical habitat parameters for all sites are summarized in Table 4 below Hardhead Population Surveys Garcia and Associates (GANDA) El Dorado Hydroelectric Project (FERC No. 184) February
14 Table 3A. Numbers of fish by species and length category observed during snorkel surveys and estimated biomass for Pool 1, SF American River, October POOL 1 Length Category (inches) 6,831 m 2 or 1.70 acres Mean #Fish Observed 1 Total Weight (g) Abundance (fish/acre) Biomass (g/acre) Rainbow trout (Pass 1, Pass 2) 0, 0 0, 0 4, 0 4, 2 0, 0 0, 0 Unidentified trout (Pass 1, Pass 2) 0, 0 0, 0 1, 0 1, 0 0, 0 0, 0 Hardhead/pikeminnow 1, ,796 1, ,025 (Pass 1, Pass 2) 2880, 709 1, 0 0, 0 0, 0 0, 0 0, 0 Sacramento sucker (Pass 1, Pass 2) 0, 0 0, 0 0, 0 0, 0 0, 1 0, 0 Riffle sculpin (Pass 1, Pass 2) 0, 0 0, 0 0, 0 0, 0 0, 0 0, 0 Speckled dace (Pass 1, Pass 2) 0, 0 0, 0 0, 0 0, 0 0, 0 0, 0 TOTAL 1, ,804 3,106 1,061 1,842 1 Estimated numbers of individuals and biomass projections are presented as the mean of the two passes; Fish estimates are rounded up to the next whole number Hardhead Population Surveys Garcia and Associates (GANDA) El Dorado Hydroelectric Project (FERC No. 184) February
15 Table 3B. Numbers of fish by species and length category observed during snorkel surveys and estimated biomass for Pool 2, SF American River, October POOL 2 Length Category (inches) 1,470 m 2 or 0.36 acres Mean #Fish Observed 1 Total Weight (g) Abundance (fish/acre) Biomass (g/acre) Rainbow trout , ,347 (Pass 1, Pass 2) 0, 0 0, 0 1, 1 4, 3 2, 0 1, 1 Unidentified trout (Pass 1, Pass 2) 0, 0 0, 0 0, 0 0, 0 0, 0 0, 0 Hardhead/pikeminnow (Pass 1, Pass 2) 2, 72 0, 0 0, 0 0, 0 0, 0 0, 0 Sacramento sucker (Pass 1, Pass 2) 0, 0 0, 0 0, 0 0, 0 0, 0 0, 0 Riffle sculpin (Pass 1, Pass 2) 0, 0 0, 0 0, 0 0, 0 0, 0 0, 0 Speckled dace (Pass 1, Pass 2) 0, 0 0, 0 0, 0 0, 0 0, 0 0, 0 TOTAL , ,444 1 Estimated numbers of individuals and biomass projections are presented as the mean of the two passes; Fish estimates are rounded up to the next whole number Hardhead Population Surveys Garcia and Associates (GANDA) El Dorado Hydroelectric Project (FERC No. 184) February
16 Table 3C. Numbers of fish by species and length category observed during snorkel surveys and estimated biomass for Pool 3, SF American River, October POOL 3 Length Category (inches) 2,908 m 2 or 0.72 acres Mean #Fish Observed 1 Total Weight (g) Abundance (fish/acre) Biomass (g/acre) Rainbow trout (Pass 1, Pass 2) 0, 0 0, 0 0, 0 0, 0 0, 0 0, 0 Unidentified trout (Pass 1, Pass 2) 0, 0 0, 0 0, 0 0, 0 0, 0 0, 0 Hardhead/pikeminnow (Pass 1, Pass 2) 3, 381 0, 0 0, 0 0, 0 0, 0 0, 0 Sacramento sucker ,357 (Pass 1, Pass 2) 0, 0 0, 0 0, 0 0, 0 0, 1 1, 0 Riffle sculpin (Pass 1, Pass 2) 0, 0 0, 0 0, 0 0, 0 0, 0 0, 0 Speckled dace (Pass 1, Pass 2) 0, 0 0, 0 0, 0 0, 0 0, 0 0, 0 TOTAL , ,617 1 Estimated numbers of individuals and biomass projections are presented as the mean of the two passes; Fish estimates are rounded up to the next whole number Hardhead Population Surveys Garcia and Associates (GANDA) El Dorado Hydroelectric Project (FERC No. 184) February
17 Table 3D. Numbers of fish by species and length category observed during snorkel surveys and estimated biomass for Pool 4, SF American River, October POOL 4 Length Category (inches) 1,055 m 2 or 0.26 acres Mean #Fish Observed 1 Total Weight (g) Abundance (fish/acre) Biomass (g/acre) Rainbow trout , ,720 (Pass 1, Pass 2) 0, 0 3, 2 5, 1 3, 2 3, 0 0, 0 Unidentified trout (Pass 1, Pass 2) 0, 0 0, 0 0, 0 0, 0 0, 0 0, 0 Hardhead/pikeminnow (Pass 1, Pass 2) 163, 75 0, 0 0, 0 0, 0 0, 0 0, 0 Sacramento sucker (Pass 1, Pass 2) 0, 0 0, 0 0, 0 0, 0 0, 0 0, 0 Riffle sculpin (Pass 1, Pass 2) 0, 0 0, 0 0, 0 0, 0 0, 0 0, 0 Speckled dace (Pass 1, Pass 2) 0, 0 0, 0 0, 0 0, 0 0, 0 0, 0 TOTAL , ,158 1 Estimated numbers of individuals and biomass projections are presented as the mean of the two passes; Fish estimates are rounded up to the next whole number Hardhead Population Surveys Garcia and Associates (GANDA) El Dorado Hydroelectric Project (FERC No. 184) February
18 Table 3E. Numbers of fish by species and length category observed during snorkel surveys and estimated biomass for Pool 5, SF American River, October POOL 5 Length Category (inches) 1,827 m 2 or 0.45 acres Mean #Fish Observed 1 Total Weight (g) Abundance (fish/acre) Biomass (g/acre) Rainbow trout ,183 (Pass 1, Pass 2) 1, 0 0, 1 3, 4 1, 3 1, 0 0, 0 Unidentified trout (Pass 1, Pass 2) 0, 0 0, 0 0, 0 0, 0 0, 0 0, 0 Hardhead/pikeminnow (Pass 1, Pass 2) 60, 190 0, 0 0, 0 0, 0 0, 0 0, 0 Sacramento sucker (Pass 1, Pass 2) 0, 0 0, 0 0, 0 0, 0 0, 0 0, 0 Riffle sculpin (Pass 1, Pass 2) 0, 0 0, 0 0, 0 0, 0 0, 0 0, 0 Speckled dace (Pass 1, Pass 2) 0, 0 0, 0 0, 0 0, 0 0, 0 0, 0 TOTAL , ,449 1 Estimated numbers of individuals and biomass projections are presented as the mean of the two passes; Fish estimates are rounded up to the next whole number Hardhead Population Surveys Garcia and Associates (GANDA) El Dorado Hydroelectric Project (FERC No. 184) February
19 Table 3F. Numbers of fish by species and length category observed during snorkel surveys and estimated biomass for Pool 6, SF American River, October POOL 6 Length Category (inches) 1,561 m 2 or 0.39 acres Mean #Fish Observed 1 Total Weight (g) Abundance (fish/acre) Biomass (g/acre) Rainbow trout (Pass 1, Pass 2) 0, 0 0, 0 0, 0 0, 0 0, 0 0, 0 Unidentified trout (Pass 1, Pass 2) 0, 0 0, 0 0, 0 0, 0 0, 0 0, 0 Hardhead/pikeminnow (Pass 1, Pass 2) 134, 60 0, 0 0, 0 0, 0 0, 0 0, 0 Sacramento sucker ,475 (Pass 1, Pass 2) 0, 0 0, 0 0, 0 0, 0 0, 0 1, 0 Riffle sculpin (Pass 1, Pass 2) 0, 0 0, 0 0, 0 0, 0 0, 0 0, 0 Speckled dace (Pass 1, Pass 2) 0, 0 0, 0 0, 0 0, 0 0, 0 0, 0 TOTAL ,717 1 Estimated numbers of individuals and biomass projections are presented as the mean of the two passes; Fish estimates are rounded up to the next whole number Hardhead Population Surveys Garcia and Associates (GANDA) El Dorado Hydroelectric Project (FERC No. 184) February
20 Table 3G. Numbers of fish by species and length category observed during snorkel surveys and estimated biomass for Pool 7, SF American River, October POOL 7 Length Category (inches) 494 m 2 or 0.12 acres Mean #Fish Observed 1 Total Weight (g) Abundance (fish/acre) Biomass (g/acre) Rainbow trout , ,474 (Pass 1, Pass 2) 0, 0 0, 0 0, 3 9, 16 1, 2 0, 0 Unidentified trout (Pass 1, Pass 2) 0, 0 0, 0 0, 0 0, 0 0, 0 0, 0 Hardhead/pikeminnow (Pass 1, Pass 2) 17, 25 0, 0 0, 0 0, 0 0, 0 0, 0 Sacramento sucker (Pass 1, Pass 2) 0, 0 0, 0 0, 0 0, 0 0, 0 0, 0 Riffle sculpin (Pass 1, Pass 2) 0, 0 0, 0 0, 0 0, 0 0, 0 0, 0 Speckled dace (Pass 1, Pass 2) 0, 0 0, 0 0, 0 0, 0 0, 0 0, 0 TOTAL , ,639 1 Estimated numbers of individuals and biomass projections are presented as the mean of the two passes; Fish estimates are rounded up to the next whole number Hardhead Population Surveys Garcia and Associates (GANDA) El Dorado Hydroelectric Project (FERC No. 184) February
21 y = x R 2 = Weight (g) Fork Length (mm) Figure 2. Length Weight Regression for Large Rainbow Trout (2007 Electrofishing Data) 2007 Hardhead Population Surveys El Dorado Hydroelectric Project (FERC No. 184) 18 Garcia and Associates (GANDA) February 2008
22 y = x R 2 = Weight (g) Fork Length (mm) Figure 3. Length Weight Regression for Large Sacramento Suckers (2007 Electrofishing Data) 2007 Hardhead Population Surveys El Dorado Hydroelectric Project (FERC No. 184) 19 Garcia and Associates (GANDA) February 2008
23 Table 4. Physical habitat characteristics of fish population survey sites, SF American River, October SITE Length (m) Width (m) Mean Depth (m) Max Depth (m) Area (m 2 ) Area (acres) Area (hectares) E Fishing , Pool , Pool , Pool , Pool , Pool , Pool , Pool , Hardhead Population Surveys Garcia and Associates (GANDA) El Dorado Hydroelectric Project (FERC No. 184) February
24 4.0 DISCUSSION/CONCLUSIONS Moyle (2002) reports that hardhead typically spawn in April and May, but can prolong spawning activities into August. This characterization is consistent with the age/size class distributions observed in the study area of the SF American River. As indicted by the abundance of juvenile hardhead present, hardhead spawning almost certainly occurs within the study area. However, no adult hardhead (or pikeminnow) were observed in either the shallow riffle/run/pocket water habitats of the electrofishing site adjacent to Akin Powerhouse, or in the deep pools upstream of the powerhouse during either the 2004, 2005 or 2007 surveys. In previous study years (2004 and 2005) not all hardhead and Sacramento pikeminnow were able to be identified to species during electrofishing surveys, nor could the small juveniles be identified during snorkeling surveys. A lengthfrequency histogram for these two species combined is presented for all survey years electrofishing data in Figure 4 for reference. In 2004 and 2005, the total number of cyprinids (i.e., hardhead plus pikeminnow) was assumed to be approximately 90 percent hardhead and 10 percent pikeminnow; these estimates were based upon those individuals positively identified during the elecrofishing surveys. In 2007, this ratio in the electrofishing data was approximately 60 percent hardhead and 40 percent pikeminnow (based on either total catch, abundance, or biomass). Population estimates for both Hardhead and Sacramento pikeminnow appear to be higher in 2007 than in 2005, especially the number of Sacramento pikeminnow. Biomass estimates for cyprinids was also higher in 2007 than in prior years in most habitat units sampled (Table 5). Biomass estimates in pools 1 and 2 were higher in 2004 than in 2005, whereas the biomass estimate in the electrofishing site was higher in 2005 than in Table 5. Biomass estimates (g/ac) of hardhead / Sacramento Pikeminnow in the habitat units surveyed in 2004, 2005, and E fish Pool 1 Pool 2 Pool 3 Pool 4 Pool 5 Pool 6 Pool ,288 1, Biomass for these pools is based on qualitative, single pass observation Hardhead Population Surveys Garcia and Associates (GANDA) El Dorado Hydroelectric Project (FERC No. 184) February
25 Number of Fish Fork Length (mm) Figure 4. Length Frequency Distribution of Hardhead/Pikeminnow for All Study Years (Electrofishing Data) 2007 Hardhead Population Surveys El Dorado Hydroelectric Project (FERC No. 184) 22 Garcia and Associates (GANDA) February 2008
26 5.0 REFERENCES Anderson, R. O. and Gutreuter, S. J Length, weight, and associated structural indices. Pages in L. A. Nielsen, D. L. Johnson, and S. S. Lampton, editor. Fisheries Techniques. American Fisheries Society, Bethesda, Maryland. ECORP Hardhead Fishery Survey Data Report, El Dorado Irrigation District, Hydroelectric Project 184. Draft Report prepared for the El Dorado Irrigation District, May El Dorado Irrigation District El Dorado Relicensing Settlement Agreement. El Dorado Project FERC Project No pp + appendices. GANDA Hardhead (Mylopharodon conocephalus) Surveys in the South Fork American River. Report prepared for El Dorado Irrigation District. February, pp + Appendices. Moyle, P. B Inland Fishes of California. University of California Press, Berkeley. 502 pages. Thomas R. Payne Associates (TRPA) Results of the South Fork American River Hardhead Survey. A memorandum to Roy McDonald of Resource Insights dated October 1, Submitted by Mark Allen of Thomas R. Payne Associates, Arcata, California. (As cited in Exhibit E of the Settlement Agreement). Van Deventer, J. S., and W. S Platts MicroFish 3.0. Forestry Sciences Laboratory, United States Forest Service. Sub consultants Doug Parkinson and Associates P.O. Box 131, Bayside, CA (707) dpa@humboldt1.com 2007 Hardhead Population Surveys Garcia and Associates (GANDA) El Dorado Hydroelectric Project (FERC No. 184) February
27 Appendix A: 2007 Site Photos


28 Figure A 1 Looking toward bottom of electrofishing site with net in place in the distance Figure A 2 Looking toward top of electrofishing site with net in place


29 Figure A 3 Bottom of Pool 1 looking upstream Figure A 4 Top of Pool 1 looking downstream


30 Figure A 5 Bottom of Pool 2 looking upstream Figure A 6 Top of Pool 2 looking downstream


31 Figure A 7 Bottom of Pool 3 looking upstream Figure A 8 Top of Pool 3 looking downstream


32 Figure A 9 Bottom of Pool 4 looking upstream Figure A 10 Top of Pool 4 looking downstream


33 Figure A 11 Bottom of Pool 5 looking upstream Figure A 12 Top of Pool 5 looking downstream


34 Figure A 13 Bottom of Pool 6 looking upstream Figure A 14 Top of Pool 6 looking downstream


35 Figure A 15 Bottom of Pool 7 looking upstream Figure A 16 Top of Pool 7 looking downstream

36 Figure A 17 Partial barrier at the top of Pool 7
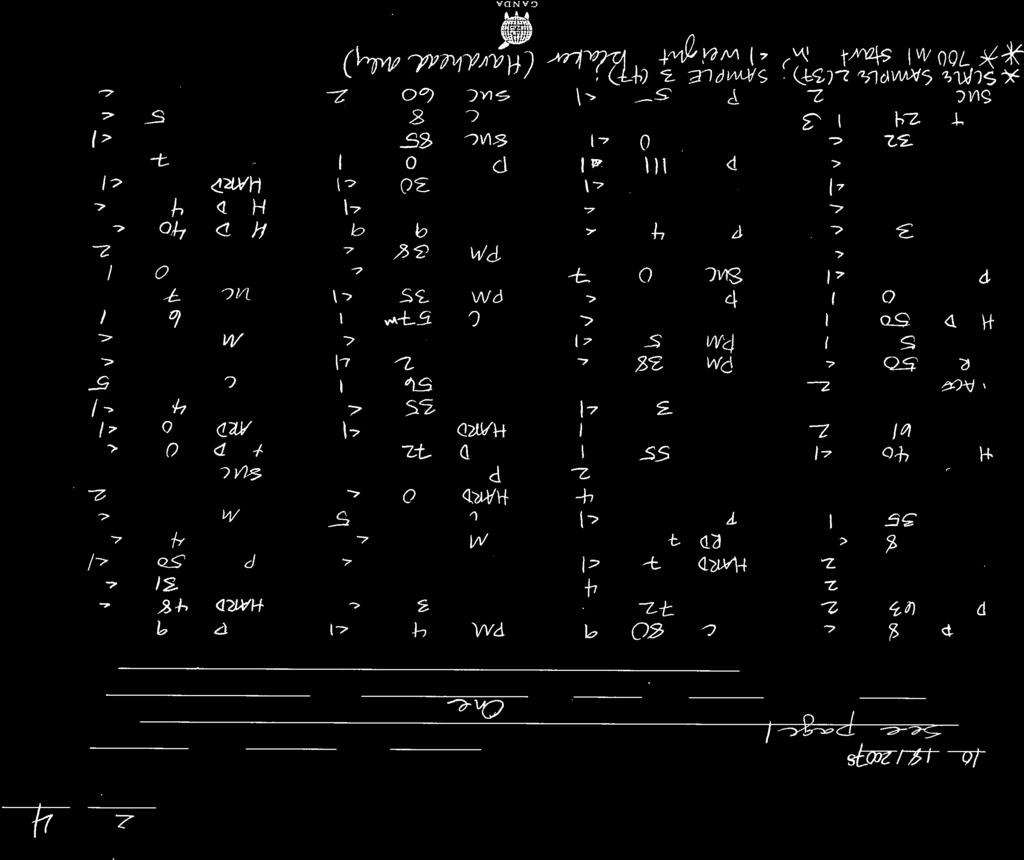
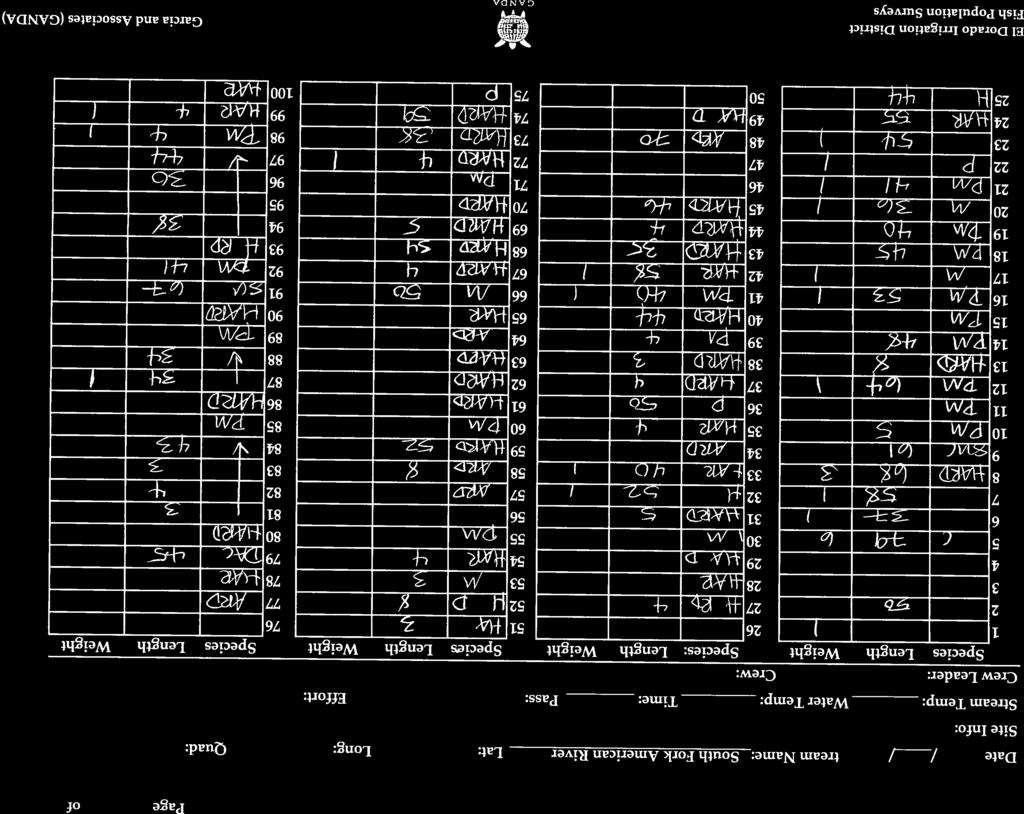
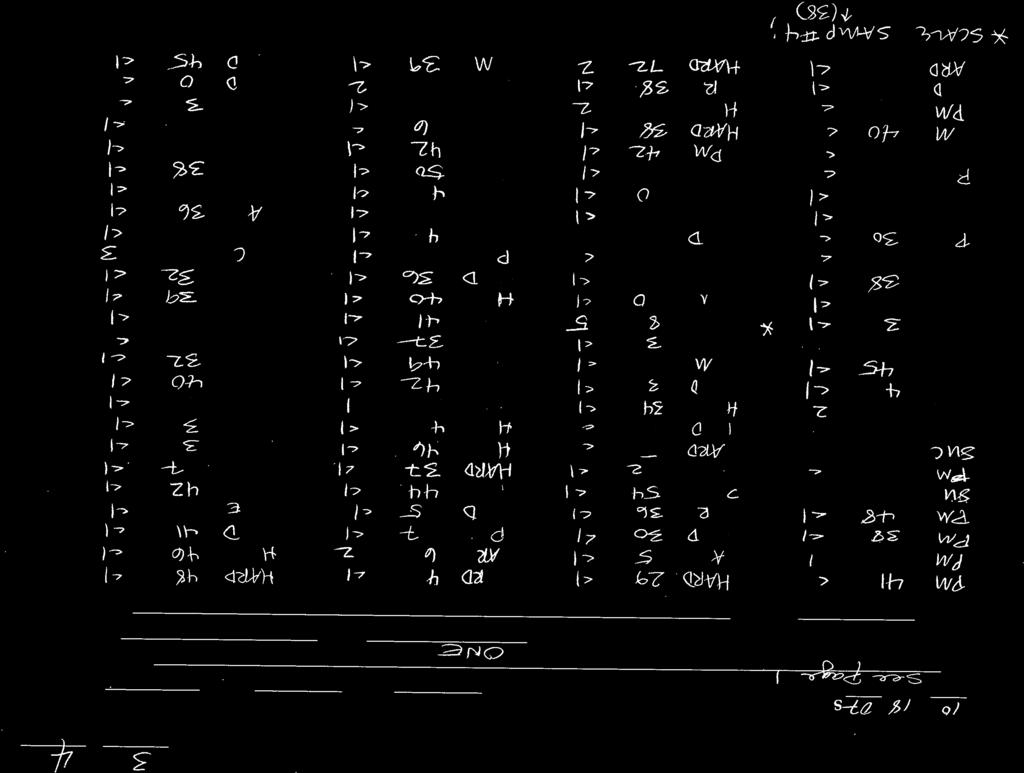
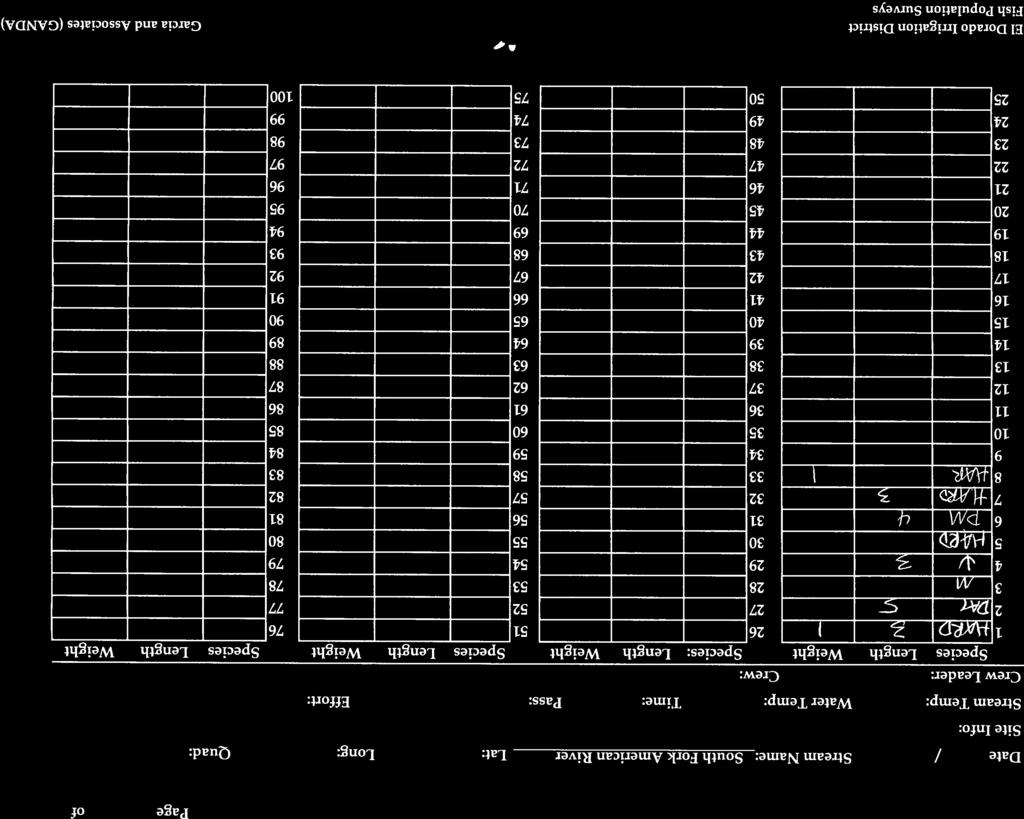
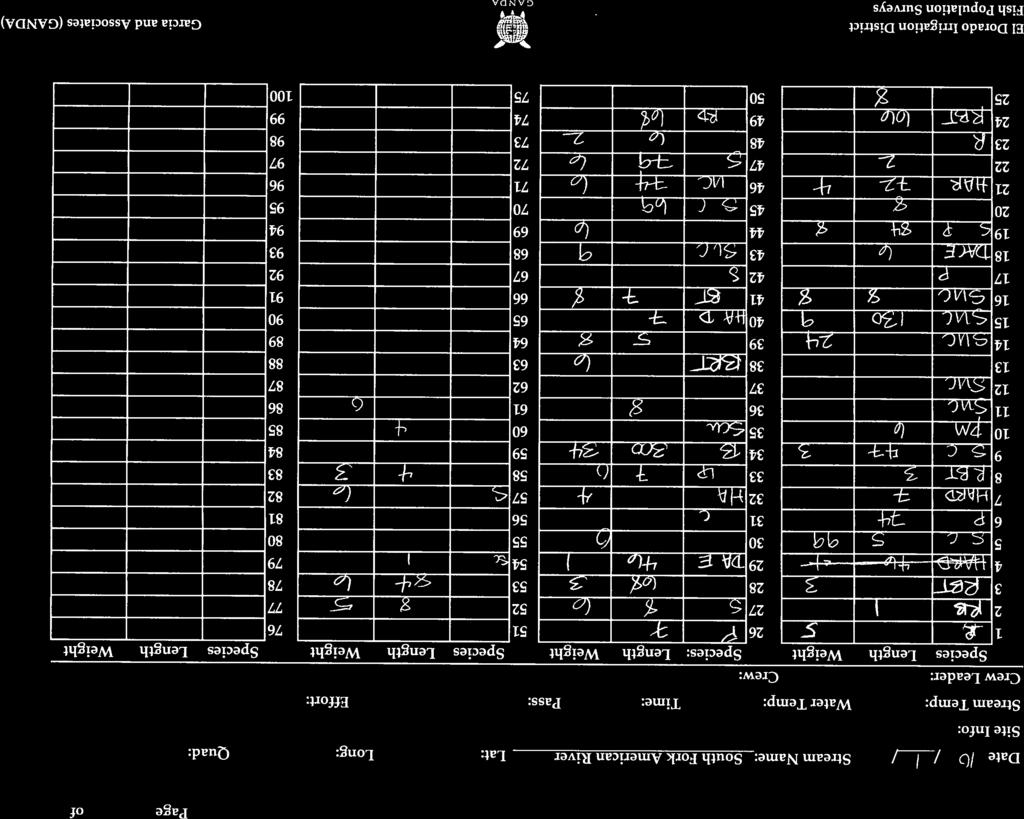
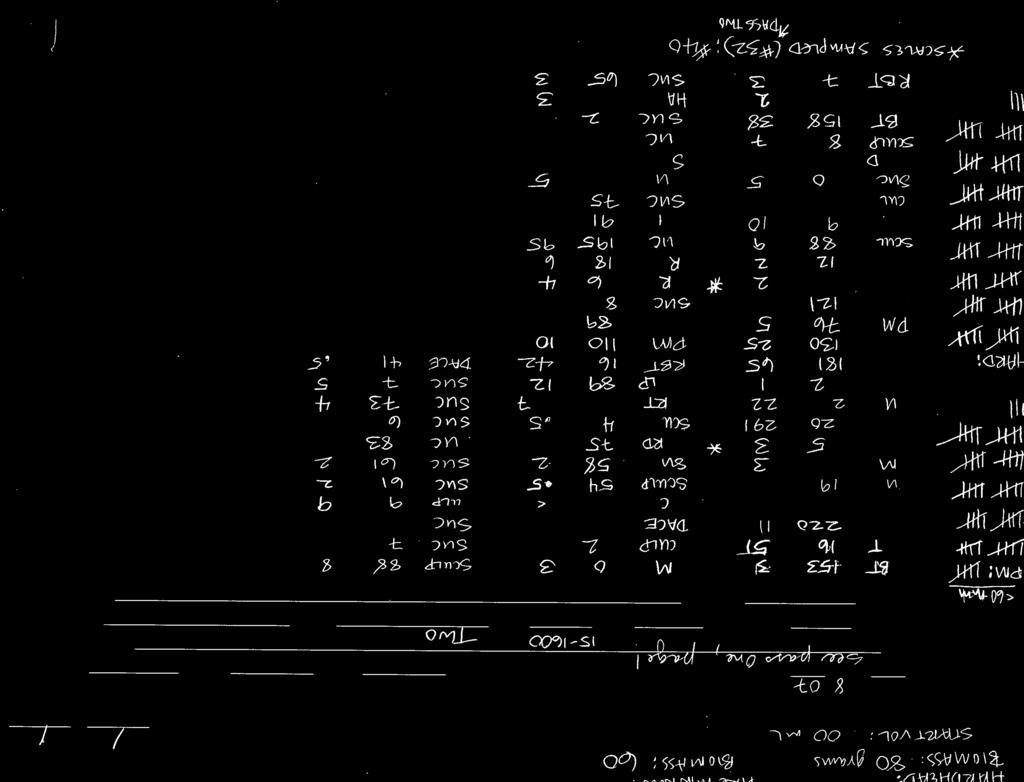
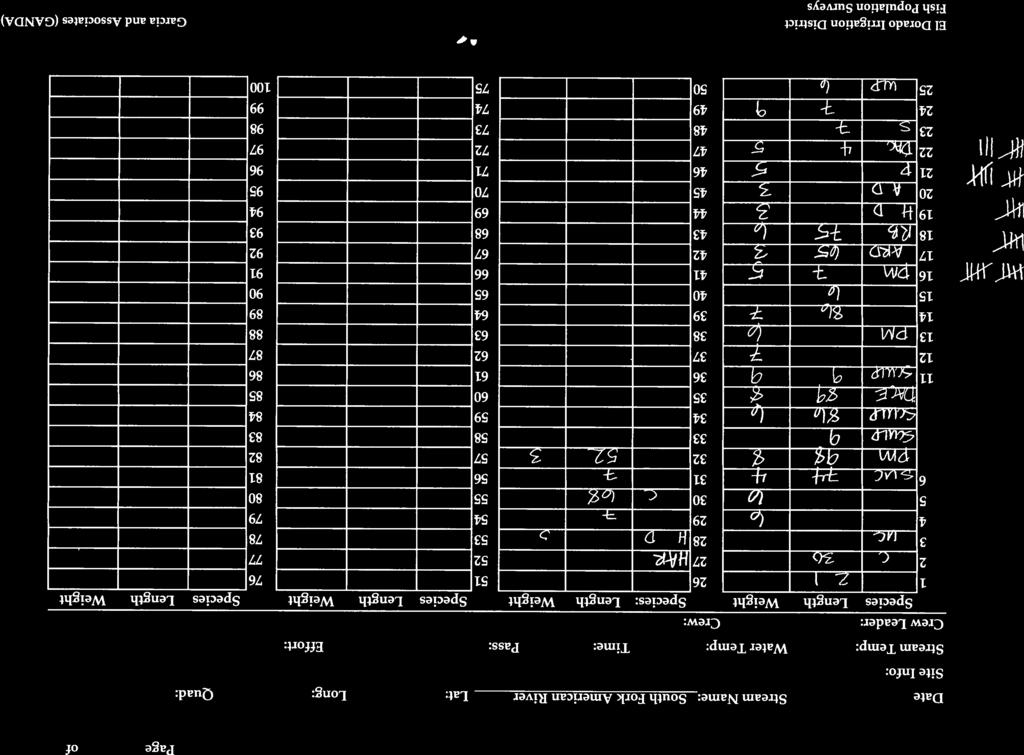
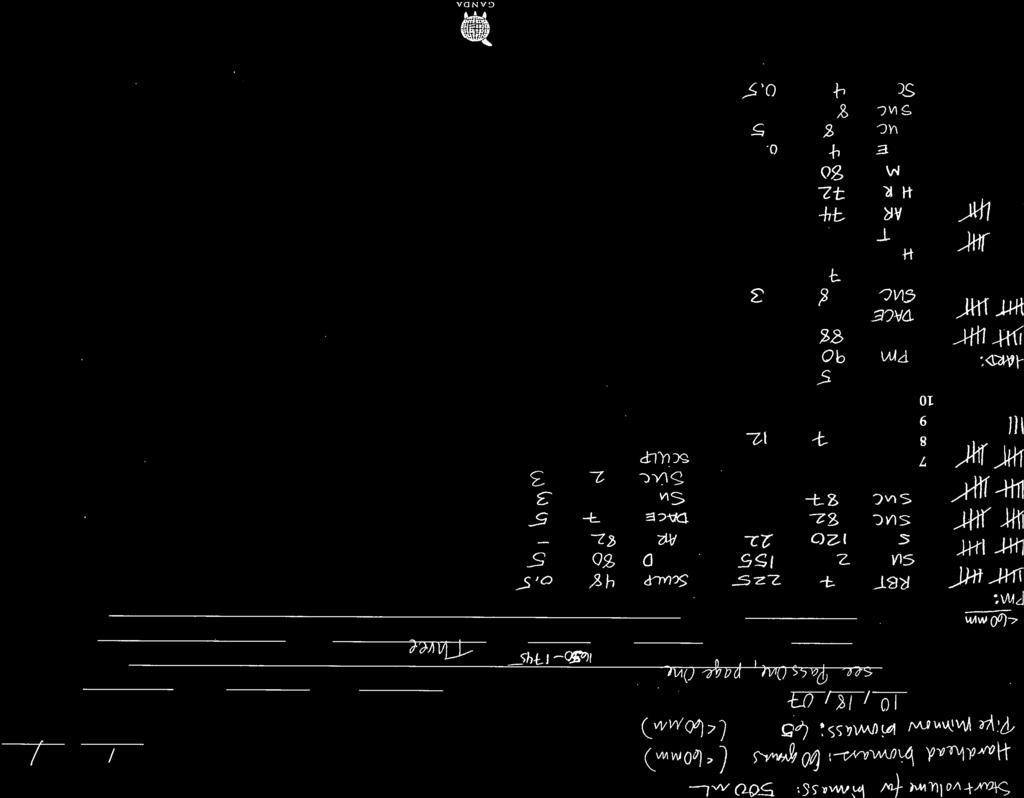
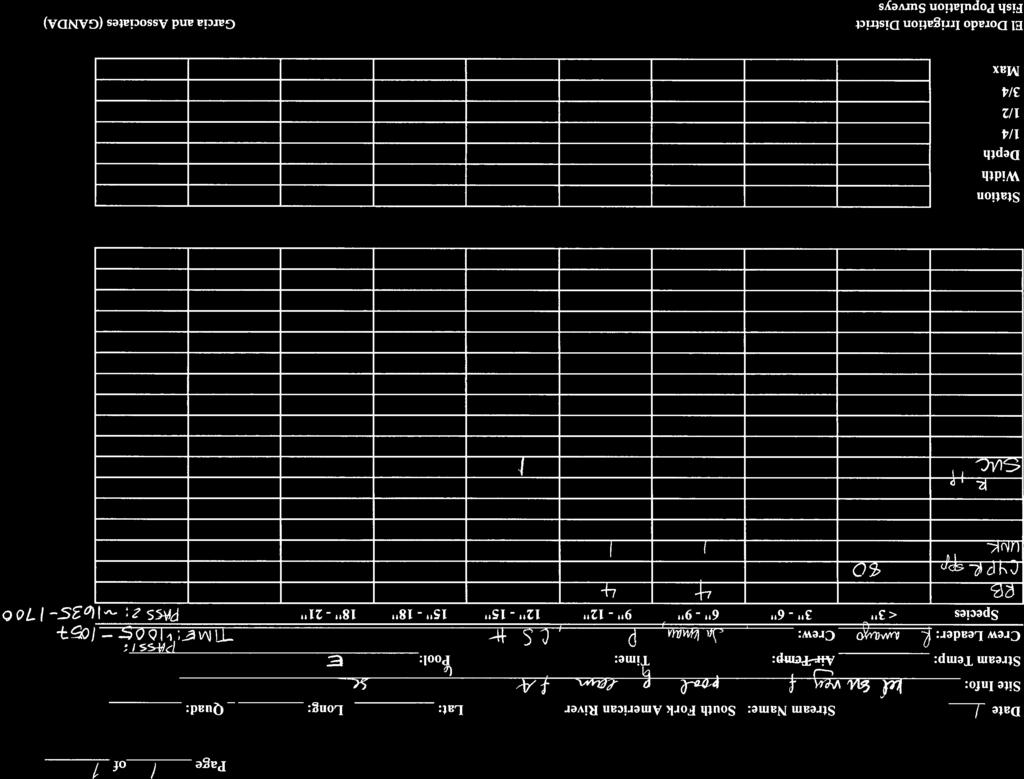
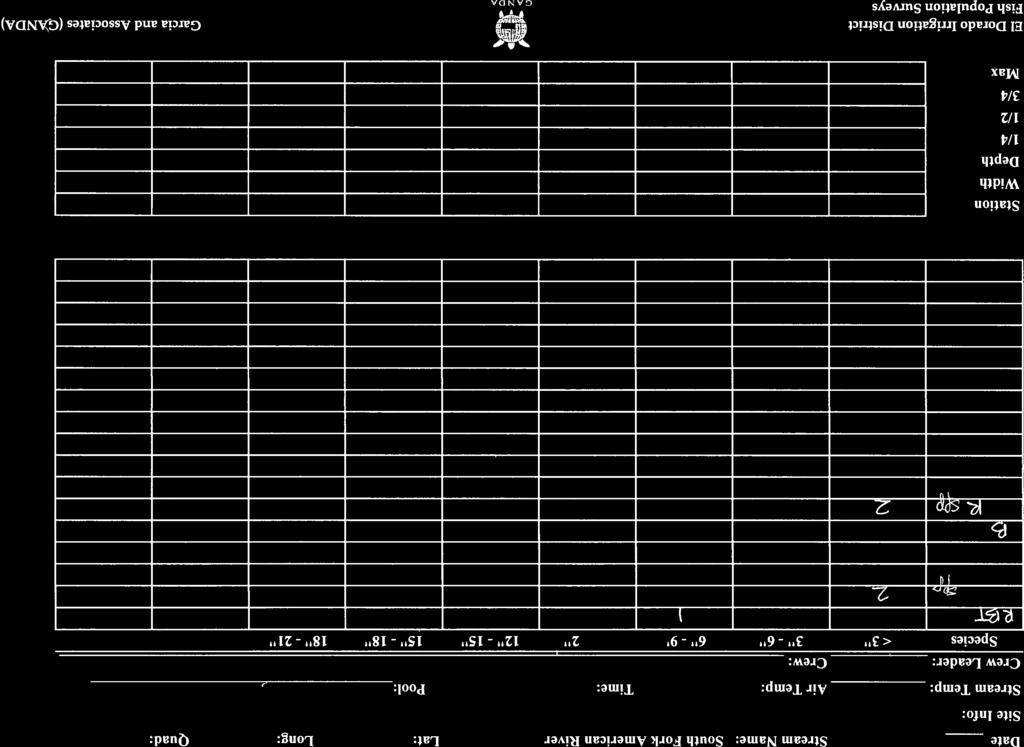
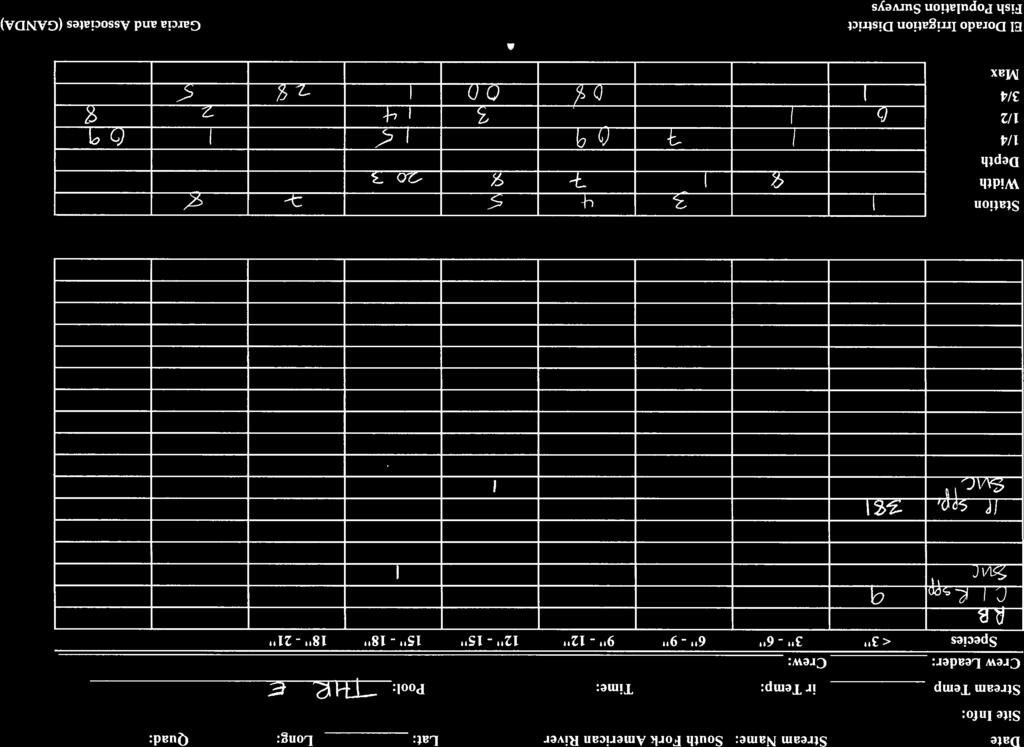
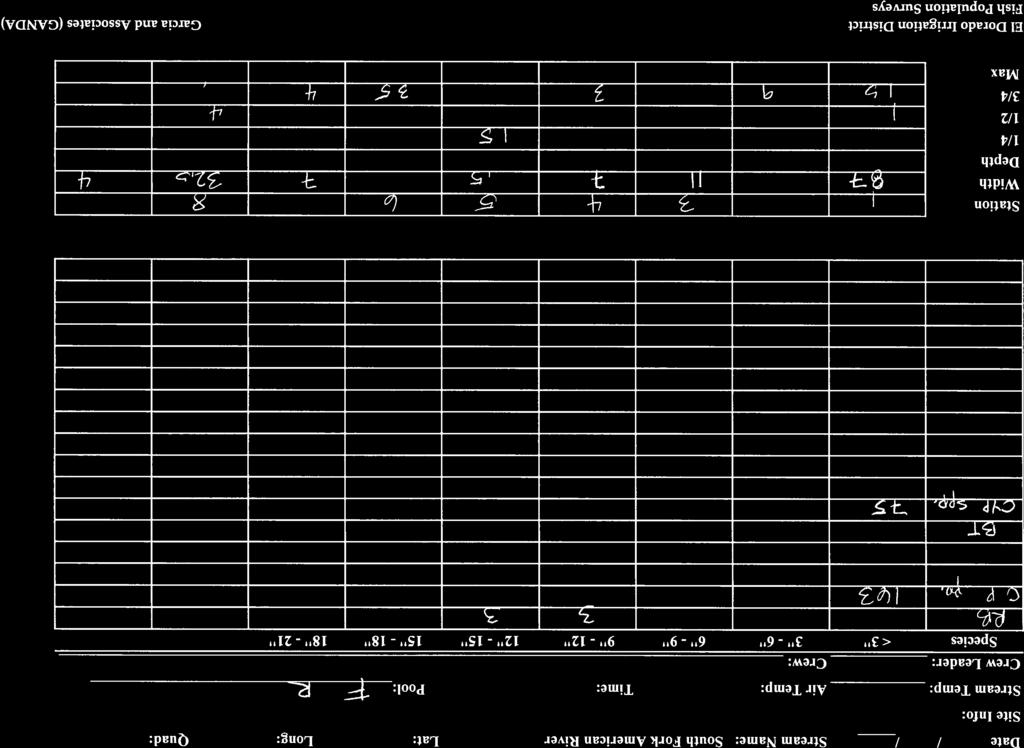
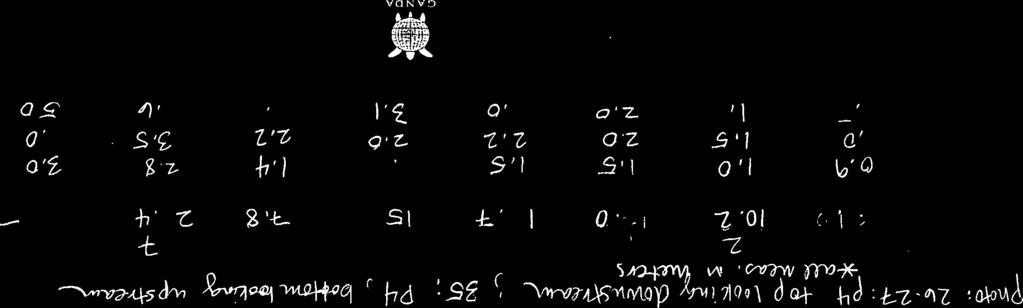
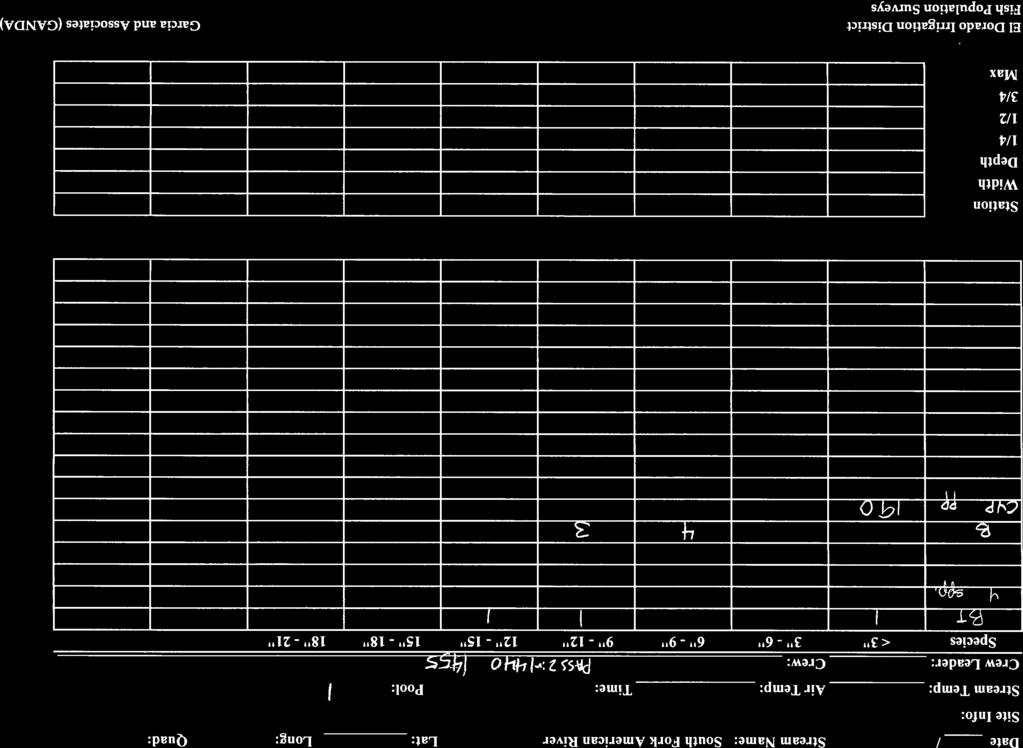
37 Appendix B: Field Datasheets for 2007 Fish Surveys
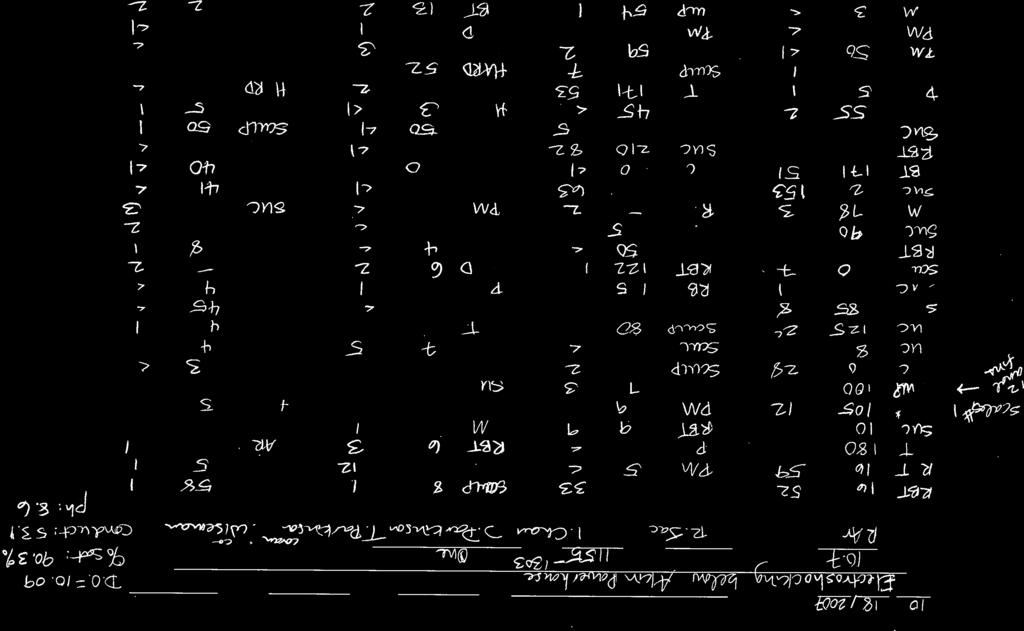
38
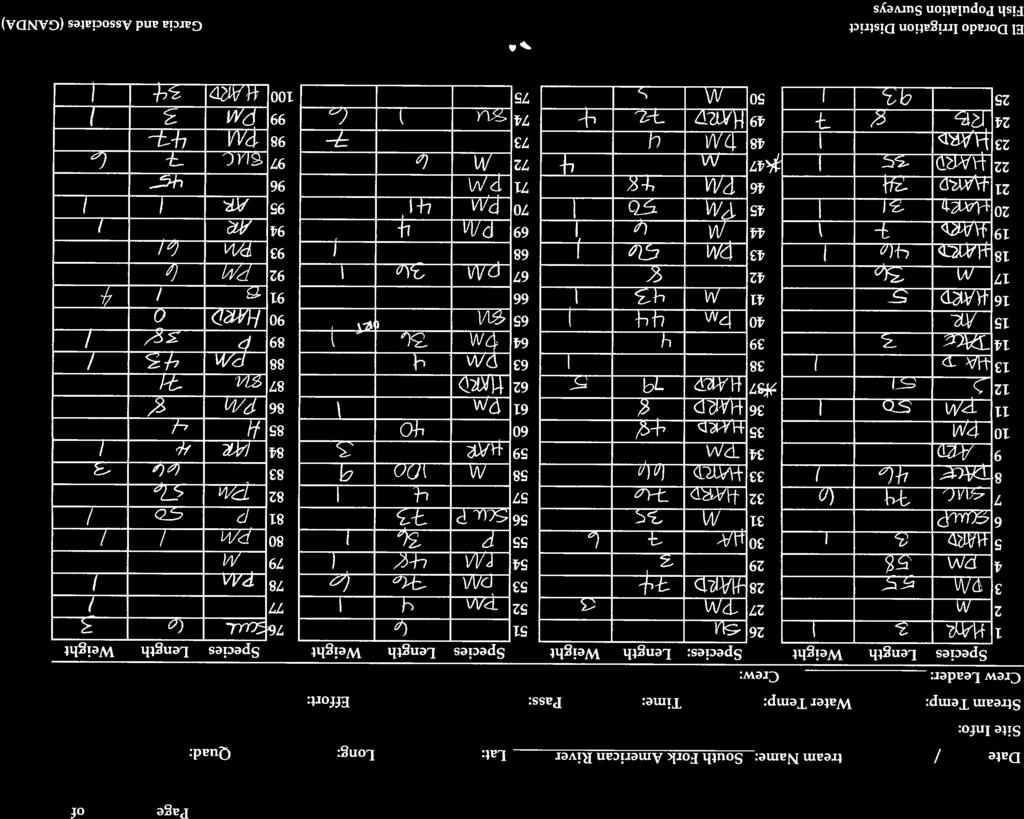
39
40


41
42
43


44


45


46


47

48


49


50
51 Appendix C: Length Frequency Histograms for Electrofishing Data
52 Number of Fish Fork Length (mm) Figure C 1. Length Frequency Distribution for Hardhead Minnow (2007 Electrofishing Data)
53 Number of Fish Fork Length (mm) Figure C 2. Length Frequency Distribution for Sacramento Pikeminnow (2007 Electrofishing Data)
54 Fork Length (mm) Figure C 3. Length Frequency Distribution for Sacramento Sucker (2007 Electrofishing Data) Number of Fish
55 6 5 4 Number of Fish Fork Length (mm) Figure C 4. Length Frequency Distribution for Riffle Sculpin (2007 Electrofishing Data)
56 Fork Length (mm) Figure C 5. Length Frequency Distribution for Rainbow Trout (2007 Electrofishing Data) Number of Fish
57 5 4 Number of Fish Fork Length (mm) Figure C 6. Length Frequency Distribution for Speckled Dace (2007 Electrofishing Data)
58 Fork Length (mm) Figure C 7. Length Frequency Distribution for Brown Trout (2007 Electrofishing Data) Number of Fish