Membrane Technology: From Manufacture to. May Production
|
|
|
- Jonah Bradford
- 5 years ago
- Views:
Transcription

1 Membrane Technology: From Manufacture to May 2018 Production

2 Osmosis Graphic pulled from
3 Water Sources Surface Waters Ground Water Seawater Lakes Reclaimed water Others
4 Constituents found in Water Salts Gases Chemicals Silica Organics/Tannins/Humic Acids Algae, etc Particulate-suspended


5 Common Methods of Pretreatment Coagulation Tank Booster Pump Chlorine Injection Lime Ferric Chloride Cationic Polymer Sulfuric Acid Injection Dual-Media Filter Cartridge Filter UV Light Cartridge Filter Acid Injection Antiscalant Injection SBS Injection RO Pressure Pump RO Membrane 100 gpm 3:2 Array 5
6 Particulate Target Quality for RO Membrane Turbidity < 0.2 NTU SDI < 3 (ideal) Particle Counts <100 per 1ml (2-50 micron) 6
7 Complete Water Analysis Cations Calcium - Ca Magnesium - Mg Sodium - Na Potassium - K Iron - Fe Manganese - Mn Aluminum - Al Barium - Ba Strontium - Sr Anions Alkalinity - HCO3 Sulfate - SO4 Chloride - Cl Fluoride - F Nitrate - NO3 Sulfate - SO4 Phosphate - PO4 Silica - SiO2

8 The Filtration Spectrum
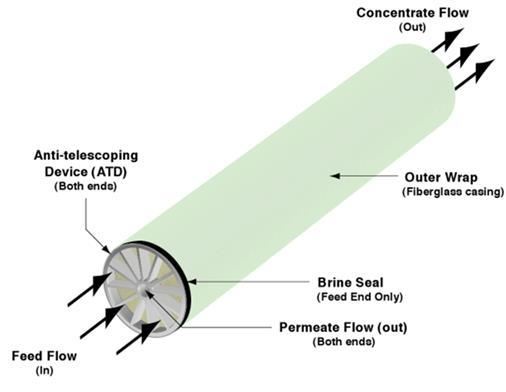
9 Membrane Construction Graphic pulled from

10 Composite Membrane Polyamide membrane layer 0.2 to 5.0 micron thick Polysulphone support layer 50 micron thick Permeate carrier nonwoven polyester 500 micron thick
11 Crossflow Filtration Feed Water Concentrate Permeate

12 Performance -70 MGD; Municipal Wastewater Recycle 12
13 13
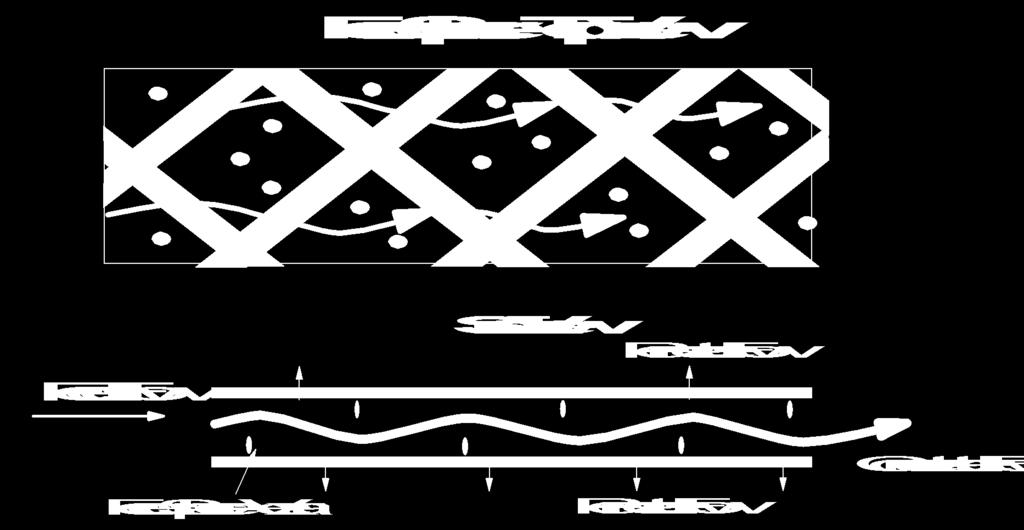
14 Crossflow
15 Terms Salt Rejection: the ability of the membrane to hinder certain elements from passing through. Calculation: % rejection = {1 - (permeate TDS/feed TDS)} 100 Example: {1- (20/1000)} 100 = 98%
16 Expectations d TDS)} 100 Example: {1- (20/1000)} 100 = 98%
17 Terms Percent Recovery The percent of permeate water that is recovered from the feed water Calculation: (Permeate GPM/Feed GPM) (100) = % Recovery Example: (75 GPM/100 GPM) (100) = 75% Recovery
18 Concentration Factor 50% 75% 90% Recovery 2x 4x 10x Concentration Product Water Feed Water 1000 PPM Concentrate Water PPM
19 Terms Concentration Feed Water TDS of 150 % Recovery Concentration Factor Concentrate TDS Concentration Factor = 1/(1-Recovery)
20 Keys to Membrane Operation Pretreatment, pretreatment, pretreatment System Design Properly Clean Membranes Record Keeping
} 100")
21 Expectations d TDS)} 100 Example: {1- (20/1000)} 100 = 98%

22 Expectations
 Can be slow or instantaneous loss of rejection depending on the concentration Dyed membrane surface showing")
23 Damage by Oxidizers Cause Chlorine Peroxide Permanganate ph hydrolysis Symptoms Loss of rejection in the first stage (array) Can be slow or instantaneous loss of rejection depending on the concentration Dyed membrane surface showing chlorine damage
 High permeate flow at lower pressure High permeate conductivity/low")
24 Chlorine Damage Chlorine Damage is irreversible Indications of chlorine damage (after normalized) High permeate flow at lower pressure High permeate conductivity/low rejection 24
25 Chlorine Damage Two ways to verify chlorine on site Wet test method ORP Strips Hach DPD method Establish baseline and then adjust chemicals for baseline +10% 25
26 Causes of Fouling Colloidal Fouling Scale Chemical Fouling Biological Fouling Inadequate Membrane Cleaning Procedures or chemistry selection or both
 and are present in virtually all feedwaters.")
27 Colloidal Fouling Indicators of colloidal fouling would be: High pressure differential on first array. Membrane telescoping. High turbidity in feedwater. Surface water supply. Colloidal and silt particles are termed particulates (e.g. clays, colloidal silica, rust particles and bacteria) and are present in virtually all feedwaters. Product Feed Water Concentrate

28 Causes Colloidal Media filters not working properly Turbid surface waters High suspended solids Inadequate pretreatment

29 Symptoms - Colloidal Fouling High pressure differential on elements Rapid fouling of the first stage
30 Options for Scale Control Acid Injection Antiscalant Injection Ion Exchange Softener Reduce Recovery Rate Sometimes Nothing

31 Scale Formation Scale will often be seen on the downstream end of the last membrane in the system or on the inside of the last pressure vessel. Scale can be abrasive and scratch the membrane surface causing permanent damage. Product Feed Water Concentrate
32 Scale Formation Scaling occurs when soluble minerals become concentrated in the RO and exceed saturation limits. Gather a complete water analysis Evaluate the scaling potential of the feedwater Ensure that the scaling potential is or can be brought under control
33 Most Common Scales Effecting RO Calcium Carbonate - CaCO 3 Calcium Sulfate - CaSO 4 Barium Sulfate - BaSO 4 Iron - Fe +2 Silica - SiO 2 Calcium Phosphate - Ca 3 (PO 4 ) 2????

34 Calcium Carbonate 34

35 Calcium Phosphate 35

36 CaPO4 & CaCO3 36

37 Calcium Carbonate 37


38 Calcium Carbonate Scale Ca CO 3 Ca CO 3 CO 3 Ca CO 3 Ca Ca Ca CO 3 Ca CO 3
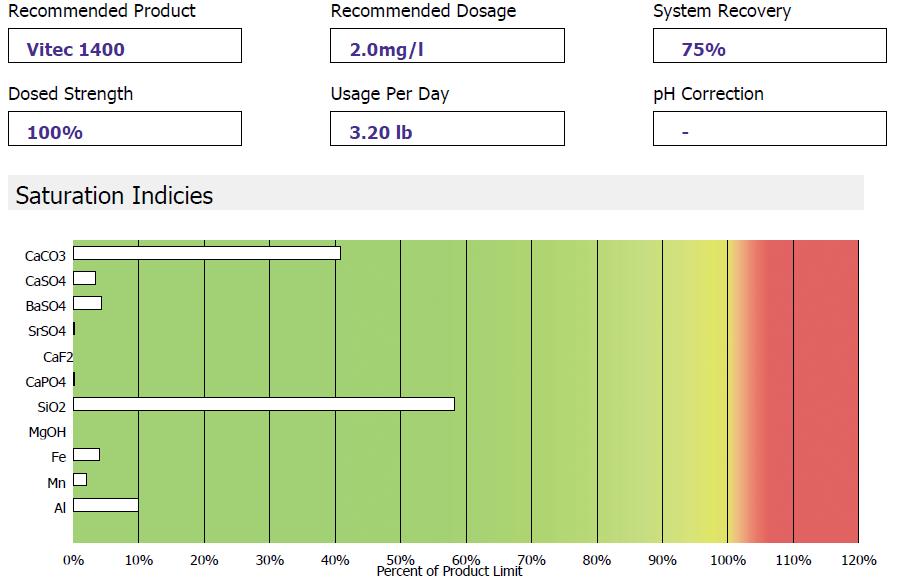
39 Common Scale Control Methods Antiscalant Addition Antiscalants work through threshold inhibition, crystal modification, and dispersion to keep supersaturated minerals from scaling the membranes. Dispersion capability further reduces colloidal fouling tendencies.
40 Mechanisms of Antiscalants Threshold Inhibition The ability of an antiscalant to keep supersaturated solutions of sparingly soluble salts in solution. When crystals begin to form, negative charges on the antiscalant molecule attack the positive charges on the scale, interrupting the growth of the crystal.
41 Antiscalant Notes Typical antiscalant dosages are 1-4 ppm Antiscalants only delay scale formation Because of this, Post Flushing an RO after shutdown is essential Inject antiscalant/dispersant after pretreatment equipment and before cartridge filter housing.

42 Chemical Fouling Incompatible chemistry can cause a sticky foulant and plug front end membranes. When incompatible chemistries are mixed together there will be a measurable increase in turbidity. Product Feed Water Concentrate


43 Biological Fouling Slime in Vessels or Pipe. Noticeable odor. High Pressure Differential in 1 st Array Product Feed Water Concentrate
44 What is Data Normalization? Normalization is a comparison of the actual performance to a given reference performance while the influences of operating parameters are taken into account. The reference performance may be the designed performance or the measured initial performance. Plant performance normalization is strongly recommended, because it allows an early identification of potential problems (e.g. scaling or fouling) when the normalized data are recorded daily. Corrective measures are much more effective when taken early. Note: Reference from Dow Technical Manual
45 Minimum Data Required for Normalization: Pressures (psig) Feed Concentrate Permeate Flows (gpm) Permeate Concentrate Conductivity/TDS Feed Permeate Temperature


46 Technical Support Data Logging 46
47 Is the RO Fouling? What happens to Normalized flow when the pressure goes up and the temperature goes down?
48 What does the data tell me? What happens to Normalized flow when the pressure goes up and the temperature goes down?
49 Is the RO Fouling? What happens to normalized flow when the temperature goes up and the pressure stays the same?
50 What does it tell me? What happens to normalized flow when the temperature goes up and the pressure stays the same?
51 Clean in Time
52 Clean When Needed
53 Membrane Cleaning 36 gallons 36 gallons Cleaning Tank 200 gall min. 36 gallons 36 gallons 36 gallons 36 gallons 144 gallons First Array 72 gallons Second Array 5u Cartridge Filter Concentrate Concentrate
54 Vessel Flow Rate Clean Each vessel at the proper flow rate no matter how many membrane elements are in the vessel 1 4 Product 2 5 Feed Water 3 Concentrate Cleaning Flow - 40 gpm x 3 = 120 gpm Cleaning Flow - 40 gpm x 2 = 80 gpm


55 Membrane Cleaning A good membrane clean involves selecting the proper chemistry and using the proper mechanical approach.
56 Saving Membranes Normalized Permeate Flow Rate Proper Cleaning Maintenance Cleaning after a 10-15% decline maximizes RO performance Normalized Permeate Flow Rate Cleaning after 10-15% decline Time Improper Cleaning Maintenance Waiting too long to clean reduces RO performance Cleaning after > 15% decline Time
57 O&M Costs 57


58 Why are we here?

59