Whole Lake Experiments to Control Harmful Algal Blooms in Multi-Use Watersheds Presentation to the Middle Huron Partners 8 November 2006
|
|
|
- Elijah McCormick
- 5 years ago
- Views:
Transcription
1 Whole Lake Experiments to Control Harmful Algal Blooms in Multi-Use Watersheds Presentation to the Middle Huron Partners 8 November 2006 U.S. EPA STAR Grant R Develop management plan to control nuisance algal blooms Compartmentalize river; identify key regions Develop plans that look beyond P control alone Investigate N:P ratios Investigate internal nutrient loading Identify limiting factors for non-nuisance algae

2 Study Site


3 Courtesy: G.J. Cope, Nformation Design 2006 Ford Lake Dam 28 C lots of oxygen 26 C no oxygen $ Hydro power Potential dead fish
4 Entering the Study Site
5 Interannual Variation in Diatom Bloom Dynamics: roles of hydrology, nutrient limitation, sinking, and whole lake manipulation Julie Ferris

")


6 Why don t diatoms normally persist past May? SRSi Dynamics SRSi (soluble reactive silica) is essential for diatom growth, but not for most other species of algae During a diatom bloom, SRSi levels in the lake decline
7 2004 was a good spring for diatoms; 2005 and 2006 were not so good.

8 Two Types Experiments Bioassay (P, Si, and P+Si additions) Growth (no additions made) Response measured by changes in nutrient and chlorophyll concentrations between start and end of experiments
9 2005 Experiments 9 Bioassay experiments (Feb to May) 7 for Ford Lake 4 for Barton Pond 13 Growth experiments (May to Aug) for Ford Lake Results Bioassays P addition positive growth in all cases Si addition positive growth only once!!! Lake SRSi remained high in 2005
10 Results Growth Experiments Increase in Particulate (Diatom) Si in 12 out of 13 Experiments Conclusion- diatoms can grow in Ford Lake water during the summer Lake Flushing Could the lake flushing rate account for the differences in the diatom populations among years?
11 Mathematical Model Test idea that flushing rate controlled differences in diatom populations among years. Model includes: Diatom growth rate Si uptake rate Outflow NO sinking, grazing, or parasitism
12 Mathematical Model Model works well from April to early May- then loss rates accelerate. Grazing? Yes in experiments, but conditions may not be optimal Parasitism? Yes in experiments Sinking? Not in experiments
13 Hypothesis Diatoms will grow in the summer if: Outflow is low enough Sinking is minimized (deeper lake mixing) Hypotheses for Whole Lake Experiments 1. Ford Lake will not export P if deep water remains oxic. 2. Ford Lake will grow diatoms during summer if deep mixing can be achieved. 3. If diatoms consume lake nutrients (N and P), bluegreens will have less resource and will be less successful.


14 December Ypsilanti Charter Township Board of Trustees votes unanimously to endorse, and to confirm cooperation in proposed whole lake experiments. We decided to try in 2006 And intend to try in 2007
15 Experimental Plan for Summer 2006 Selective withdrawal of water from base of Ford Lake Dam Q: How much flow is required to prevent anoxia? Q: Can removal of cooler water destabilize the lake? Experiment : Calibration Numerical model suggested that 300,000 cubic meters per day could reverse anoxia. Plan: release 300,000 m 3 /d (123 CFS) from 22 to 30 June 2006.
16 Experiment : Calibration Test whether a lower rate of discharge can produce beneficial effects with less loss of hydroelectric capacity. Plan: release half as much water as in X (ca. 65 CFS) from 14 to 21 July 2006.
17 Experiment : Calibration Try to repeat X Plan: release 300,000 m 3 /d from 28 July to 4 August With shorter day lengths, nighttime mixing may be possible.
18 Results Cold, deoxygenated water was removed from the lake bottom. This resulted in: Destratification Deeper lake mixing Summer diatom bloom
19

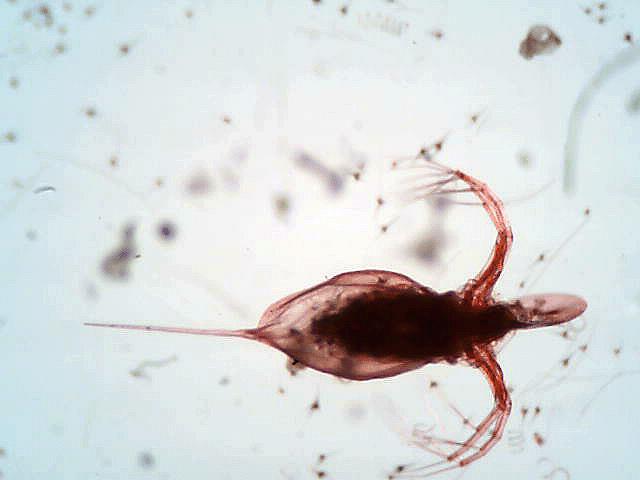
20 Aulacoseira
21 Microcystin Levels in Ford Lake August to September Year N samples Range, nm Median, nm # Dates >1nM
22
23
24 What about Belleville Lake? Did we just export the problem downstream? ug/l Chl or PC Belleville Lake at dam Chl a PC Jun-03 Oct-03 Jan-04 Jun-04 Oct-04 Jan-05 Jun-05 Oct-05 Jan-06 Jun-06 Oct-06
25 How much water does it take to do the job? - About 130 cubic feet per second. How much is that? Huron River Flow: Last 22 Years
26 Table 1. Elemental composition of Ford Lake sediments reported as mean and range of concentration from three sites and depths from 0 to 8 cm below mud-water interface (n= 35 samples). Values are given as mg of element per kg of dry sediment, or ppm. Element MW Mean Min Max Ca Si Al Fe Mg K Ti Na P Mn Ba Zn Sr Cr Zr V
27 Table 1. Elemental composition of Ford Lake sediments reported as mean and range of concentration from three sites and depths from 0 to 8 cm below mud-water interface (n= 35 samples). Values are given as mg of element per kg of dry sediment, or ppm. Element MW Mean Min Max V Rb Pb Cu Ce Ni La