Optimizing Bermudagrass Athletic Field Winter Survival in the Transition Zone
|
|
|
- Ophelia Owen
- 5 years ago
- Views:
Transcription

1 Optimizing Bermudagrass Athletic Field Winter Survival in the Transition Zone Marcus Dean, CSFM-Athletic Field Gregg Munshaw, PhD-Turf Extension University of Kentucky
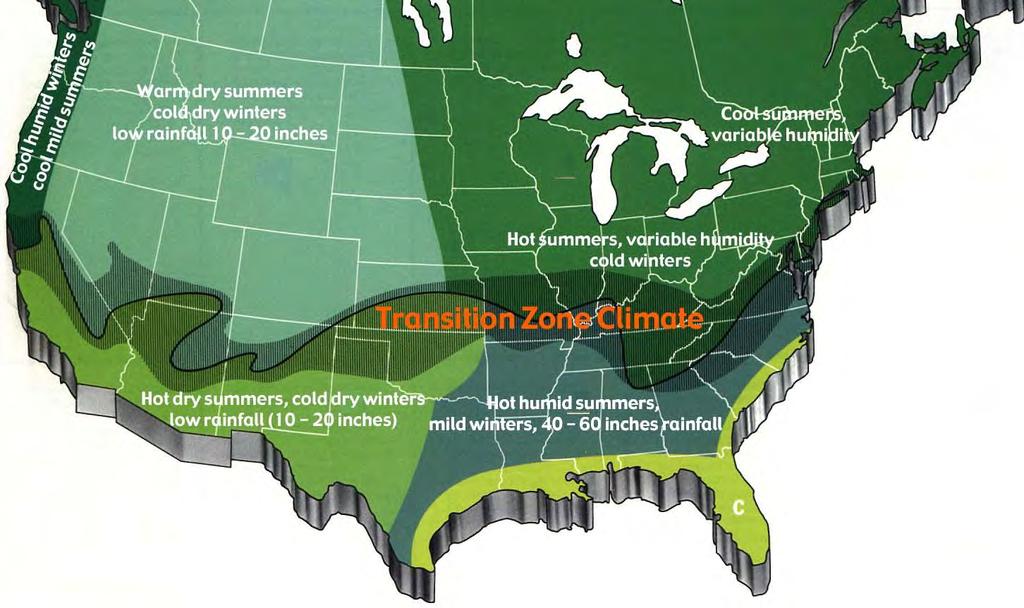
2 THE TRANSITION ZONE
3 Warm Season Turfgrass Zones (Based on low temperature exposure) NEW ZONE? SECONDARY ZONE PRIMARY ZONE

4
5

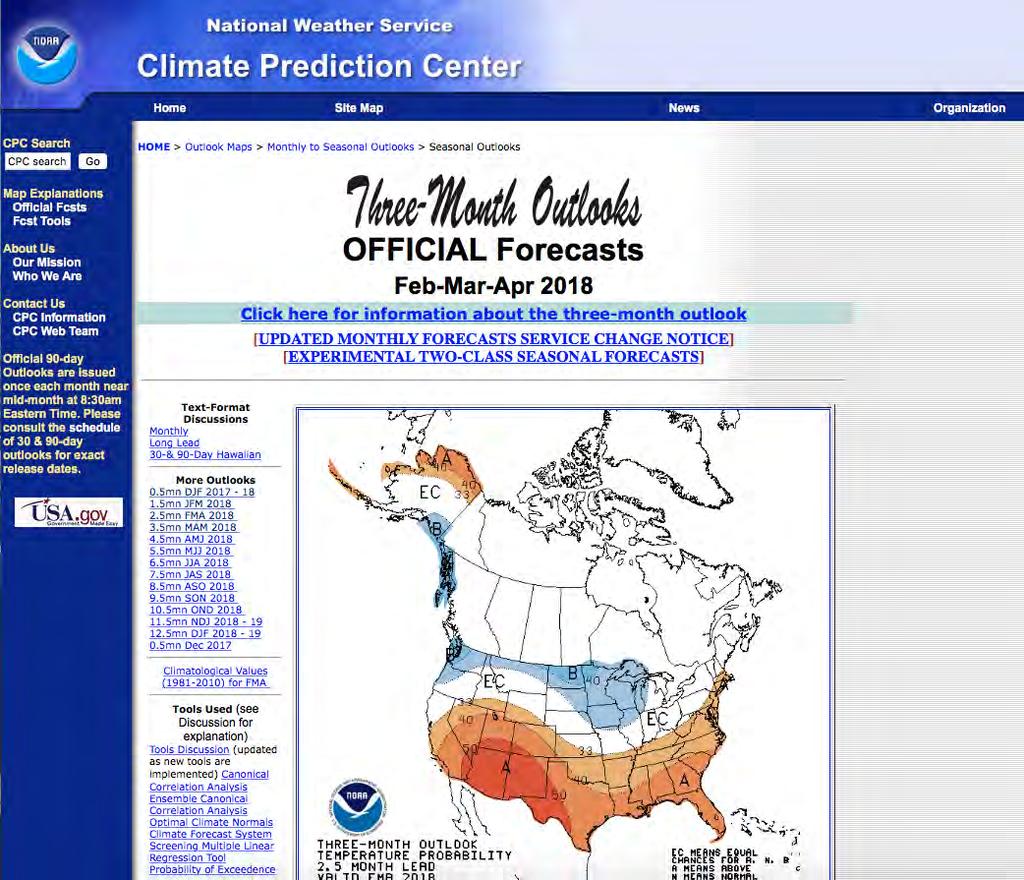
6 The EPA predicts Average summer temperatures will increase by 3 o F over the next few decades and could increase by over 10 o F by the end of the century.


7 The old USDA hardiness map


8 The new USDA hardiness map

9 Winter Comes to the Transition Zone but How Long/Severe varies each year
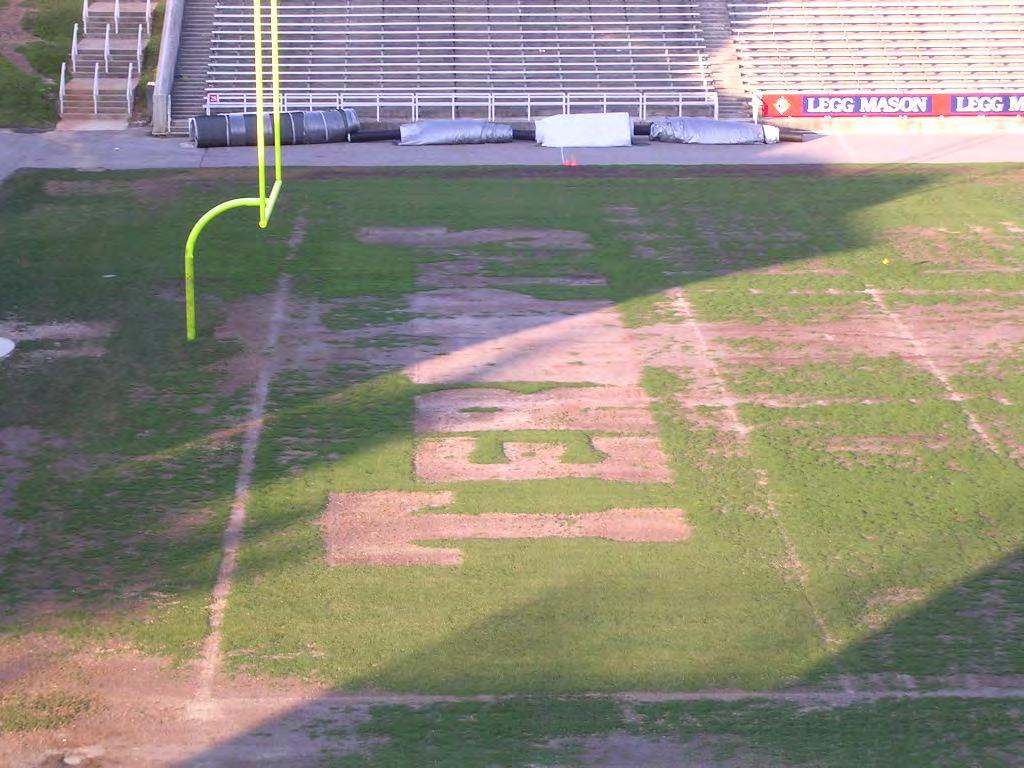
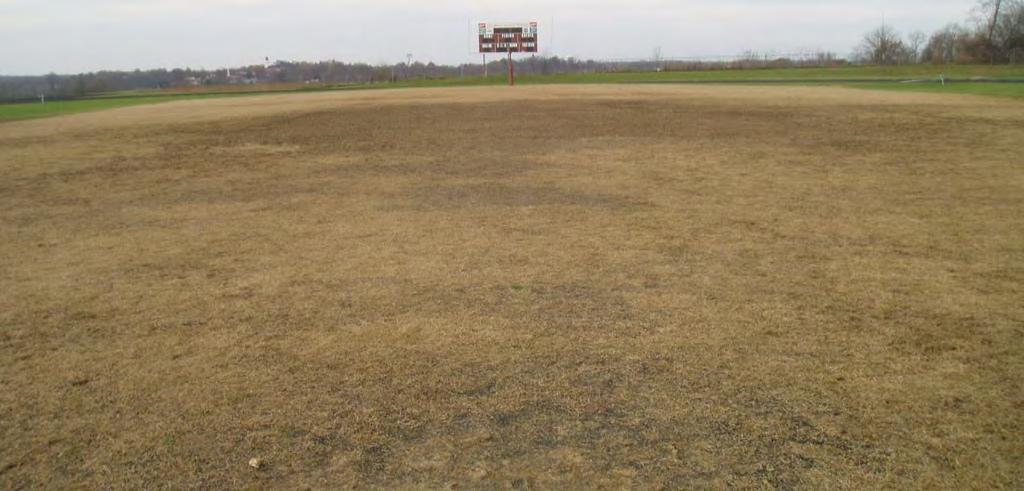
10 Winterkill!!!

11
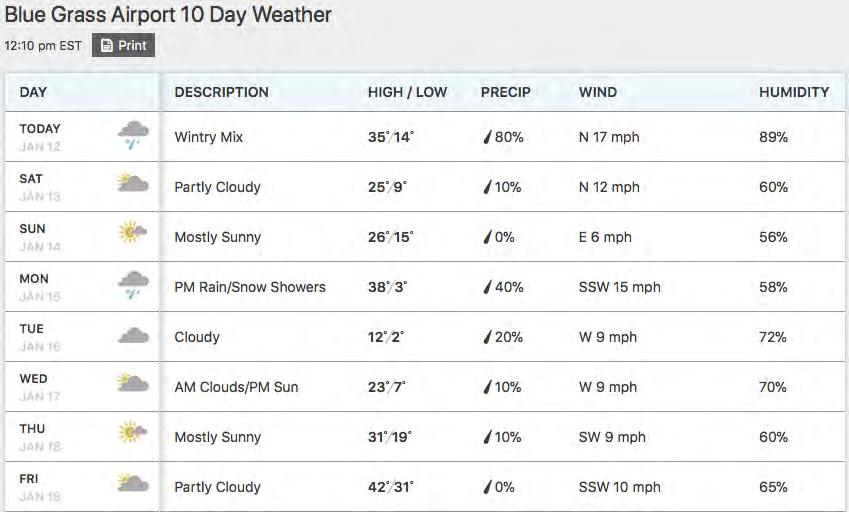
12 Air Temperatures Lexington, KY Winter Date Low Temperature (F) Dec Dec Dec Dec Dec Jan. 1 3 Jan. 2-2 Jan. 3 4 Jan. 4 8 Jan. 5 7 Jan. 6 1 Highest daytime temperature during this period = 30 o F

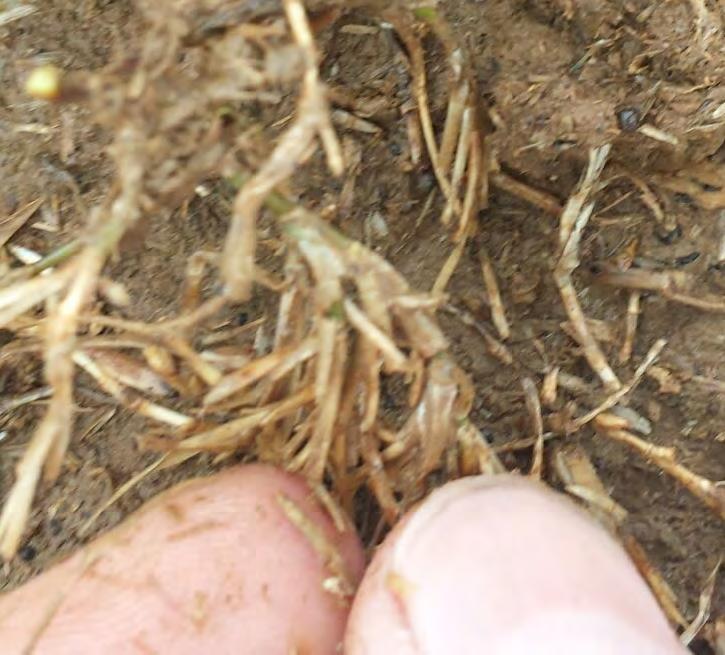
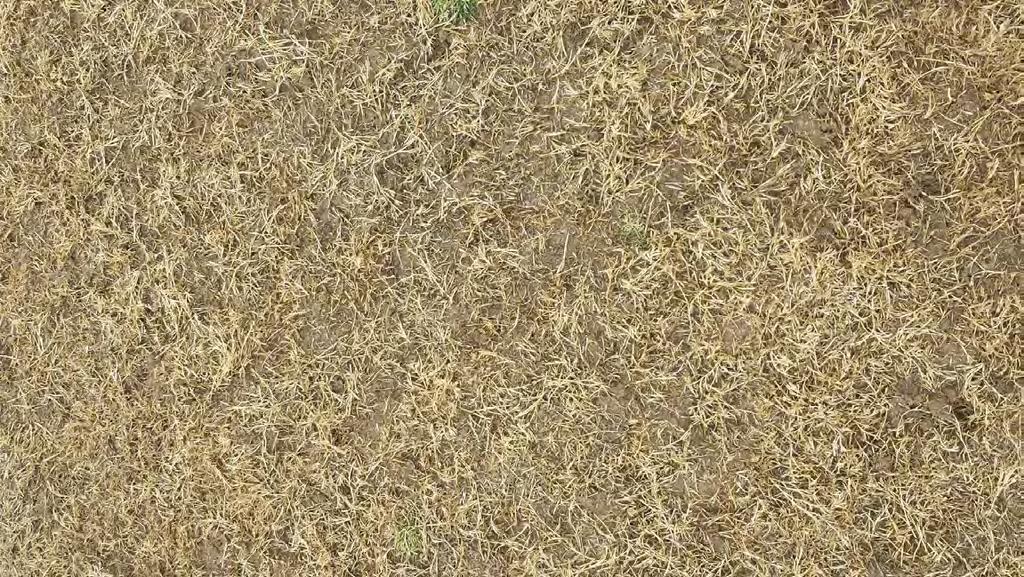
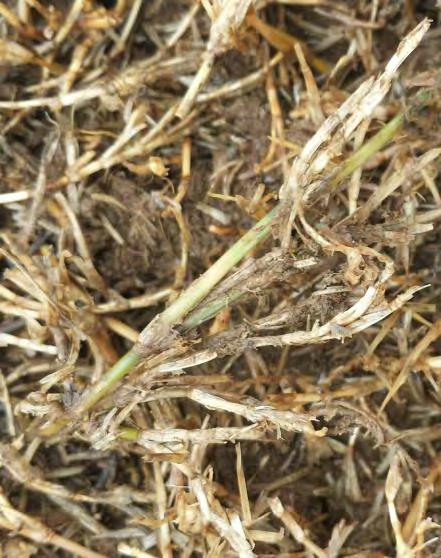
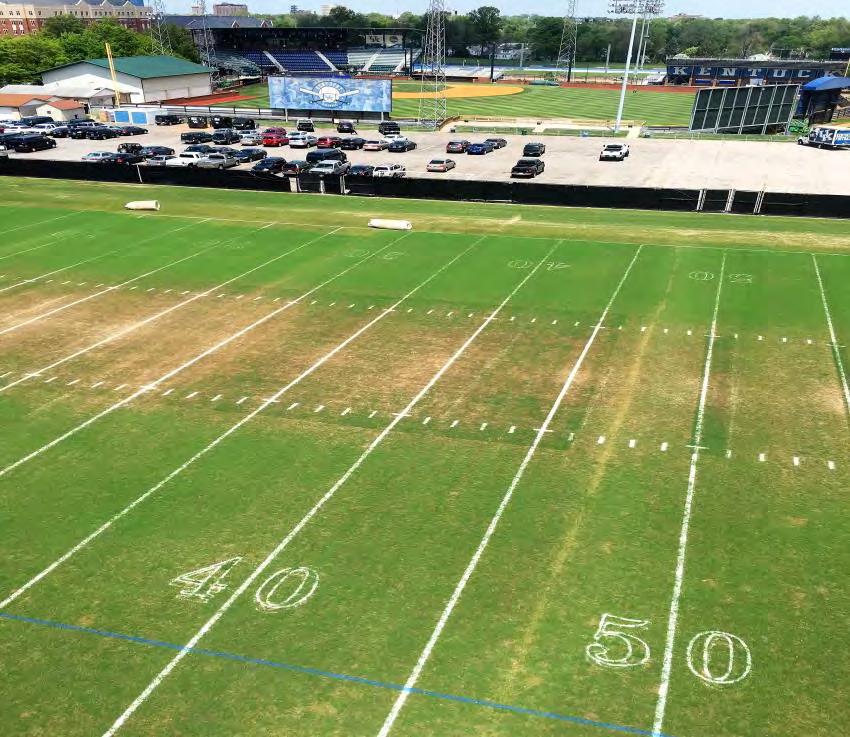
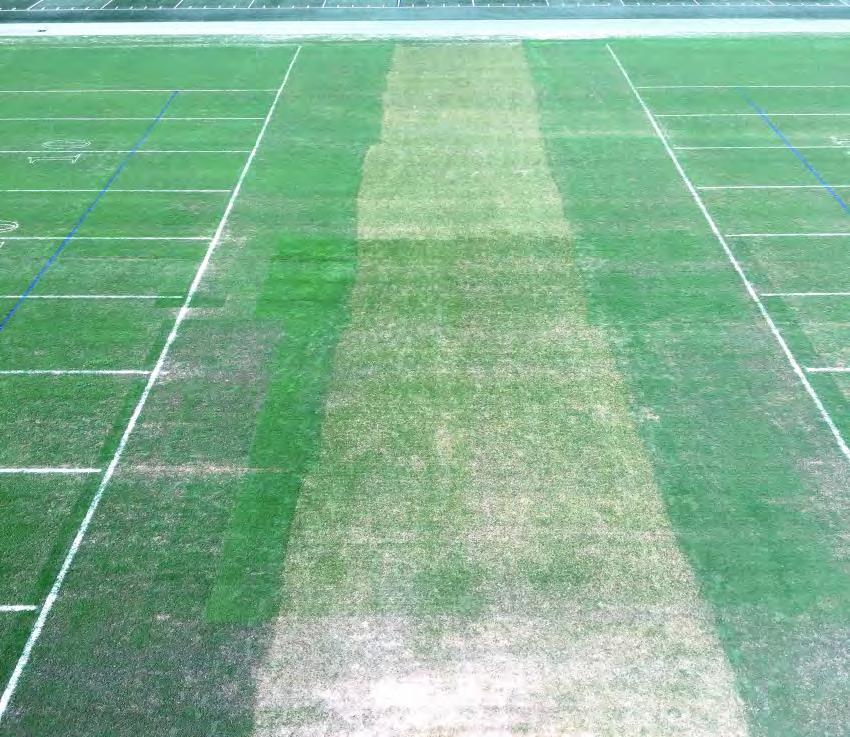
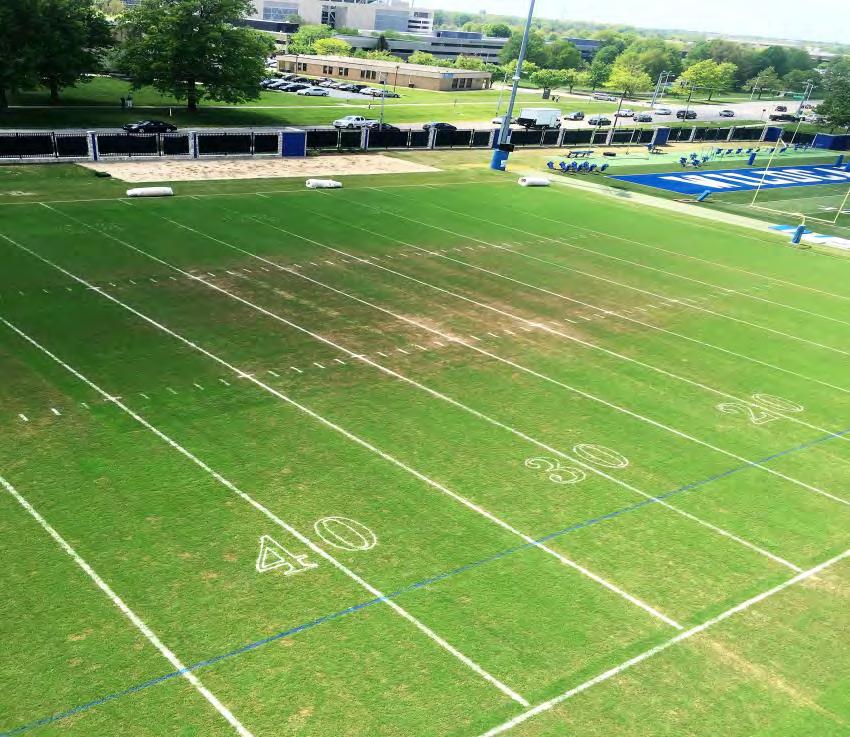
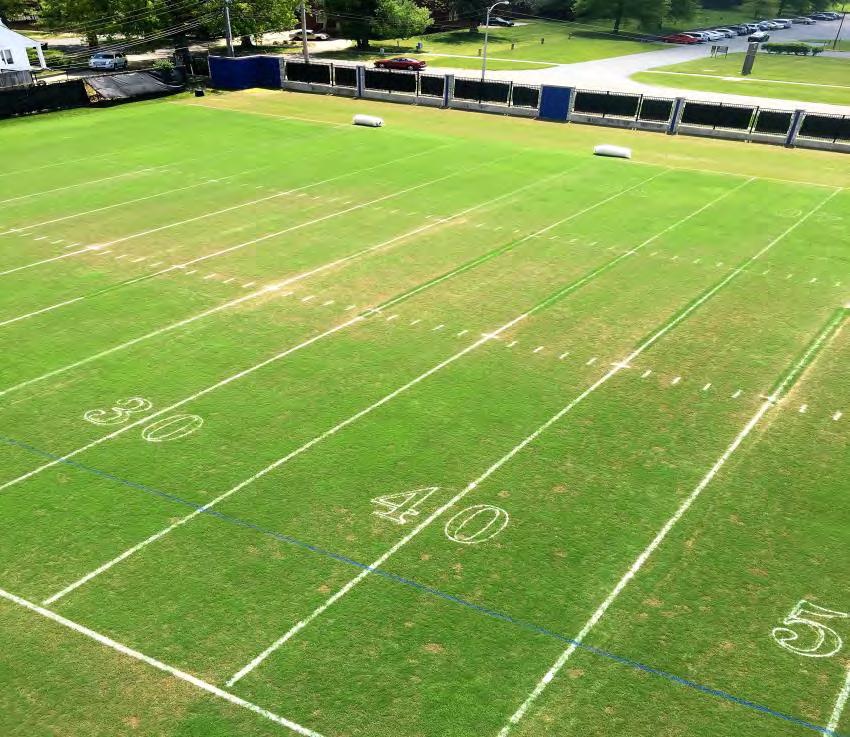
13 Photos taken Jan. 12, 2018
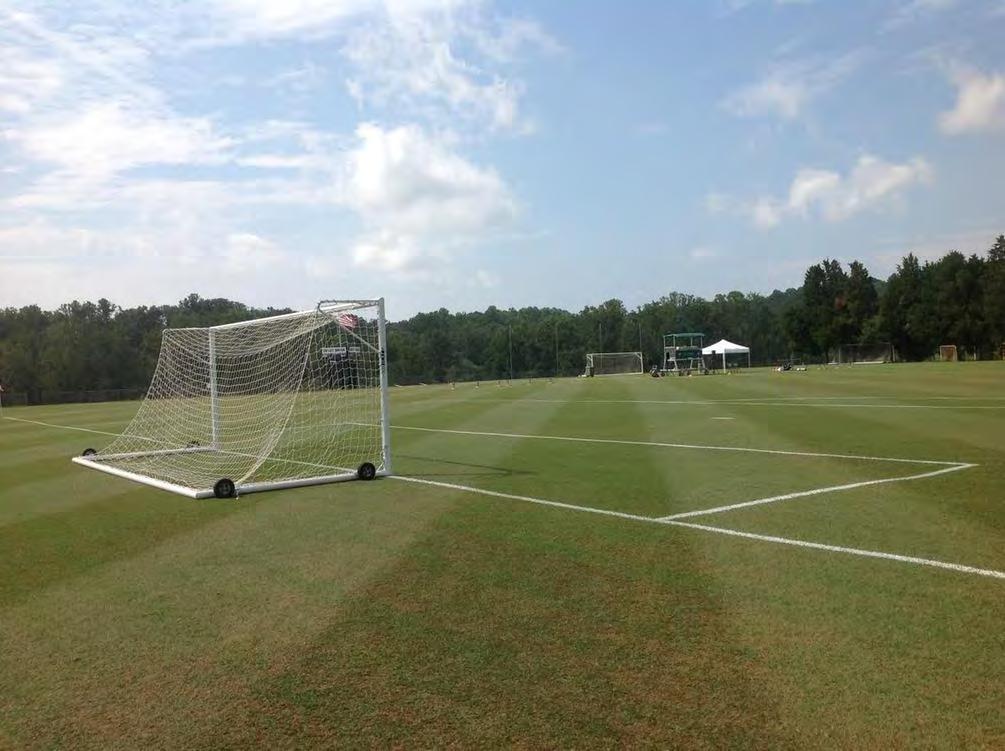
14
 Extended ice cover Winter traffic Heavy thatch Plant health U of L Men s")
15 Causes of Winterkill Direct low temperature kill (varies with cultivar) o Duration of cold also a factor Heavy shade Poor drainage North facing slopes High spots (desiccation) Extended ice cover Winter traffic Heavy thatch Plant health U of L Men s Soccer

16 New Extension Publication from UK, PU, VT, and UM
17 Mowing During active growth (summer), inches Early fall, inches o Increased CHO production and storage o Insulation o More leaf tissue may resist wear=longer seasonal durability Slight increases should not affect playability/ball roll

18 Overseeding
 Overseeded bermuda often has density issues in spring Bermuda needs 60-100 days with no competition to replenish CHOs (Askew,")
19 Overseeding (What we know or think we know) PR is species of choice for athletic fields Suggested planting rates range from lbs/ac (Goatley, 2008; McCarty, 2016) Overseeded bermuda often has density issues in spring Bermuda needs days with no competition to replenish CHOs (Askew, 2010)

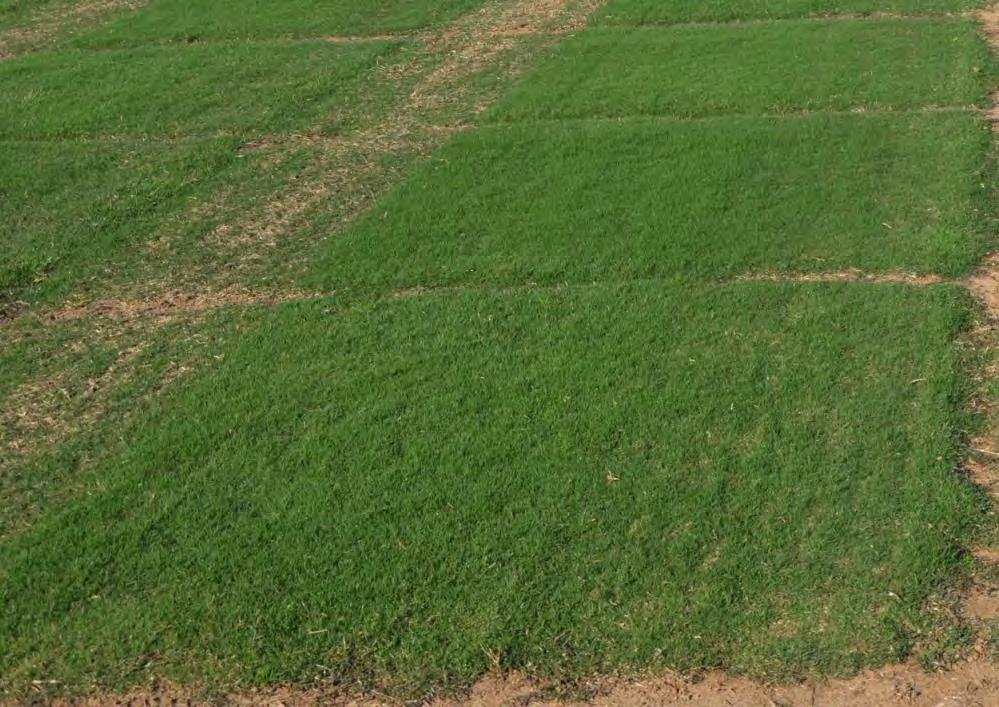
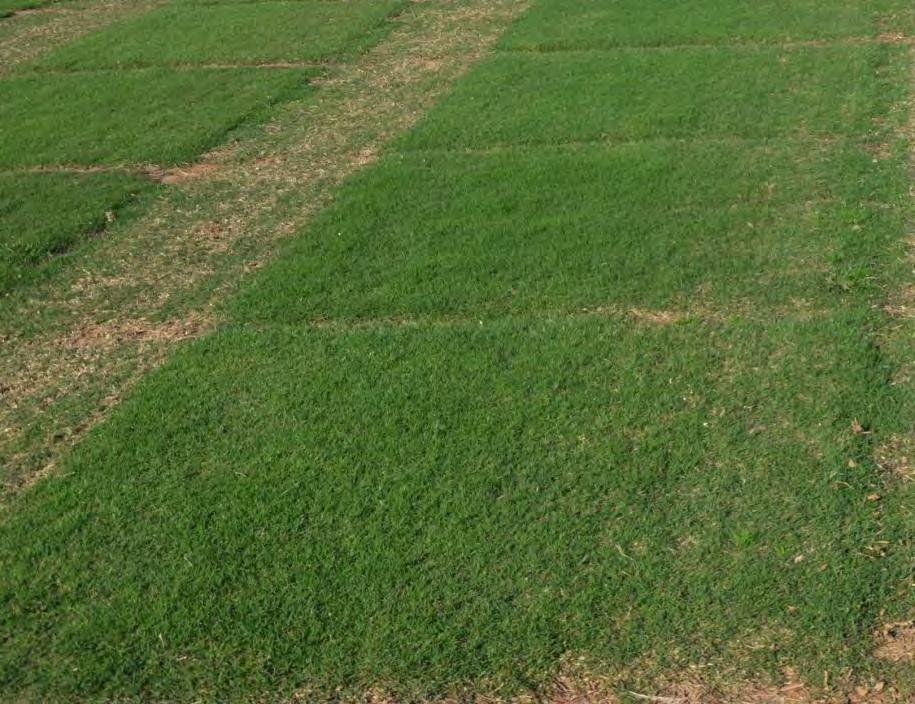
20 Overseeding Research Planted Futura 2000 at 0, 655, and 1310 lbs/ac Measured canopy temperatures through winter Measured CHO status through winter Monitored bermuda cover in spring


21 Overseeding Research Improved visual appearance in fall/winter Reduced spring density CHO reductions through winter no effect from PR Only a slight temperature increase (+1.1 o F)
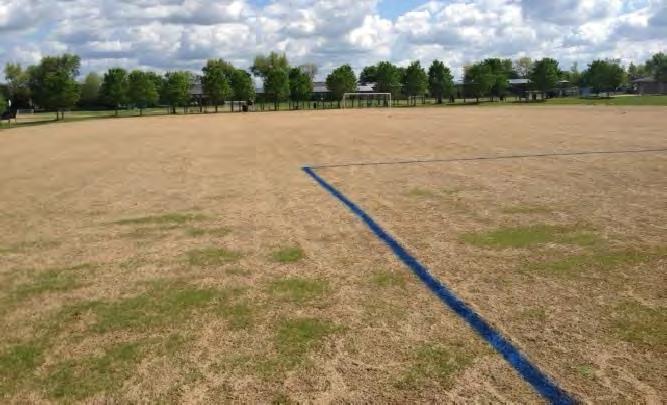
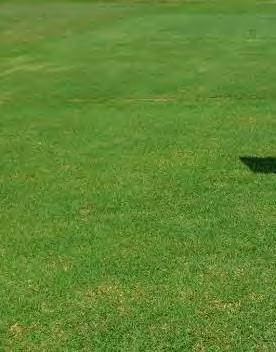
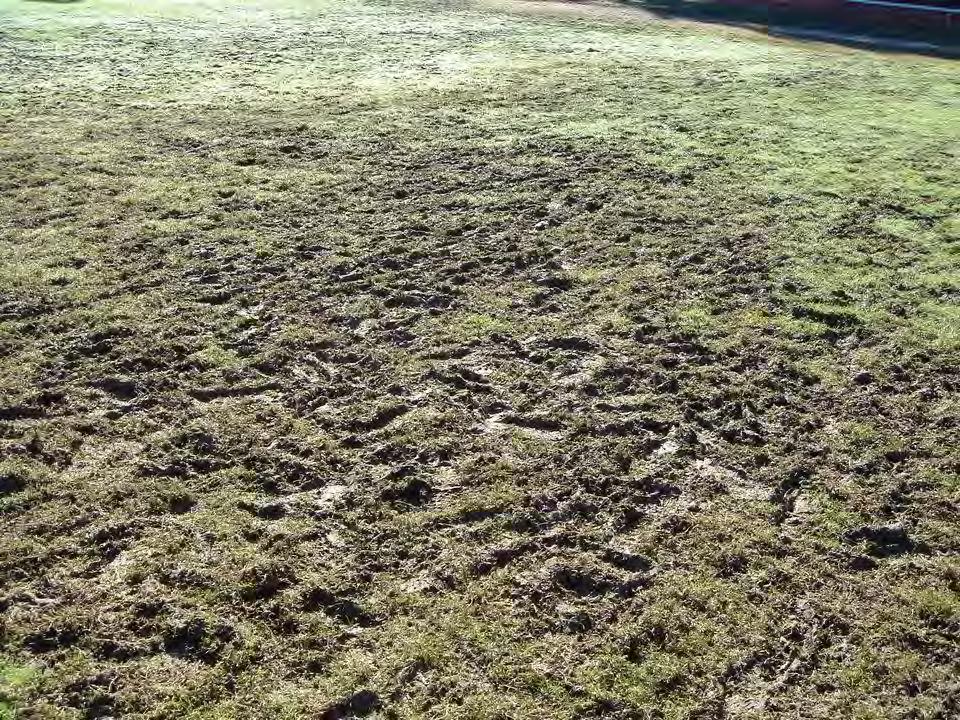
22 Traffic Management Dormant bermuda unable to recover following wear--results in thin turf if excessive traffic

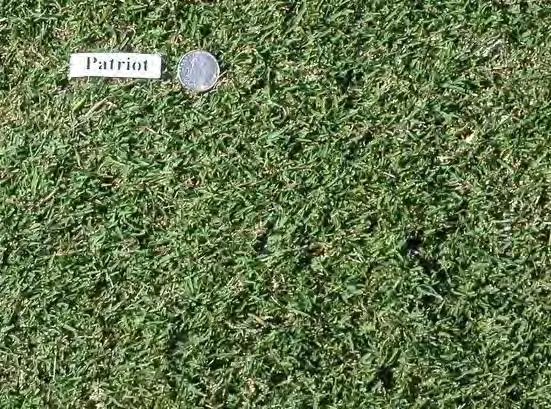
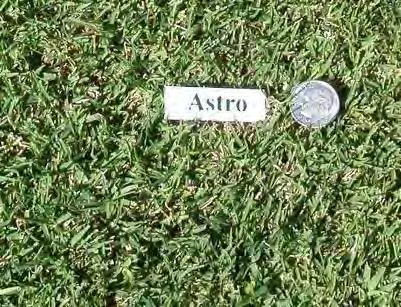
23 Best Traffic Tolerance Tifway Astro Tiftuf North Shore Numex-Sahara Latitude 36 Patriot Riviera Not The Best Traffic Tolerance Princess Yukon Kashmir Celebration

24 Traffic Tolerance: Cultivar Differences Riviera Latitude 36 Tifway

25 Spring Greenup Following Traffic Best Not The Best Latitude 36 Kashmir Patriot Princess Tiftuf Yukon Riviera North Shore * Astro Numex-Sahara * Tifway * Celebration

26 Latitude 36 Tiftuf Northbridge Riviera Tifway


27 Winter Traffic Feb. 16, 2008 Mar. 20, 2008 Spring recovery/greenup in March approximately 50% for control plots, 15% for drained traffic, and <10% for wet traffic. Control areas reached 100% spring recovery/greenup in April vs. June for the areas receiving winter traffic.

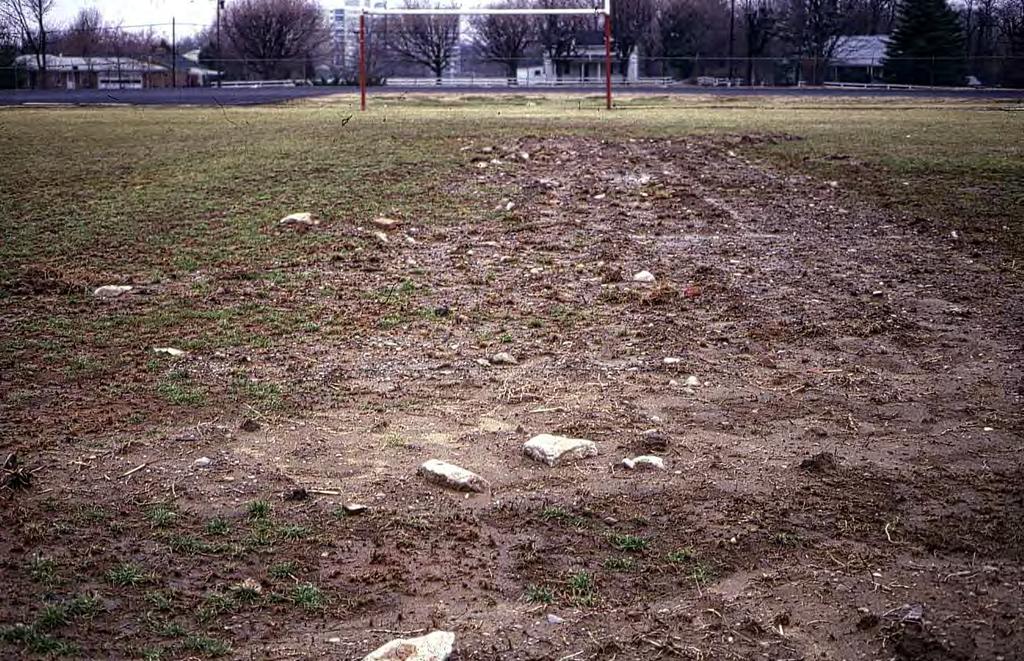
28 Traffic Management Wet Fields result in soil displacement, poor footing, turf ripping Play on wet fields causes increased compaction (harder surface may equal more injuries)

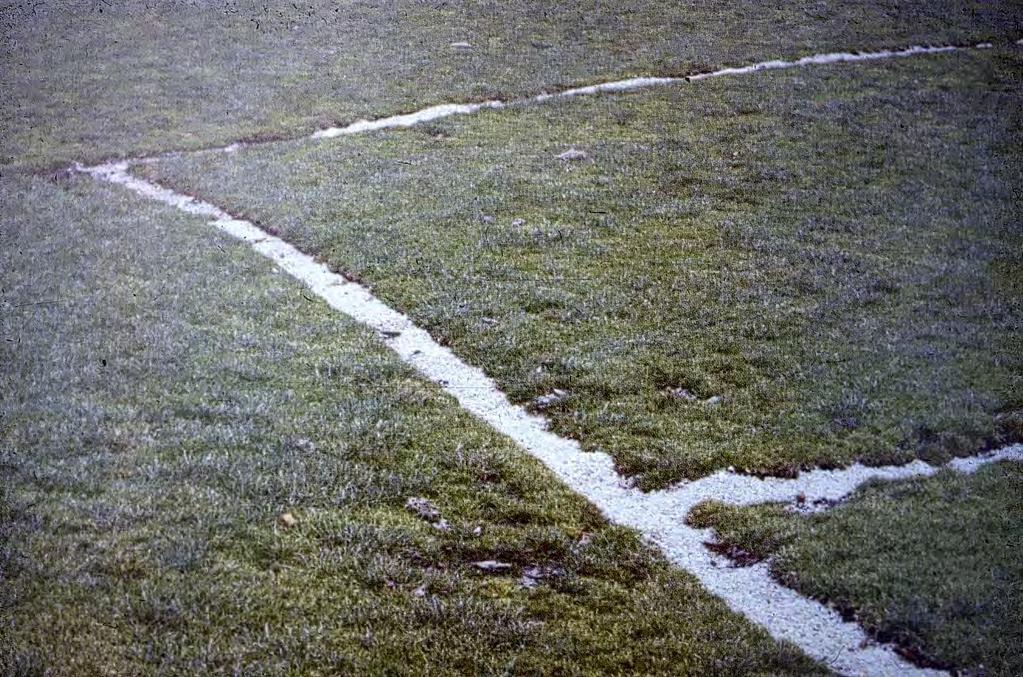
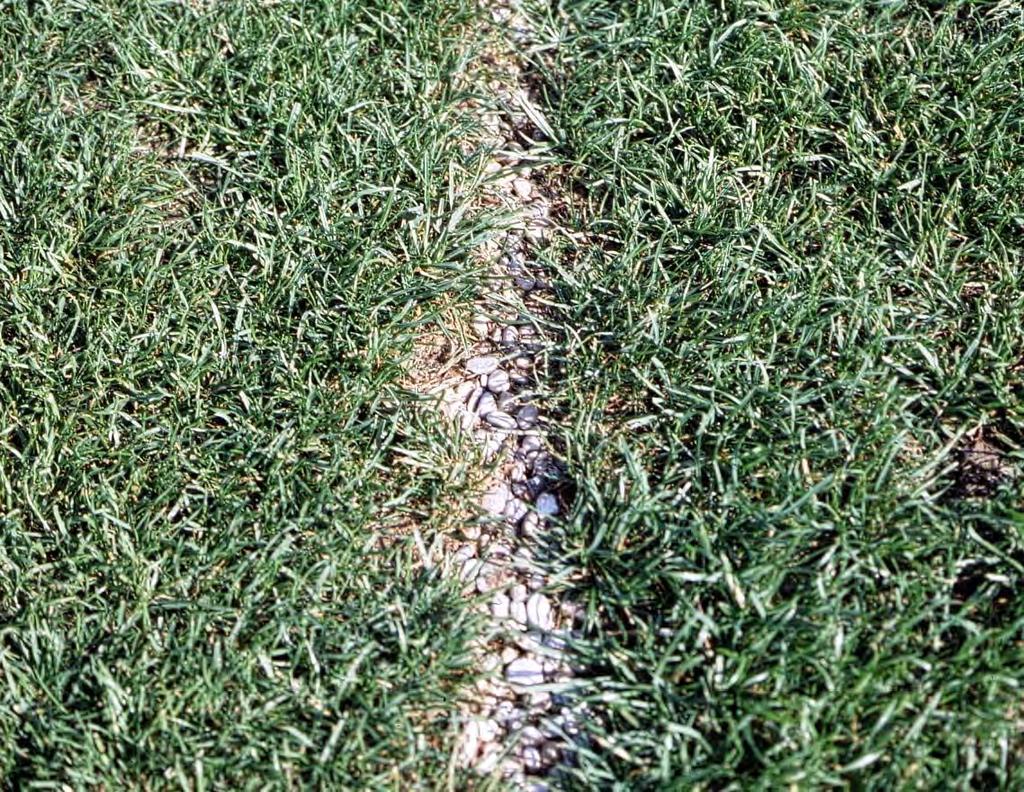
29 The key to a successful athletic field is 90% drainage and 10% common sense. If you don t have enough common sense, install more drainage. --Mike Goatley
30

31

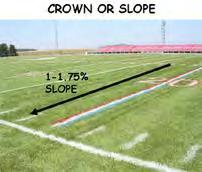
32 The Kentucky Crown

33 IMPROVING POOR SOILS-- COMPACTION is a physical condition of soil resulting from the compression of the soil into a relatively dense mass a reduction in macropore space occurs in areas of high foot and/or vehicle traffic mostly confined to the top 3-4 inches of the soil


34 Importance of Soil Aeration: Root growth -- Gas exchange replace CO 2 and other possibly toxic gases with oxygen Microbial activity is supported by dequate aeration Not compacted Medium compaction High compaction

35 Measuring surface hardness with Clegg Impact Soil Tester
36


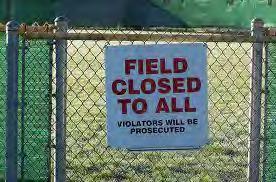

37 Use lots of signs with specific instructions.
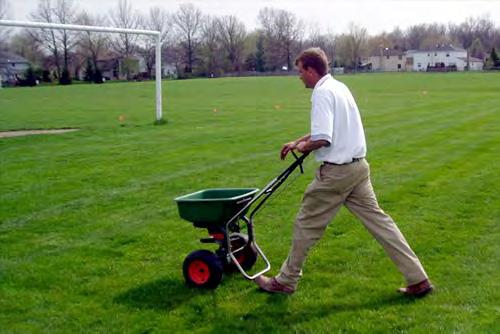
38 Nutrition


39 Soil test! Nutrition lbs N/1000 sq ft/growing month 1 lb N/M/mo 2 lb N/M/mo 4 lb N/M/mo Bermudagrass winterkill in Kentucky following summer nitrogen applications
40 Nutrition Judicious N apps in fall provide a little color but promote winter weeds Potassium winterizer o o K can increase in cell sap and act as an antifreeze If soil test K is adequate, little benefit is gained by adding more and may overload exchange sites in soil limiting availability of other nutrients
41 Managing Bermudagrass in the Transition Zone 3 Keys to Management from a Sports Turf Manager Fertility plan feeding the soil Newer varieties(latitude 36 and Northbridge vs Tifway 419) Using growth blankets in the spring and fall to get a head start and prolong the growing season
42 FEEDING THE SOIL Feeding the soil basic philosophy o Using less synthetic granular fert, more organic sources o Using less granular N, more liquid N released by microbial activity o Spraying molasses o Spraying foliar products have high levels of amino acids for plant health o Making a real effort to build up the carbohydrate level in the plant

 and a")
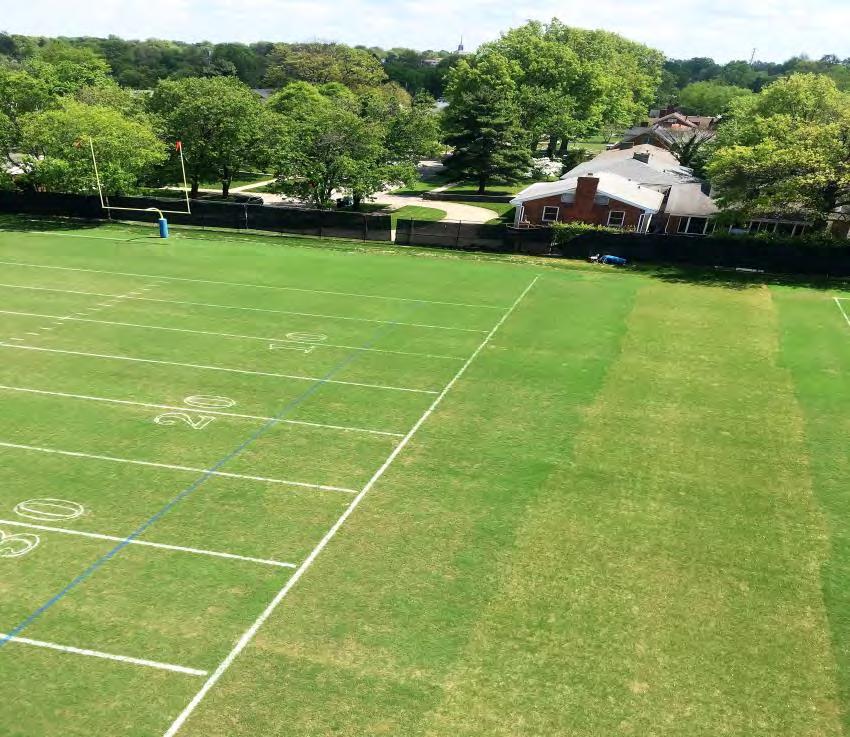
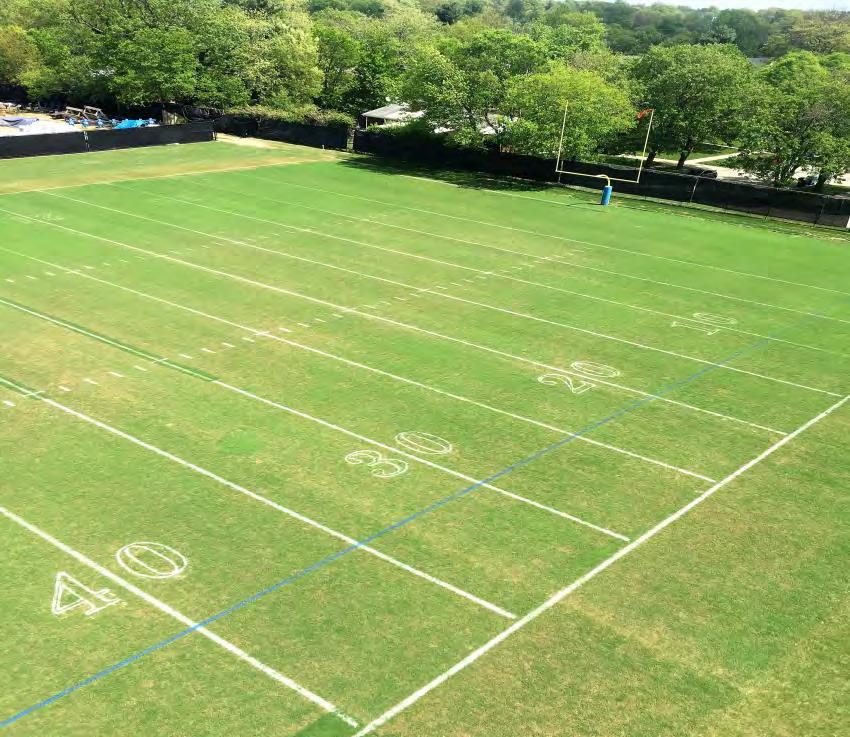
43 Two basic philosophies o Set and forget Covers o Prolong growing season Bermudagrass spring greenup differences between a lightweight cover (left) and a turf blanket (right).

44 May 6, /52

45 Temperature readings under the covers at the surface, 1 soil temp, and surface uncovered 4/18 84/48 4/19 83/50 4/20 84/56 4/21 76/62 4/22 71/54 4/23 69/53
46 1.5 Soil Temps 1/11/18 Baseball (native soil) covered 50.8, uncovered 42 3oz woven polypropylene Practice Football (10 USGA) covered 48.3 uncovered oz non woven polypropylene Game Soccer (sand cap) covered 48 uncovered oz woven polypropylene Practice Soccer (sand cap) covered 47.7 uncovered oz polypropylene core sheathed in polyethelene Softball (native soil) uncovered 41.4


47 6/8/12, the first year of blankets in the spring and almost 1 year of feeding the soil plan

48 5/1/15 and 4/25/16

49 5/1/15 and 4/25/16

50 5/1/15 and 4/25/16

51 5/1/15 and 4/25/16

52 5/1/15 and 4/25/16

53 5/1/15 and 4/25/16

54 Average Temperature and Total Rainfall Lexington, KY Dec 1-March 15 Year Days below freezing and low , 2/10-2/17, , 12/13-12/19, , 1/13-1/15, 13, 28,294 sqft , 2/1-2/2, 5, 22,665 sqft , 2/6-2/11, -6, 15,081 sqft , 2/15-2/20, -18, 13,000 sqft.(used Latitude36) , 1/18-1/24, 4, 6300 sqft ,1/5-1/8, 4, 1575 sqft /25-1/6,-3


55