Living On The Edge: implications of growth and development on watersheds in the Charleston region
|
|
|
- Mabel Andra Terry
- 5 years ago
- Views:
Transcription
1 Living On The Edge: implications of growth and development on watersheds in the Charleston region Norman S. Levine - Department of Geology, May 17, 2018 Director: Lowcountry Hazard Center & Santee Cooper GIS and Remote Sensing Laboratory

2 The Low Country Perspective Understanding the landscape Population Explosion Living with the tides and rising sea Available tools Considerations Moving Forward General Overview
3 Regional Overview Charleston is the second largest city in South Carolina Approximately 43 people move into Charleston Region each day. The Tri-County Region is expected to have a population over 1 million within a decade. Charleston is the 24th fastest growing U.S. metropolitan region

4 What we see today Growth is increasing pressure on infrastructure as well as pushing people into marginal lands

5 What we see today Population Over 370,000 (2010). As of 2016, the Charleston SC Metro Area population is 761,155, growing at 3X the U.S. population average.
 Many home in")

6 Understanding the landscape It is the largest county in South Carolina by total land and water area, 1,358 square miles (3,520 km 2 ) Many home in the region have a 1 st floor elevation of just over 10 feet The area is defined by wetlands, Made-land and a Dissected Terrain - over 700 bridges in region

7 Charleston is not alone Coastal South Carolina can be thought of as those counties that Historically supported rice fields and today have large areas of tidally influenced wetlands. Beaufort Dorchester Berkley Georgetown Colleton Jasper Horry Accounting for 1,450,000 residents of south Carolina s over 5,000,000 people or ~ 29% of the total population of the state
8 Water Defines The Low country Flooding has been a concern across the state.but it defines our coasts Charleston has already experienced over a foot of sea level rise in the past century Frequent tidal events cause regular minor flooding - nuisance flooding This term does not suggest how large of a problem this can be for our coastal cities, Nuisance flooding can cause infrastructure damage - transportation, sewer systems, as well as pose human health risks, and real estate impacts United States has 8 of 20 of the world s most vulnerable cities in terms of annual loss due to flooding A recent Charleston study found that nuisance flooding will cost just under what extreme events cost the city.
9 Effects of Land Cover Changes on Watersheds Precipitation Sediment Yield Evaporation Runoff Erosion Land use Flooding Land Cover Interception Water Quality Infiltration Groundwater Ecological Disruption

10 Land use change in the region


11 Types of Flooding I Riverine Flooding Across the entire State Can be modeled upstate Can be estimated in coastal areas 10 Year 100 year 500 year floods in Berkeley Hec-Ras, Hazus,


12 Types of Flooding II Rainfall Runoff Across the entire State Can be modeled SCS-Curve Number Rational Requires a detailed Knowledge of precipitation, land use, soils, topography, and watershed routing. Elevation Precipitation Land use Hydric Soil Types Watershed routing Rainfall runoff Due to Irma in Mt pleasant


13 Types of Flooding I Tides, SLR, and Surge Inundation Modeling Storm Surge Flooding Coastal Counties Only Can be modeled Models are coarse hours prior Slosh MOM model for Charleston Region

14 Sunny Day / Nuisance Flooding Tide driven flooding 18 Days in October Where the tidal level exceeded MHHW by.38 m The level at which we start to see impact on Charleston Area Roads and Property
15 Approximately 4 hours of Nuisance Flooding Predicted Charleston had 38 days of Flooding in 2015 and 50 days of flooding in is on the way to set a new record
16 Combining the Pieces Flooding is often exacerbated by man made infrastructure and planning decisions of previous generations. The Dam Failure of the 2015 storm is a perfect example of how changes in land use and issues with maintaince led to the dam failures as increased runoff and degraded storage capabilities combined with adverse consequences. The different types of floods can often occur at the same time raising the stakes to our citizens as the water levels rise.


17 Watersheds in the upstate are fairly easy to define Watersheds Upstate VS Lowcountry In the Lowcountry developing watershed boundaries are exceedingly difficult.


18 Lets look at development Dunes West Development Mount Pleasant, SC

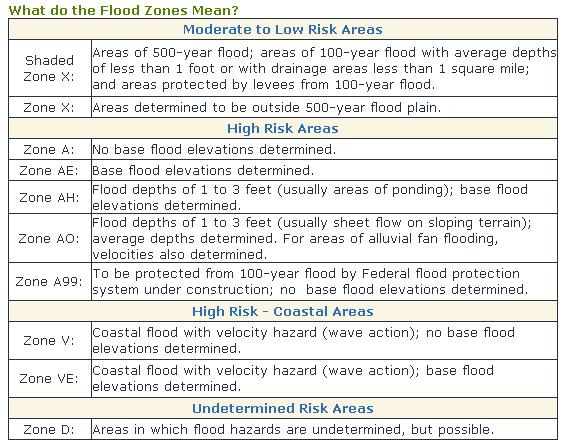
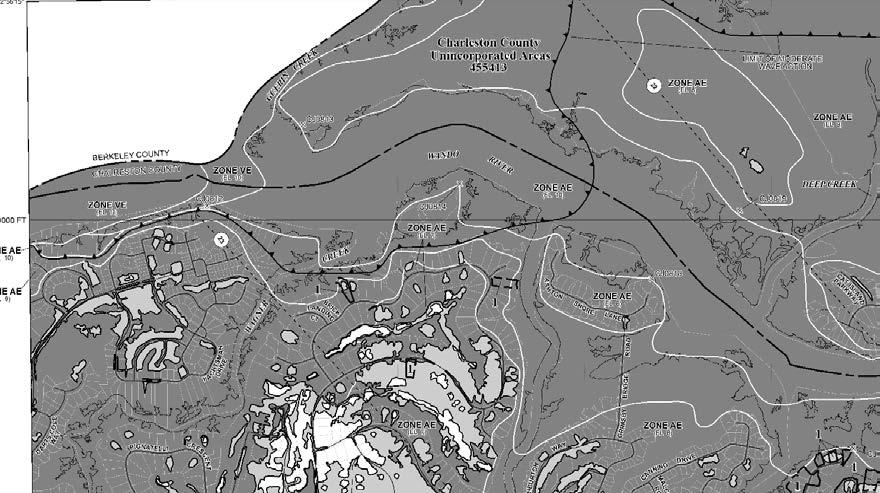
19 FEMA Flood Maps

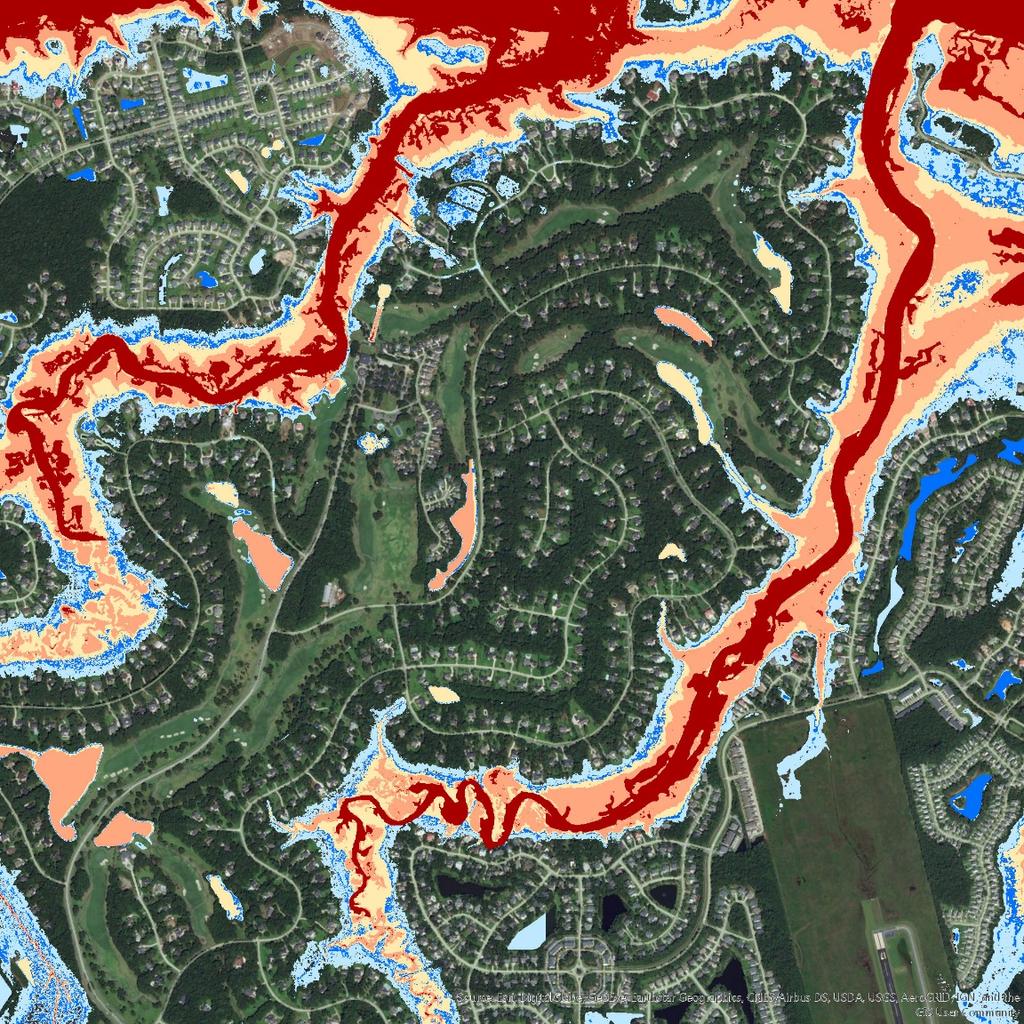
20 Irma and Surge - rainfall

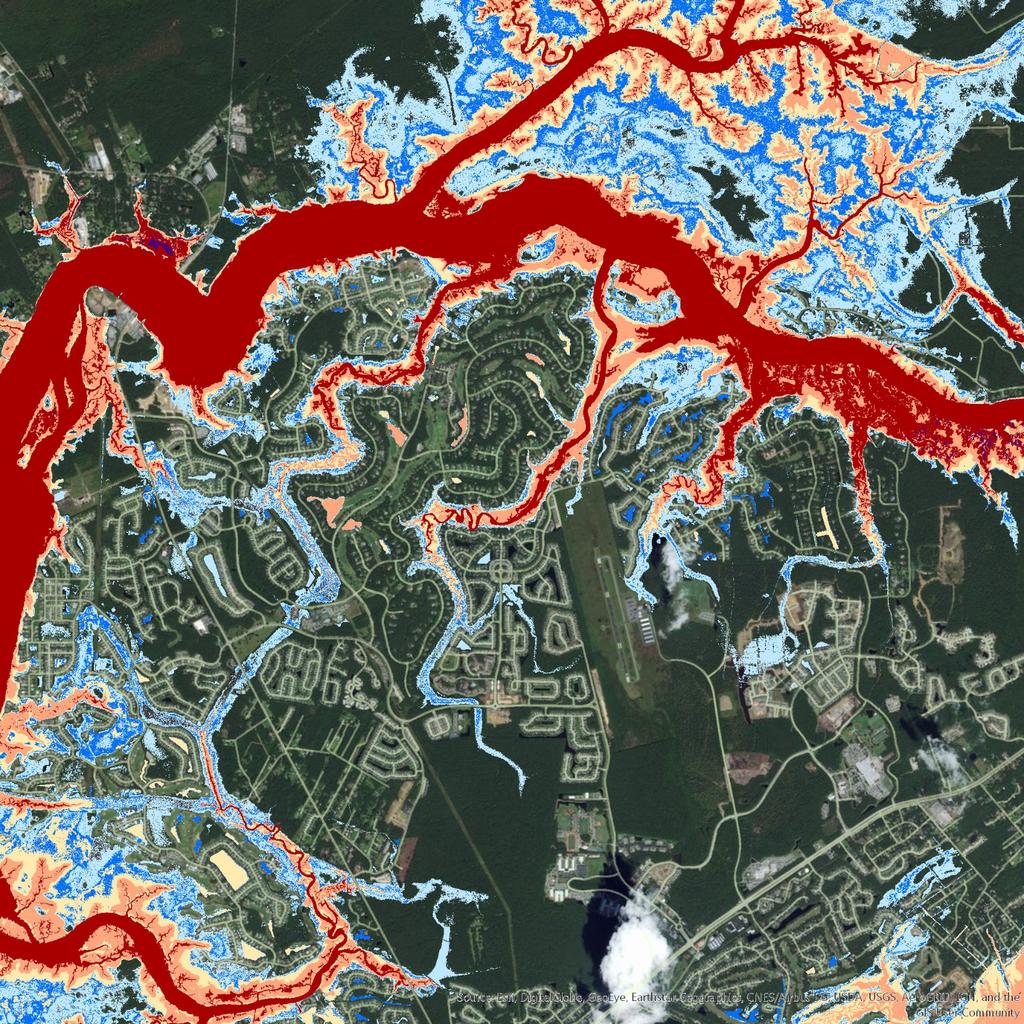
21 Irma and Surge - Surge
22 SLR
23 Take-aways Planners must consider ways of living with the water Engineering is only one part of the equation Roads can act as drains or as streams - moving water What one neighbor does affects another Options all cost money: Retreat Rebuild Raise Drain Protect
24 General tools for planners Model or Data Source Ease of Use FEMA Firm Maps GIS Accessible, confusing, often does not translate well for planning NOAA Slosh Models GIS Accessible, Simple Good for risk Zones, Coarse scale NOAA Seal Level Rise Viewer Web Based, GIS data sets available for download, Good for understanding Future risk Flood IQ NGO Web Interface, Will be in use by major Realtors this year, Provides Hurricane and tidal scenarios into the future HEC RAS GIS and modeling background needed. Current and What if Strategies are possible HAZUS GIS and modeling background needed. Current and What if Strategies are possible


25 Thank you --- Questions Average Day in 2100 Crossing a street downtown at High Tide