Development of a weighting approach for the Environmental Footprint
|
|
|
- Reynold Hart
- 5 years ago
- Views:
Transcription


1 Development of a weighting approach for the Environmental Footprint Serenella Sala, Alessandro Kim Cerutti, Rana Pant 2018 EUR EN
2 This publication is a Technical report by the Joint Research Centre (JRC), the European Commission s science and knowledge service. It aims to provide evidence-based scientific support to the European policymaking process. The scientific output expressed does not imply a policy position of the European Commission. Neither the European Commission nor any person acting on behalf of the Commission is responsible for the use that might be made of this publication. Contact information Name: Serenella Sala Address: Via E. Fermi 2749 TP Ispra (VA) Italy serenella.sala@ec.europa.eu JRC Science Hub JRC EUR EN Print ISBN ISSN doi: / PDF ISBN ISSN doi: / Luxembourg: Publications Office of the European Union, 2018 European Union, 2018 The reuse of the document is authorised, provided the source is acknowledged and the original meaning or message of the texts are not distorted. The European Commission shall not be held liable for any consequences stemming from the reuse. How to cite this report: Sala S., Cerutti A.K., Pant R., Development of a weighting approach for the Environmental Footprint, Publications Office of the European Union, Luxembourg, 2018, ISBN , EUR 28562, doi / All images European Union 2018
3 Contents Abstract... 1 Acknowledgements... 2 Executive summary Introduction Overview of weighting methods in LCA Stakeholders discussions and survey by UNEP-SETAC on normalisation and weighting Definition of the most suitable weighting approach for the environmental footprint Workshop on weighting for EF by DG ENV Evaluation of weighting methods Criteria for evaluation Outcomes Options developed for weighting and their evaluation Implementation of the defined options and calculation of weighting factors Methods for the calculation of WFs adopting a panel based approach (Options 3.a and 3.b) Target groups, sampling and geographical coverage Lay respondents LCA Experts Survey results General public LCA Experts Methods for the calculation of WFs adopting a hybrid evidence-based and expertjudgement approach (Option 3.c) Methods and expert participation Input received Results on the level of each criteria (Step 2) Results of the relative importance of each criterion (Step 3) Different sets and ways to combine them Accounting for robustness The overall recommendations for the EF weighting Overview of developed weighting set for EF and previously available ones References List of Figures List of Tables Acronyms Annexes i
4 Annex 1. Weighting tool Annex 2. Distance to target method for Europe in Annex 3. Minutes of the weighting workshop in Brussels (November 2015) Annex 4. Materials on the evaluation of weighting methods Annex 5. Options developed for weighting of impact categories Annex 6. Evaluation of the proposed weighting options Annex 7. Questionnaire design Annex 8. Participants to the webinar Annex 9. Criteria design and preliminary assessment Annex 10. Agenda and slides presented in the two webinars Annex 11. Comments received during the webinar and its follow-up Annex 12. Midpoint to endpoint and monetisation Annex 13. Comments posted on the discussion part of the DG ENV EF wiki system 131 Annex 14. Presentation to the EF Steering Committee on May 30, 2017, on the comments received on the consultation draft and related actions ii
5 Abstract In Life Cycle Assessment (LCA), according to ISO (ISO 2006), normalisation and weighting are optional steps of Life Cycle Impact Assessment (LCIA). Those steps allow expressing LCA results aggregating the results (up to a single score), giving different weight to the different environmental impacts. The step of prioritising and aggregating the results for the 16 environmental impact categories evaluated in the life cycle based Environmental Footprint (EF) - covering e.g. climate change, acid rain, human and eco-toxicity, particulate matter but also impacts due to the use of water, land and resources has a high relevance. Weighting supports the identification of the most relevant impact categories, life cycle stages, process and resource consumptions or emissions to ensure that the focus is put on those aspects that matter the most and for communication purposes. Any weighting scheme is not mainly natural science based but inherently involves value choices that will depend on policy, cultural and other preferences and value systems. No consensus on weighting seems to be achievable. This situation does not apply only to weighting in a LCA or Environmental Footprint context, but seems inevitable for many multicriteria approaches. The objective of this work therefore was to find a convention suitable for the application in the EF context and to develop a method for weighting the Environmental Footprint Impact Categories according to their relevance for the overall environmental problems. A final recommendation is provided on a weighting set to be used for the EF that includes also aspects of the robustness of the results. This report includes, from page 46 onward, several annexes and the comments from a consultation of the Environmental Footprint Technical Advisory Board in June
6 Acknowledgements The authors of the report gratefully thank the London School of Economics and Political Science and associated partners for their contribution. In particular Francisco Lupiáñez- Villanueva and his team from Open Evidence, for timely and effective support. Furthermore, a thank goes to the participants of the webinar, the lay respondents and the experts that participated in the questionnaire as well as to the experts contributing to the weighting workshop. A part of the work has been based on discussions and results of the UNEP-SETAC working group on normalisation and weighting, and for this we would like to also thank its members. We also thank Lorenzo Benini for his contribution to the first three chapters, Marco Cinelli for his contribution to the first four chapters, and Michela Secchi for her support in the development of the weighting tool used as background instrument for the comparisons of the weighting sets. We acknowledge the financial support of the Directorate General for the Environment (DG ENV) supporting this work under an Administrative Arrangement (AA JRC No /ENV/2013/SI /A1). 2
7 Executive summary Companies that want to highlight the environmental performance of their organisation or their products currently face numerous obstacles. They have to choose between several assessment methods promoted by public and private initiatives, are often forced to pay multiple costs for generating environmental information, and have to deal with potential mistrust of consumers who are confused by the proliferation of too many communication tools with different information that makes products difficult to compare. The Communication on Building the Single Market for Green Products (COM (2013) 196 final) and the related Recommendation 2013/179/EU on use of common methods to measure and communicate the environmental life-cycle performance of products and organisations, aim to ensure that environmental information in the EU market is comparable and reliable, and can be used confidently by consumers, business partners, investors, other company stakeholders, and policy makers. In this context, the step of prioritising and aggregating the results for the 16 environmental impact categories evaluated in the life cycle based Environmental Footprint (EF) - covering e.g. climate change, acid rain, human and eco-toxicity, particulate matter but also impacts due to the use of water, land and resources has a high relevance. In Life Cycle Assessment (LCA), according to ISO (ISO 2006), normalisation and weighting are optional steps of Life Cycle Impact Assessment (LCIA). Those steps allow expressing LCA results aggregating the results (up to a single score), giving different weight to the different environmental impacts. This aggregated output can present a desired feature to enable the comparison of overall expected environmental impacts between alternative goods or services. The normalisation references express the total impact of a reference region for a certain impact category (e.g. climate change, eutrophication, etc.) in a reference year. For the Environmental Footprint (EF), due to the international nature of supply chains, the use of global normalisation factors is recommended versus the use of EU based normalisation factors. Weighting has a value in the Environmental Footprint to support the identification of the most relevant impact categories, life cycle stages, process and resource consumptions or emissions to ensure that the focus is put on those aspects that matter the most and for communication purposes. So far, in the Environmental Footprint pilots, an equal weighting approach (1:1:1 ) after characterisation and normalisation has been adopted. This assigns an equal weight to each of the environmental impact categories. Any weighting scheme is not mainly natural science based but inherently involves value choices that will depend on policy, cultural and other preferences and value systems. No consensus on weighting seems to be achievable. This situation does not apply only to weighting in a LCA or Environmental Footprint context, but seems inevitable for many multicriteria approaches. However, weighting is seen as essential to further aggregate information with the objective to improve the practical utility of footprint assessments in complex decision situations. The objective of the work of JRC on weighting, therefore, was to find a convention suitable for the application in the EF context and to develop a method for weighting the Environmental Footprint Impact Categories according to their relevance for the overall environmental problems. In LCA literature, 5 groups of approaches to develop weighting factors have been identified (Istubo 2015; Pizzol et al. 2017): I. Single Item: physical properties or equivalents are used to characterize/weight the inventory (e.g. Cumulative Energy Demand, carbon footprint); 3
8 II. Distance-to-Target: where characterization results are related to target levels, either policy based or carrying capacity-based (e.g. planetary boundaries); III. Panel-based (value based or preference based): the relative importance of damages/impact categories/interventions is derived from a group of people (experts and/or stakeholders) through surveys and elicitation techniques; IV. Monetary valuation: monetary estimation involved in evaluation (willingness to pay -WTP, etc); V. Meta-models: Impacts are weighted by applying multiple weighting factors, resulting from the combination of other weighting sets. The process of defining the most suitable weighting approach for the EF has been deployed through a number of steps: A workshop has been organised by DG ENV in November 2015 to discuss the main options on weighting for EF. A review of the available and operational weighting sets developed over time. This has been done both considering scientific literature, grey literature and proposals from EF pilots. The reviewed weighting approaches have been evaluated against a set of criteria to identify strengths and weaknesses as well as level of applicability to EF. The identification of viable options for building a weighting set and evaluation thereof towards the preferred option. The development of the EF weighting set according to the preferred option: a hybrid evidence- and judgement-based weighting set. Some of the most promising options are implemented and sets of related weighting factors are calculated. The question if and how to include the aspect of the robustness of the results for different impact categories is addressed. A final recommendation is provided on a weighting set to be used for the EF that includes also aspects of the robustness of the results (see following tables). The weighting sets are presented including and excluding three toxicity related impact categories (human toxicity cancer, human toxicity non-cancer and freshwater ecotoxicity) as currently in an EF context those impact categories are not seen as sufficiently robust to be included in external communications or in a weighted result. The intention is to include those three toxicity related impact categories once their robustness has been sufficiently improved. 4
9 The recommended weighting set, robustness factors and final weighting factors for all midpoint impact categories 1 Aggregated weighting set Robustness factors Intermediate Coefficients Final weighting factors (incl. robustness) (A) (B) C=A*B C scaled to 100 Climate change Ozone depletion Human toxicity, cancer effects Human toxicity, non-cancer effects Particulate matter Ionizing radiation, human health Photochemical ozone formation, human health Acidification Eutrophication, terrestrial Eutrophication, freshwater Eutrophication, marine Ecotoxicity freshwater Land use Water use Resource use, minerals and metals Resource use, fossils The recommended weighting set, robustness factors and final weighting factors excluding toxicity-related impact categories 1. Final Aggregated weighting Robustness Intermediate weighting factors factors Coefficients set (incl. robustness) (A) (B) C=A*B C scaled to 100 Climate change Ozone depletion Particulate matter Ionizing radiation, human health Photochemical ozone formation, human health Acidification Eutrophication, terrestrial Eutrophication, freshwater Eutrophication, marine Land use Water use Resource use, minerals and metals Resource use, fossils The naming of the impact categories has been adopted to be in line with the last EF recommendation on impact categories. Throughout the document slight deviations may occur, as during the survey and the webinar 15 impact categories with slightly different naming were presented. 5
10 1 Introduction The Communication on Building the Single Market for Green Products (COM (2013) 196 final) (EC, 2013a) and the related Recommendation 2013/179/EU (EC, 2013b) on use of common methods to measure and communicate the environmental life-cycle performance of products and organisations, aim to ensure that environmental information in the EU market is comparable and reliable, and can be used confidently by consumers, business partners, investors, other company stakeholders, and policy makers. This was seen as necessary as today, companies that want to highlight the environmental performance of their organisation or their products face numerous obstacles. They have to choose between several assessment methods promoted by public and private initiatives, are often forced to pay multiple costs for generating environmental information, and have to deal with the mistrust of consumers who are confused by the proliferation of too many communication tools with different information that makes products difficult to compare. The step of prioritising and aggregating the results for the ~15 environmental impact categories evaluated in the life cycle based Environmental Footprint (EF) - covering e.g. climate change, acid rain, human and eco-toxicity, particulate matter but also impacts due to the use of water, land and resources has a high relevance. In the context of Life Cycle Assessment (LCA), according to ISO (ISO 2006), normalisation and weighting are optional steps of Life Cycle Impact Assessment (LCIA). Those steps allow the practitioner expressing results after characterization using a common reference impact and then aggregating the results into a single score, giving different weight to impacts. This supports the comparison between alternatives using reference numerical scores (Bengtsson and Steen 2000, Huppes and van Oers 2011, Huppes et al. 2012). In the context of LCA for supporting policy decisions, weighting may help to: i) identify the most relevant impact categories; ii) guide decision makers, e.g. related to eco-innovation policies and strategies, towards the most effective solutions for reducing environmental impacts; iii) present results in an aggregated manner (up to a single score) for better decision support and for communication purposes. Currently, in the Environmental Footprint pilots, an equal weighting approach (1:1:1 ) after characterisation and normalisation is adopted. This assigns an equal weight to each of the 16 midpoint impact categories that are captured in the Recommendation on the use of common methods to measure and communicate the life cycle environmental performance of products and organisations (EC 2013) and described more in detail in the recommendations of the International Reference Life Cycle Data System (ILCD) Handbook (EC-JRC 2011). The weighting has an essential role to play in the EF to support the identification of the most relevant impact categories, life cycle stages, process and elementary flows (describing a resource consumption or emission) to ensure that the focus is put on those aspects that matter the most. However, any weighting scheme is not mainly natural science based but inherently involves value choices that will depend on policy, cultural and other preferences and value systems. No consensus on weighting seems to be achievable. This situation does not apply only to weighting in a LCA or EF context, but seems inevitable for many multicriteria approaches. However weighting is seen as essential to further aggregate information with the objective to provide better support in complex decision situations. The objective of the work of JRC on weighting is therefore to find a convention suitable for the application in the EF context and to develop a method for weighting the Environmental Footprint Impact Categories according to their relevance for the overall environmental problems. A range of viable options for developing a weighting method is presented in the next sections, together with an evaluation of these options against defined criteria. Some of the most promising options are implemented and sets of related weighting factors are 6
11 calculated. The question if and how to include the aspect of the robustness of the results for different impact categories is addressed and a final recommendation is provided on a weighting set to be used for the EF that includes also aspects of the robustness of the results. When meaningful, weighting sets are presented including and excluding three toxicity related impact categories (human toxicity cancer, human toxicity non-cancer and freshwater ecotoxicity) as currently in an EF context they are not seen as sufficiently robust to be included in external communications or in a weighted result. The intention is to include those three toxicity related impact categories once their robustness has been improved. 1.1 Overview of weighting methods in LCA In LCA literature, 5 groups of approaches to develop weighting factors have been identified (summary in Figure 1 and Table 1) (Istubo 2015; Pizzol et al. 2017): I. Single Item: physical properties or equivalents are used to characterize/weight the inventory (e.g. Cumulative Energy Demand, carbon footprint); II. III. IV. Distance-to-Target: where characterization results are related to target levels, either policy based or carrying capacity-based (e.g. planetary boundaries); Panel-based (value based or preference based): the relative importance of damages/impact categories/interventions is derived from a group of people (experts and/or stakeholders) through surveys and elicitation techniques; Monetary valuation: monetary estimation involved in evaluation (willingness to pay -WTP, etc); V. Meta-models: Impacts are weighted by applying multiple weighting factors, resulting from the combination of other weighting sets. An excel tool has been prepared in order to collect available weighting sets following several of the above-mentioned approaches. The excel file reports also the calculation needed for applying the set of factors on EF impact categories. Details of weighting tool are available in Annex Stakeholders discussions and survey by UNEP-SETAC on normalisation and weighting A strong demand for simple understandable and clear outcomes for decision support especially in policy context or in business decisions emerged from the survey conducted by UNEP-SETAC working group on normalisation and weighting. A debate is ongoing whether clarity and simplicity may be reached adopting endpoint or even single score methods. To contribute to this debate, in 2015, a session was organized at SETAC workshop about the use of midpoint, endpoint or single score for sound decision support (Kägi et al. 2016). Furthermore, UNEP- SETAC task force on cross cutting issues has conducted a survey to practitioners to evaluate the level of use and confidence in normalisation and weighting approaches and the insights (Pizzol et al. 2017) have been used to develop the weighting options for EF. 7

12 Figure 1. Overview and taxonomy of available weighting methods in LCA 8
13 Table 1. Classification of weighting approaches and methods, modified from Pizzol et al Approach Principle Method Definition Sources Distance to target Impacts are weighted according to their proximity to a target Normative targets Impacts are weighted according to their proximity to a target. It includes the normative target method, where the targets are defined based on regulations (e.g. the CO2 reduction target). The set of targets, for specific contexts (e.g. EU, US, Global), already reflects a sociopolitical agreement - subject to a multistakeholders process -on a category of impacts. (Norris and Marshall 1995, Seppälä et al. 2001, Hauschild and Potting 2005, Rüdenauer et al. 2005, Weiss et al. 2007). For Europe, distance to target weighting set has been recently released (Castellani et al 2016) details of this approach are described in Annex 2. Panel weighting Impacts are weighted based on the opinions of a group of people, and their preferences are translated directly into numeric values or ranges. Stakeholder panel A panel weighting method where non-expert individuals compose the panel. Depending on the panel size, the panellists opinion may be solicited via interviews, workshop, or survey. Stakeholder panel can show subsets of opinions (e.g., academia, industry, NGOs) and be a mix of experts and nonexperts. (Huppes and van Oers 2011) Expert Panel A panel weighting method where expert individuals of various backgrounds (academia, industry, politicians) compose the panel. (Goedkoop and Spriensma 2001, Soares et al. 2006, Goedkoop et al. 2013) Monetary weighting Impacts are weighted according to their estimated economic value. Observed preferences A monetarisation method where the marginal value of a good is identified based on its market price. Includes the budget constraint method, a monetarisation method where the marginal value of a Quality-Adjusted Life Year is identified on the basis of the potential economic production per capita per year. (Steen 1999a, b, Weidema et al. 2008, Weidema 2009, Weidema 2015) Revealed preferences A monetarisation method where the marginal value of a good is identified on the basis of the market price of a surrogate good, i.e. a good that is indirectly affected by changes in availability of the primary good (e.g. via hedonic pricing or travel cost assessment) (Boardman et al. 2006, Finnveden et al. 2006) 9
14 Approach Principle Method Definition Sources Stated Preferences A monetarisation method where the marginal value of a good is identified on the basis of the preferences expressed by a demographically representative panel, in response to hypothetical trade-off questions (e.g. via contingent valuation survey methods or choice experiments) (Steen 1999a, b, Itsubo et al. 2004, Ahlroth and Finnveden 2011, Itsubo et al. 2012, Itsubo et al. 2015) Binary weighting Impacts are assigned either no weight or equal importance, based on criteria decided by the practitioner Equal weighting Footprinting A binary weighting method where the practitioner assumes all impact categories have equal weight (weight equals one) A binary weighting method where the practitioner selects one or several impact categories (weight equals one) and disregards the other categories (weight equals zero) Method unpublished but applied in practice (ISO 2014, Ridoutt et al. 2015) Impacts are weighted according to average characterization factors which translate from midpoint to endpoint indicators Mid-toendpoint Mid-toendpoint factors A mid-to-endpoint method where characterization factors are applied to midpoint indicators in order to obtain endpoint indicator. The resulting indicator(s) are one per Area of Protection and additional weighting should be applied in order to obtain a single score (Humbert et al.2015) (Weidema 2009) Midpoint contribution to endpoint A mid-to-endpoint method where characterization factors are applied to midpoint indicators in order to obtain endpoint indicators, for a specific normalisation reference (e.g. EU totals, World totals). Then, the relative contribution of each midpoint indicator is calculated and used as weights. This can be performed for each of the AoP indicators, or for a single index resulting from the aggregation of the AoP indicators (Ponsioen and Goedkoop 2015) Metamodels Impacts are weighted by applying multiple weighting factors Meta-model A meta-model is a weighting method for which multiple weighting methods are used and averaged according to a defined weighting scheme (Soares et al. 2006, Huppes and van Oers 2011, Huppes et al. 2012) 10
15 2 Definition of the most suitable weighting approach for the environmental footprint The process of defining the most suitable weighting approach for the EF has been developed through a number of steps. A workshop has been organized by DG ENV in November 2015 to discuss the main options on weighting for EF. A review of the available and operational weighting sets developed over time. This has been done both considering scientific literature, grey literature and proposals from EF pilots. The reviewed weighting approaches have been evaluated against a set of criteria to identify strengths and weaknesses as well as level of applicability to EF. The identification of viable options for building a weighting set and evaluation thereof towards the preferred option. The development of the EF weighting set according to the preferred option: a hybrid evidence-and judgement-based weighting set. 2.1 Workshop on weighting for EF by DG ENV The workshop Environmental Footprint Weighting, organized by DG-Environment and supported by JRC from end of 2015 allowed (i) the presentation of the features of the weighting approaches in LCA presented in Table 1, (ii) the identification of criteria for evaluating such weighting methodologies (Table 2) and their current use. The minutes of the workshop are available in Annex 3 and the highlights from the workshop are summarized in this section. What are the key requirements from the policy, the industry and the scientific perspective and what shall be covered in a weighting set within the EF context? One size-fits-all approach was seen by some as bound to fail due to the high uncertainties in weighting and the existence of pluralism. Weighting might also help in achieving greater accountability. Optimization towards 15 indicators is much more difficult than optimization towards 1 variable and this was seen as one of the reasons for success of single existing single issue approaches like carbon footprint. Transparency in the methodology was seen as fundamental and uncertainty must be part of the communication as well. The use of multiple tools (e.g. input/output, consequential LCA, etc.) could be useful to make uncertainty and sensitivity analysis more effective. The weighting procedure and who should be involved The selection should focus on the most important impact categories, i.e. those that are important to society. It is responsibility of citizens, or consumers, with the help of experts. NGOs are to be included. It was commented, however, that if not all mandatory impact categories are included, those excluded are in fact weighed with 0. In order to secure comparability between different product groups, there is a need to have the same impact categories. All data on all ICs should be made available; if impact categories are omitted then it might look like an attempt to hide something. Which weighting set(s) is preferred? The testing of multiple weighting methods was considered very useful 2. 2 After the workshop the pilots have been provided with a table reporting available weighting sets together with guidance for their use 11
16 A request for inclusion of damage-based methodologies (mid-to-endpoint) and planetary boundary was made, together with considerations on the importance of the impacts 3. The approach proposed by (Soares et al. 2006) was briefly presented by the EC- JRC. The method combines following aspects: scale, duration, distance to target, reversibility, natural resources, ecosystem health, human health, uncertainty. A similar approach could be developed and tested (i.e. taking the advantageous aspects of all methods). A weighting approach based on the grouping or ranking of impact categories was recommended for consideration as well. Normalisation is part of the picture as well, as the decision about weighting might depend on normalisation. It was stated that uncertainty has to be addressed somehow, as the underlying impact categories can be more uncertain than the weighting itself. High uncertainty does not limit the use of some methods according to survey s results. Procedural instances: how to get there Weighting is about social attitudes, different stakeholders should have a say. Explore different panels (politicians, consumers, scientists) and weight them. Suggested procedure: I. selection of a set of weighting methods; II. evaluation against criteria; III. selection of a weighting method that performs better on the evaluation criteria. 2.2 Evaluation of weighting methods In order to understand the key features of the available weighting method and sets, an evaluation of methods against a set of criteria has been conducted Criteria for evaluation As there is no agreement on weighting and several approaches have been developed over time, some authors compared different weighting approaches. Finnveden et al., 1999 discussed the characteristics and calculation principles of the weighting sets. Next, Johnsen and Løkke 2013 selected a list of criteria for evaluating LCA weighting methods based on an extensive review of the literature available. For this assessment, a screening of weighting methods was firstly based on the review conducted by (Pizzol et al. 2017). The review has been developed in the context of a UNEP- SETAC life cycle initiative working group on normalisation and weighting, who have provided guidance to practitioners, as well as to method developers, who may want to use normalisation and weighting in LCIA. The outcomes are based on a classification followed by systematic expert-based assessment conducted by the UNEP SETAC task force on normalisation and weighting. This review was based on five criteria: scientific robustness, documentation, coverage, uncertainty, complexity (see Table 2). A similar approach was adopted in this document for complementing the list of reviewed weighting approaches, including mid-to-endpoint weighting and meta-models. 3 The table provided to the pilots after the workshop, included also of damage-based methodologies (mid-toendpoint) and planetary boundary. 12
17 Table 2. Criteria for the evaluation of weighting methods (from Pizzol et al. 2017). Research Main- Criteria Sub-research questions question To what extent is the method scientifically robust (replicates provide similar results) and why? Scientific robustness What is the science behind the development of the method? Is the method peer-reviewed and how would you rate the quality of its peer review, and why? To what extent are the method's objectives, underlying hypothesis, and principles clear and unequivocal, and why? To what extent can the method be further improved, refined, and developed, and why? Documentation Does the documentation allow understanding and reproducing the method? Publication and accessibility (how much effort is needed to retrieve the method-documentation? Is the method available free of charge? Is the method available online? Is it available in English?) What is the level of transparency of algorithms, data, factors, value choices, uncertainties? To what extent can the method be reproduced and extended by third parties? To what extent does the method allow for an extensive coverage of biophysical and/or social impacts? Coverage What is the scope of the method? Extensive coverage by normalisation/weighting factors of midpoint categories Extensive coverage by normalisation/weighting factors of endpoint categories To what extent does the method include geographical and time differentiations (and cultural differences, for weighting methods)? Uncertainty How are the uncertainties of the method addressed, handled, and described? What are the main uncertainties in the theoretical structure of the method and of the main assumptions and choices (Model Uncertainty)? What are the main uncertainties in background data used in the method (Parameter Uncertainty)? To what extent is there an explicit statement of the uncertainty associated with the final results, e.g., in terms of standard deviation, range of values, order of magnitude (Result uncertainty)? Have the parameters of the model with the highest influence on the final results been identified (Sensitivity analysis)? To what extent does the method provide accurate results? To what extent does the method provide precise results? Complexity What knowledge is required to apply the method in To what extent does the method allow accounting for natural variability beside uncertainty? What is the level of background scientific knowledge needed (trans-disciplinary, cross-disciplinary)? 13
18 Main- Criteria Research question practice (i.e. to obtain new normalisation/wei ghting factors)? Sub-research questions What is the technical support required for the performance of the method, in order to arrive at new or updated results, such as dedicated software, mathematical models, and databases? To what extent the method has been tested on real case studies (if yes to name a few in literature)? What is the general amount and type of data/information required (quantitative vs. qualitative data)? Outcomes Pizzol et al 2016 provide suggestions on whether the weighting methods are recommendable or not because of severe biases and/or whether it is suitable for midpoint or endpoint assessments. Within this document, additional recommendations are given for the class of meta-models and mid-to-endpoint models which are not included in Pizzol et al The pros and cons associated with each of the considered methods, by including reflections on the consistency between the typology of weights generated by the weighting method (i.e. coefficients of importance or of trade-off) and its use in the LCA weighting step is reported in Annex 4. A summary of the qualitative assessment of the methods based on the analysis provided by (Pizzol et al. 2017) and EC-JRC are shown in Table 3. Overall, the results of the evaluation clearly indicate that, although it is possible to evaluate weighting approaches according to technical criteria all approaches are characterized by some valid aspects and, at the same time, by methodological drawbacks. Overall, none of the weighting methods available fulfils all the requirements. Some methods are more mature than others for application at the ILCD recommended impact categories at midpoint: most of the current monetization methods have limits at the midpoint level; planetary boundaries currently cannot cover human-health and resource related impacts in an equivalent way to the ecosystem health related impacts; policy targets are not based on global figures, part of the supply chain is disregarded; mid-to-endpoint methods may add scientific information to a part of the aggregation but still need to make a range of decisions along the way which are (or can be seen) as value choices, that are not necessarily transparent anymore looking at the endpoint results. Also, these methods need further normative judgment to reach a comparison across the endpoints or to arrive at a single score; Panels-based methods suffer cognitive biases such as scale and framing. Nevertheless, the identification of the right perspective to be adopted (i.e. the right weighting approach) cannot stem from objective evaluations, as subjectivity plays a fundamental role. 14
19 Table 3. Performance and use recommendation of weighting methods according to evaluation criteria from (Pizzol et al. 2017) and elaboration by EC-JRC (+ (good), o (medium), (poor) performance of weighting method on assessment criteria). Weighting method Scientific robustness Docume ntation Coverage Uncertainty Complexity Comment Normative targets Panel-based Binary Stakeholder panel Expert Panel Observed preferences Revealed preferences Stated Preferences Equal weighting + + o + + o O + o + o + o + + o + + Footprinting o + Distance-totarget Monetarybased Mid-toendpoint Metamodels o + o O Depends upon used methods Depends upon used methods Depends upon used methods Depends upon used methods Depends upon used methods Recommended if weighting between targets is included, or the lack of this is explicitly mentioned; recommended for midpoint only Recommended for midpoint/endpoint, if information on panel composition and criteria for selection is provided Not recommended and if applied, recommended for midpoint only Not recommended in general, if applied recommended for midpoint only Recommended for endpoint only. Weights derived via choice experiment recommended over weights derived via contingent valuation (the former has higher consistency) Recommended for midpoint/endpoint, if explicit statement is provided that no weighting is really applied by the analyst Recommended for midpoint/endpoint, if explicit statement of implicit weighting is provided and motivations for selecting/excluding the categories are provided Not recommended if alternative robust endpoint methods are available for use.. They carry all the uncertainties and limitations of the underlying weighting methods. Recommended to midpoint/endpoint if information on the weighting amongst weighting methods is provided and units are coherently addressed 15
20 This means that no science can tell whether weighting based on distance to policy, precautionary boundaries, stakeholders and experts opinions or any other method is the right one to be applied, in general terms. Instead, a specific convention has to be built case-by-case according to the specificities of the decision context, decision makers and instances from stakeholders. Therefore, the focus of the evaluation should move from the scientific correctness of the weighting method, to the robustness, consistency and inclusiveness of the procedure designed for reaching a solution(s). Panel weighting, mid-to-endpoint and meta-models emerged as the premier candidates strategy for EF and a set of implementation options was devised. These options are described in the next section along with the criteria used to evaluate each one 2.3 Options developed for weighting and their evaluation As a result of the review and evaluation of weighting methods, four options for weighting the LCA impact categories for EF have been developed by EC-JRC (Table 4). The first three follow the compensatory aggregation rule while the fourth is based on the noncompensation methodological foundation. The distinction between these approaches implies that (Rowley et al. 2012): Compensatory approaches (weighted average, product, fuzzy aggregation methods, etc.) leading to overall score and ranking of the items weights are used as coefficients of exchange; incommensurability issue: e.g. 1 ton CO2 = x k1 kg of mercury emitted to water = y k2 m 3 of water withdrawn. (partially) Non-compensatory approaches (fuzzy aggregation methods, outranking matrices) only final ranking amongst items is provided weights are used as coefficients of importance; (partial) avoidance of the incommensurability issue. Examples of uncertainty factors to be applied, e.g. to the normalized results, are shown in Sala et al 2015 and Benini and Sala Table 4. Summary of weighting options developed for EF. Option Name Description 1 Flat weighting at the midpoints Use of the characterization table for ICs based on (Soares et al. 2006) and comparison on 15 ICs in one round. Only experts in LCA can be involved. It uses weighted average as aggregation method Weighting at the endpoints Hierarchical weighting at midpoint and endpoint Outranking matrix Use of mid-to-endpoint factors which lead to the calculation of 3 endpoint indicators, for each area of protection (human health, ecosystem quality, resources). Weights are elicited only for the endpoints and experts in LCA, EF stakeholders and public can be involved. It uses weighted average as aggregation method. Two step procedure, establishing one set of weighting factors on the midpoint ICs clustered per endpoint and one set of weighting factors on the 3 endpoints. The two sets of weighting factors are combined in an overall scheme. For the weighting at midpoint level, several options exist, amongst others inspired by Soares et al Experts in LCA, EF stakeholders and public can be involved. It uses weighted average as aggregation method. Use of the characterization table for ICs based on (Soares et al. 2006) and comparison on ICs clustered per endpoint. Experts in LCA, EF stakeholders and public can be involved. It uses a partially-compensatory method. A detailed description of each option is reported in Annex 5. In order to decide which option should be used for the calculation of the weighting factors for PEF, the four options have been tested against the set of criteria obtained from the Workshop on weighting organized by DG-ENV on 11 December The extensive results of this assessment can be find in Annex 6 and summarized graphically in Figure 2 and Figure 3. 16
21 Figure 2. Performance of weighting options 1 and 2 according to assessment criteria (the higher the score the better) Consistency with ILCD midpoint Inclusiveness/Plural ism of perspectives Transparency Computational demand Complexity in the interaction with stakeholders Stability Strong/weak sustainability Option 1: Flat weighting at the midpoint Option 2: Weighting at the endpoints Communica-bility of product performance Specificity by PEF product group Ability to include multiple forms of information Ability to include information on robustness Figure 3. Performance of weighting options 3 and 4 according to assessment criteria (the higher the score the better) Consistency with ILCD midpoint Inclusiveness/Plu ralism of perspectives Transparency Computational demand Stability Option 3: Hierarchical weighting at midpoint Complexity in the interaction with stakeholders 0 Strong/weak sustainability Option 4: Outranking matrix Communica-bility of product performance Specificity by PEF product group Ability to include multiple forms of information Ability to include information on robustness The assessment indicates that the proposed Option 3 fulfils a high number of assessment criteria and the selection to derive the weights for the LCA impact categories in the context of the EF can be justified as long as the implications of the use of importance coefficients as trade-offs in weighting is made clear to respondents and final users. Some important methodological features of option 3 are not desirable from a methodological perspective, e.g. in comparison to Option 4. However, Option 3 was selected also because of reasons of feasibility related to the information available from the EF pilots. 17
22 In details, option 3 was divided in three implementation sub-options (3.a, 3.b, and 3.c) according to the possible combinations of weighting on midpoint and endpoint levels. The three sub-options adopted are described in Table 5. Table 5. Summary of weighting sub-options developed for EF. Option 3.a Option 3.b Option 3.c General approach Questionnaire asking to assign points to impact categories Questionnaire asking to assign points to impact categories Evidence based approach on criteria inspired by Soares et al 2006 Target Questionnaire to public Questionnaire to LCA experts Expert check of the status of criteria inspired by Soares et al 2006 Midpoint Midpoint level weighting (grouped according to contribution to endpoints) Endpoint Endpoint level weighting (Natural Environment, Natural Resources, Human Health) Midpoint level weighting (grouped according to contribution to endpoints) Endpoint level weighting (Natural Environment, Natural Resources, Human Health) Spread of the impact, time span of generated impact, reversibility of impact and level of impact compared to planetary boundary to be scored by experts as basis for deriving weights on midpoint level Weighting of endpoints as additional criteria (severity of effects on human health, severity of effects on ecosystem quality, severity of effects on ecosystem quality) Integration of midpoint and endpoint Adjusting midpoint weighting according to weight assigned to endpoints Adjusting midpoint weighting according to weight assigned to endpoints Adjusting midpoint and endpoint weighting based on Soares criteria Options 3a and 3b are considered as pure panel-based approaches and implementation is supported by the London School of Economics and partners. Because of the characteristics of the method described in Soares et al., 2006, option 3.c can be considered as a hybrid evidence-based and expert-judgment approach. 18
23 3 Implementation of the defined options and calculation of weighting factors This chapter presents the calculation and the methodology underpinning the recommended weighting factors. In particular four steps have been included: i) development of the methodology and calculation of the weighting sets adopting a panel based approach, therefore following Options 3.a and 3.b; ii) development of the methodology and calculation of the weighting sets adopting a hybrid evidence-based and expert-judgement approach, therefore following Option 3.c; iii) definition of a procedure for the aggregation of the weighting sets from Options 3.a, 3.b and 3.c iv) development of the methodology and calculation of robustness factors for all considered impact category in order to differentiates results from categories with a more solid impact assessment All these steps are discussed in the following sections and the final recommended weighting factors are presented in chapter Methods for the calculation of WFs adopting a panel based approach (Options 3.a and 3.b) Two different target groups have been selected: the general population (lay respondents) and experts in the LCA field. Two questionnaires have been designed with similar issues but different in wording with the collaboration of the London School of Economics, Open Evidence and partners Target groups, sampling and geographical coverage The first target group has been accessed using an online panel to recruit a representative sample of 400 Internet users in each of the six selected countries aged 18 to 65+ years. The respondents have been invited to complete an on-line social survey of circa minutes. After replying to socio-demographics characteristics, respondents swing the weightings of the three end points. End-point number 1 gets 100 points and then participants have to rate the other 2 relatives to number 1. Then, in the second step, participants are asked to rank the mid-points of the top endpoint they selected in the first step. Following the same logic, the first mid-point gets 100 points and the others are rated relative to number 1. Lastly, respondents were asked to replay to battery of questions related to their environmental attitude. The second target group has been reached through using a convenience/snowball sample, selected from the wide network of experts in LCA that JRC has developed over the years. The fieldwork has been monitored on a daily based by project partners and at three reminders have been sent until the reaching of a sufficient number of respondents. The structure is similar to the one applied for lay respondents, in particular LCA experts start with questions on socio-demographics characteristics, than swing the weightings of the three end points. End-point number 1 gets 100 points and then participants have to rate the other 2 relatives to number 1. The second step comprises the ranking of the mid points. Participants have been randomly allocated to rank the mid-points of either Human Health or Ecosystem Quality. Following the same logic applied in the first, the first mid-point gets 100 points and the others are rated relative to number 1. After this exercise was performed, participants were also asked to weight the resources mid-points. In both cases participants were asked to rank their level of expertise in each mid-point. Lastly, respondents were asked to replay to battery of questions related to their environmental attitude. The full design of the questionnaires, as reported by the consortium led by the London School of Economics, is available in Annex 7. 19
24 Lay respondents A random sample of individuals was drawn from 6 countries (Germany, Italy, Spain, United Kingdom, Poland, France) to produce the general public survey (400 respondents per each of the 6 countries). The randomization was ensured at the country level, meaning that each country was equally represented in the survey. Gathering the data across countries made it possible to ensure the validity and possibility to generalise about awareness and understanding of the impact categories as well as about the broader environmental awareness. Table 6. Technical specification of samples for the online survey. Population General population. aged 18 to 65 years old 6 EU Member States: Scope Methodology Sample size Quotas Sampling error Weighting Sampling Online survey Germany Italy Spain UK Poland France n=2.400 (n=400 respondents per country) Age Gender Country 2.04% for overall data and 5.00% for country-specific data Weighting by country to be able to interpret the overall data Random with quotas As each country's total population is different, but is sampled in equal measure, weighting was applied to ensure a representative sample for interpretation of the overall data, i.e. for all the selected countries. The following shows the weighting applied by country. Table 7. Weights by country. Country Weight Germany 1.51 Spain 0.76 France 1.10 Italy 0.83 Poland 0.55 UK
25 LCA Experts The following tables show the technical specification for the LCA experts survey and the respondents by country and gender. Table 8. Technical specification for the LCA experts survey Population Scope Methodology Experts in LCA 48 countries Online survey Sample size n=518 Sampling Convenience/snowball sample Table 9. LCA Expert respondents by country and gender Country Female Male Total Country Female Male Total Argentina Iceland Australia India Austria Iran Belgium Japan Brazil Latvia Bulgaria Lithuania Chile Luxembourg Colombia Malaysia Czech Norway Canada Poland Spain Portugal China Romania Croatia Russian Cuba Slovenia Cyprus Sweden Germany Switzerland Denmark Thailand France Taiwan Finland Turkey Netherlands UK Greece USA Hungary Uzbekistan Ireland Vietnam Italy Hong Kong Others/Did not answer Total Survey results General public In the general public survey, the median score for human health is 100. This means that over half of respondents selected Human Health as the category of most concern. The average scores given to health, environment, and natural resources are 88, 73, and 67.3 respectively. Table 10. General Public Summary statistics Endpoints (n=2,400). Impact category (IC) Mean Median Standard deviation 4 In the following chapters, the number and naming of the midpoint impact categories is reported as used in the questionnaire and webinar, which was based on the ILCD recommendations from Changes to the final version occurred, for example there are now 16 impact categories (not 15) as resource use has been split into resources, minerals and metals and resources, fossils. 21
26 Human Health Natural Environment Natural Resources With regards to health midpoints, more than half of respondents picked Human Toxicity cancer as the most worrisome impact category, with a mean score of On average, Human Toxicity non-cancer and Climate change are the second and third highest ranking categories, with mean scores of 64.9 and 62.6 respectively. Table 11. General Public Summary statistics Midpoints (Human Health) (n=2,400). Impact category (IC) Mean Median Standard deviation Climate change Ozone depletion Human Toxicity - cancer Human Toxicity - non-cancer Particulate matter Ionizing radiation Photochemical ozone formation With regards to environmental midpoints, Climate Change is the category of most concern scoring 71.2 on average, followed by Eutrophication freshwater (mean 63.7) and Resource use water (mean 63.4). It is worth noting that the Climate change midpoint is featured in all three groups and is also the single category with the highest amount of variation, as measured by a standard deviation of 33.1 in Health, 32.4 in Environment, and 32.0 in Natural Resources. Table 12. General Public Summary statistics Midpoints (Natural Environment) (n=2,400). Impact category (IC) Mean Median Standard deviation Climate change Acidification Eutrophication - terrestrial Eutrophication - freshwater Eutrophication - marine Ecotoxicity - freshwater Land use Resource use - water The category Resource use fossils is the highest scoring midpoints among those in the Natural Resources group, with a mean of 80.4 among the general public. The second highest scoring midpoint is Climate Change (mean 70.0). Table 13. General Public Summary statistics Midpoints (Natural Resources) (n=2,400). Impact category (IC) Mean Median Standard deviation Resource use - water Resource use - metal and minerals Resource use - fossils Land use Climate change
27 LCA Experts In the LCA expert survey, findings differ as Natural Environment is the highest scoring endpoint (average of 87.3). The mean scores of Human Health and Natural Resources are 81.7 and 69.9 respectively. Table 14. LCA Experts Summary statistics Endpoints (n=519). Impact category (IC) Mean Median Standard deviation Human Health Natural Environment Natural Resources With regards to the health midpoints, results mirror the general public survey as Human toxicity cancer ranks first with an average of 81.1, followed by Particulate matter (79.0 on average) and Climate change (74.6 on average). Table 15. LCA Experts Summary statistics Midpoints (Human Health) (n=519). Impact category (IC) Mean Median Standard deviation Climate change Ozone depletion Human Toxicity - cancer Human Toxicity - non-cancer Particulate matter Ionizing radiation Photochemical ozone formation With regards to the environment midpoints, Climate change is by far the category of highest concern, with more than half respondents selecting it as first (median of 100) and a mean of Resource use water (mean 75.2), Ecotoxicity freshwater (mean 67.7) and Land use (mean 67.5) follow. Table 16. LCA Experts Summary statistics Midpoints (Natural Environment) (n=519). Impact category (IC) Mean Median Standard deviation Climate change Acidification Eutrophication - terrestrial Eutrophication - freshwater Eutrophication - marine Ecotoxicity - freshwater Land use Resource use - water Finally, Resource use water (mean 85.2) is the highest scoring midpoint in the Natural Resources group among LCA experts surveyed. The next most worrying categories are Climate change (mean 76.8) and Land use (73.9). Table 17. LCA Experts Summary statistics Midpoints (Natural Resources) (n=519). Impact category (IC) Mean Median Standard deviation Resource use - water Resource use - metal and minerals Resource use - fossils Land use Climate change
28 3.2 Methods for the calculation of WFs adopting a hybrid evidencebased and expert-judgement approach (Option 3.c) Option 3c builds upon the research described in Soares et al. (2006), but with significant differences. In particular, the approach adopted here is partially evidence-based and partially based on expert judgement in a four-step procedure described in the following section. The number of participants of the webinar and the list of contributors to the exercise are available in Annex 8. The experts were approached based on known track recorded in the field of environmental impact assessment, e.g. as editor in dedicated scientific, author of papers focusing journals but also as developer of LCIA methods Methods and expert participation Step 1. Criteria selection and definition in order to define the minimum number of significant parameters that can be used to describe an impact. An environmental impact can be described using several dimensions, such as the geographical scale, the time to occur and others. In this research five dimensions were considered sufficient to describe an impact and one or more corresponding criteria were associated. Table 18 presents the dimensions of the impacts and the criteria used for the assessment. Table 18. List of impact dimensions and associated criteria. Dimensions Geography Time Physical-chemical properties Magnitude Intensity Criteria associated (I) spread of the impact (II) time span of generated impact (III) reversibility of impact (IV) level of impact compared to planetary boundary (V) severity of effects on human health (VI) severity of effects on ecosystem quality (VII) severity of effects on ecosystem quality Each of the criteria is then organized in 6 levels of qualification according to the dimension that it referrers to. For the detailed description of the levels see Annex 9. Step 2. Assignment of a level for each criterion for the considered impact categories. This step is performed in two phases: in the first a preliminary assessment of the levels of each criterion are assigned based on evidences from the scientific literature and an revision made internally in the JRC LCA Team; in the second expert validated the proposed levels or suggested a change describing their opinion on personal researches or scientific literature. Step 3. Relative importance of each criterion given by expert judgment. Expert judgment is collected for the relative importance of each criterion in term of a score ranging from 0 (in case of no importance at all) to 100 (in case of maximum importance). Step 4. Calculation of the aggregated impact category weights (through a MCDA procedure). The combination of the above-mentioned criteria results in the final set of weighting factors to be applied. The full design of the method is described in Annex 9. In order to support the understanding of the calculation method and to elicit experts on pointing out references that can be useful to set the level of each criterion, two webinars have bene held, on the 28 th of February 2017 and on the 1 st of March Presentations used in the two webinars are available in Annex 10. During the webinar, after the presentation, an excel file, was provided to participants. In the following days the same excel file was given also to experts that declared their interests in supporting the exercise without attending the webinar. The number of compiled excel files (in total and for each considered impact category) is reported in Table
29 Table 19. Excel files received and impact categories evaluated for the weighting set. 28th February 1st March No webinar attended Excel file received Impact categories considered in the evaluation Climate change Ozone depletion Human toxicity, cancer effects Human toxicity, non-cancer effects Particulate matter/respiratory inorganics Ionizing radiation, human health Photochemical ozone formation, human health Acidification Eutrophication Land use Ecotoxicity freshwater Resource use, water Resource use, mineral and metals Resource use, fossils Total Input received Results on the level of each criteria (Step 2) In order to facilitate experts in defining the level of each criteria, a predefined level for each impact category for each criterion was set according to the literature available. Experts were invited to confirm or change the predefined level adding the supporting reference for their choice Results of the relative importance of each criterion (Step 3) The assessment of the relative importance of each criterion represents the most subjective component of the study as it is calculated according a direct expression of the panel of experts. After have assessed the level of each criterion for each impact categories, experts were asked to score the relative importance of each criterion from 1 (in case of very low importance) to 100 (in case of maximum importance). Experts could also insert the value 0 in case they think that the criterion should not be evaluated at all. Results are reported in Table 20 and Table 21 and summarized graphically in Figure 4. For none of the criteria is possible to assess a clear convergence of score, because all criteria presents a wide spread of values. Nevertheless, from Figure 4 it is possible to see that Reversibility, Effect on human health and Effect on ecosystem quality have the central 50% of values converging in the higher half, indicating a general higher consideration for such criteria. 25
30 Table 20. Results of scores associated to each criterion for each impact category according to experts views. Spread of impact Time span to generate an impact Reversibility Level of impact compared to planetary boundary Effect on human health Effect on ecosystem quality Effect on resources availability Climate change Ozone depletion Human toxicity, cancer effects Human toxicity, non-cancer effects Particulate matter/respiratory inorganics Ionizing radiation, human health Photochemical ozone formation, human health Acidification Eutrophication Land use Ecotoxicity freshwater Resource use, water Resource use, mineral and metals Resource use, fossils

31 Table 21. Results of the relative importance of each criterion (Step 3). Spread of impact Time span to generate an impact Reversibility Level of impact compared to planetary boundary Effect on human health Effect on ecosystem quality Effect on resources availability Average score Times as Min score Times as Max score Times a 0 value is assigned (32%) 21 (26%) 2 (2.44%) (30%) 13 (16%) 2 (2.44%) (16%) 35 (43%) 3 (3.66%) (34%) 26 (32%) 9 (10.98%) (15%) 39 (48%) 4 (4.88%) (15%) 30 (37%) 2 (2.44%) (34%) 10 (12%) 3 (3.66%) Figure 4. Results of the relative importance of each criterion (Step 3) as Box and Whiskers representation (the X is the average, the box contains 50% of the values, upper and lower whiskers are minimum and maximum values) The criterion Level of impact compared to planet boundary is the one with the bigger spread of the core 50% of the sample and it is also the one with the higher number of times in which the 0 values is associated. Considering the expert judgement on the relative importance of each criteria is possible to derive a direct weighting set of the considered criteria including endpoints (Table 22) and excluding endpoints (Table 23). Table 22. Weighting set derived from the relative importance of the criteria in relation to 100 (including endpoints). Criteria (including endpoints) Weighting set on the relative importance Spread of impact Time span of generated impact Reversibility of impact Level of impact compared to planetary boundary Severity of effect on human health Severity of effect on ecosystem quality Severity of effect on resources availability
32 Table 23. Weighting set derived from the relative importance of the criteria in relation to 100 (excluding endpoints). Criteria (excluding endpoints) Weighting set on the relative importance Spread of impact Time span of generated impact Reversibility of impact Level of impact compared to planetary boundary Different sets and ways to combine them From each of the calculation option a weighting set can be derived. Table 24 and Table 25 present the obtained weighting sets for the impact categories, with and without toxicity related categories. As just one weighting set should be considered as final it is important to define a way to aggregate them. As the three weighting sets arrive from different pools, they could be considered as equal; therefore each of them should contribute in an equal share (resulting in a 33:33:33 weighting). Nevertheless as option 3a and 3b have the same approach (which is different from option 3c) it is possible to consider the three sets as results from two models an apply a 50:50 weight of option 3a and 3b together and option 3c. The aggregated weighting sets for both approaches (33:33:33 and 50:50 weighting) are shown in Table 26 considering all ILCD impact categories and in Table 27 excluding toxicity-related impact categories. Table 24. Weighting sets calculated according to the three options, considering ILCD impact categories, including toxicity categories. Public (Option 3a) Experts (option 3b) Webinar (option 3c) Climate change Ozone depletion Human toxicity, cancer effects Human toxicity, non-cancer effects Particulate matter/respiratory inorganics Ionizing radiation, human health Photochemical ozone formation, human health Acidification Eutrophication terrestrial Eutrophication freshwater Eutrophication marine Ecotoxicity freshwater Land use Resource use, water Resource use, mineral and metals Resource use, fossils
33 Table 25. Weighting sets calculated according to the three options, excluding toxicity-related impact categories. Public (Option 3a) Experts (option 3b) Webinar (option 3c) Climate change Ozone depletion Particulate matter/respiratory inorganics Ionizing radiation, human health Photochemical ozone formation, human health Acidification Eutrophication terrestrial Eutrophication freshwater Eutrophication marine Land use Resource use, water Resource use, mineral and metals Resource use, fossils Table 26. Aggregated weighting sets (from sets in table 24) considering all impact categories. Aggregated set (50:50) Aggregated set (33:33:33) Climate change Ozone depletion Human toxicity, cancer effects Human toxicity, non-cancer effects Particulate matter/respiratory inorganics Ionizing radiation, human health Photochemical ozone formation, human health Acidification Eutrophication terrestrial Eutrophication freshwater Eutrophication marine Ecotoxicity freshwater Land use Resource use, water Resource use, mineral and metals Resource use, fossils
34 Table 27. Aggregated weighting sets (from sets in table 25), excluding toxicity-related impact categories. Aggregated set (50:50) Aggregated set (33:33:33) Climate change Ozone depletion Particulate matter/respiratory inorganics Ionizing radiation, human health Photochemical ozone formation, human health Acidification Eutrophication terrestrial Eutrophication freshwater Eutrophication marine Land use Resource use, water Resource use, mineral and metals Resource use, fossils
35 4 Accounting for robustness A critical parameter that should be included in a comparative assessment of the environmental performance of products and organisations is the reliability of the result for each impact category. In fact Soares et al asked the experts in their panel to assign a level of uncertainty for each impact category in order to differentiate results categories in which results are more robust, on which is more secure to relying on, from others. Impact categories that were seen as less robust, were discounted. A similar approach is suggested also for the EF. As the EF - as a LCA based relative method - does not deal with assessing safety margins or risks but does describe potential environmental impacts (and not actual impacts), it seen as meaningful that decisions are based more on the results of robust impact categories without entirely disregarding results coming from the less robust impact categories. This is to strike a balance between the robustness of the input provided to support the decision on the one hand and the aim to provide a comprehensive environmental assessment on the other hand. The inclusion of an evaluation of the robustness is usually considered as part of the interpretation of the results and performed a-posteriori. Nevertheless, in the context of comparing different products and organisations it might be important to highlight already in the results, which are the categories for which results are more robust in order to base decisions on more certain results. In practical terms for the weighting procedure, impact categories of which results are more certain, should have a higher weight compared to the results from impact categories that are less robust. As a consequence coefficient factors were developed to be associated to LCIA results (as suggested by Sala et al., 2015), including a qualitative evaluation of three parameters: Coverage completeness: Completeness of the dataset used for the normalisation inventory. Coverage estimate based on the extent to which the inventory data are available compared to available flows in ILCD for the specific impact category. Robustness of normalisation inventory: Based on data quality and robustness of input data for normalisation (e.g. based on statistical quality assured sources or on modelling emissions applying the extrapolation strategies) Robustness impact assessment: Robustness of the impact assessment methods, as assessed in ILCD evaluation of methods EC-JRC 2011 or in the revised LCIA recommendations for the Environmental Footprint (Sala et al 2017). Results of the assessment of the three parameters for all ILCD impact categories are shown in Table 28. Impact categories with robust results in all three parameters would be assigned a robustness factor of 1. This approach is chosen as in the EF context one of the core objectives is to achieve a level playing field when comparing the environmental performance of different products. To base the evaluation of products mainly on impact categories that may be driving the overall results after normalisation and weighting but have a low overall robustness is not seen as the best way to achieve this objective. To exclude impact categories with a low robustness (e.g. by assigning them a weight equal to 0) also is not seen as the best way to achieve this objective. Therefore a scale of transformation from qualitative to quantitative assessment should be adopted based on the relative importance of robustness. Two possible scales were considered: from score 1 in case of three level I in all three parameters to score 0.5 in case of three level III in all three parameters; from score 1 in case of three level I in all three parameters to score 0.1 in case of three level III in all three parameters 31
36 Table 28. Basis for robustness factors and uncertainty criteria of Soares et al (modified from: Sala et al 2015). Impact category Model Unit Normalisation inventory coverage completeness Normalisation inventory robustness LCIA method level of recommendation Climate change IPCC, 2013 kg CO2 eq II I I Ozone depletion World Meteorological Organisation (WMO), 1999 kg CFC-11 eq III II I Human toxicity, cancer USEtox (Rosenbaum et al., 2008) CTUh III III III/interim* Human toxicity, non-cancer USEtox (Rosenbaum et al., 2008) CTUh III III III/interim* Particulate matter Fantke et al., 2016 disease incidences I/II I /II I Ionising radiation Frischknecht et al., 2000 kbq U-235 eq. II III II Photochemical ozone formation Van Zelm et al., 2008, as applied in ReCiPe, 2008 kg NMVOC eq. III I/II II Acidification Posch et al., 2008 mol H+ eq II I/II II Eutrophication, terrestrial Posch et al., 2008 mol N eq II I/II II Eutrophication, freshwater Struijs et al., 2009 kg P eq II III II Eutrophication, marine Struijs et al., 2009 kg N eq II II/III II Land use Soil quality index (based on LANCA, Bos et al., 2016) pt II II III Ecotoxicity freshwater USEtox (Rosenbaum et al., 2008) CTUe III III III/interim* Water use AWARE 100 (based on Boulay et al., 2018) m 3 water eq of deprived water II II III Resource use (fossils) ADP fossils (van Oers et al., 2002) MJ I II III Resource use (mineral and metals) ADP ultimate reserve (van Oers et al., 2002) kg Sb eq I II III * During the EF pilots until mid-2017, the results for the impact category were seen as not sufficiently robust to be included in external communications or a weighting in the EF context before the robustness of the impact category was improved. 32
37 In particular each level of robustness was accounted according to Table 29. The final robustness factor for each impact category is calculated as the mathematical average of the scores in Normalisation inventory coverage completeness, Normalisation inventory robustness and LCIA method robustness for EF from Table 28. Table 29. Scores associated to the different levels of robustness in Table 28. Level of robustness Associated score in scale Associated score in scale I 1 1 I/II II II/III III III/interim* Resulting robustness factors from both scales are shown in Table 30. Using the second scale the results from very low robust impact categories are highly decreased. This could be useful to highlight even more the most robust categories but on the other hand it may be seen as contradicting the precautionary principle. Table 30. Robustness factors using a scale from 1 to 0.5 or a scale from 1 to 0.1. robustness factors scale robustness factors scale Climate change Ozone depletion Human toxicity, cancer Human toxicity, non-cancer Particulate matter Ionizing radiation Photochemical ozone formation Acidification Eutrophication, terrestrial Eutrophication, freshwater Eutrophication, marine Land use Ecotoxicity freshwater Water use Resource use (fossils) Resource use (mineral and metals) With the aim of a comprehensive assessment in mind, we recommend to use the scale from 1 to 0.5 to not to risk to overlook impact categories with a low robustness. 33
38 5 The overall recommendations for the EF weighting The recommended weighting set for EF includes weighing factors from all the three options (survey to public, survey to LCA experts, webinar with impact assessment experts) and weighted as two different models, therefore calculating a 50:50 contribution, and already including the robustness factors considering the scale from 1 to 0.1. The recommended weighting set, robustness factors and final weighting coefficients are reported in Table 31 for all impact categories and in Table 32 excluding toxicity-related impact categories Table 31. The recommended weighting set, robustness factors and final weighting factors for all midpoint impact categories, including toxicity categories. Aggregated weighting set Robustness factors Intermediate Coefficients Final weighting factors (incl. robustness) (A) (B) C=A*B C scaled to 100 Climate change Ozone depletion Human toxicity, cancer effects Human toxicity, non-cancer effects Particulate matter Ionizing radiation, HH Photochemical ozone formation, HH Acidification Eutrophication, terrestrial Eutrophication, freshwater Eutrophication, marine Ecotoxicity freshwater Land use Water use Resource use, mineral and metals Resource use, fossils Table 32. The recommended weighting set, robustness factors and final weighting factors excluding toxicity-related impact categories. Aggregated weighting set Robustness factors Intermediate Coefficients Final weighting factors (incl. robustness) (A) (B) C=A*B C scaled to 100 Climate change Ozone depletion Particulate matter Ionizing radiation, HH Photochemical ozone formation, HH Acidification Eutrophication, terrestrial Eutrophication, freshwater Eutrophication, marine Land use Water use Resource use, mineral and metals Resource use, fossils
39 5.1 Overview of developed weighting set for EF and previously available ones In the course of the process leading to the recommended weighting factors, there was a vivid discussion on alternative options seen as potential candidate for being adopted as reference set. Those directly available for the EF impact categories are reported in Table 33 and Table 34 to allow an overview of their main differences. In principle, they reflect the relative importance given to a certain category of impact compared to another, and they reflect different perspective that could be adopted when building weighting sets. Beyond the panel and expert based set underpinning the EF recommendations, the other sets are covering: The distance to EU 2020 policy targets. This set was developed by JRC with the aim of assessing the extent to which current EU policies at territorial level (such as e.g. the air quality directive or the water framework directive) could be reflected in relative importance of impact categories to be applied at product level. The resulting set is not very different from a 1:1:1 approach to weighting. The distance to science-based targets (planetary boundaries). There is a vivid debate in the LCA community on the need of addressing aspects related to absolute sustainability, namely moving the environmental assessment of product toward the integration of concepts related to limits (such as those posed by the planet ecological carrying capacity). Two sets are proposed in the table. The first is covering all the EF impact categories, resulting from the webinar where experts were asked about their judgment on the distance to planetary boundaries both in impact categories covered by the planetary boundaries estimates (e.g. those in Steffen et al 2015) as well as in impact categories in which an estimate is still missing (such as ecotoxicity). The second, is that proposed by Bjorn and Hauschild 2015, resulting from translating the planetary boundaries estimate in LCA applicable factors. Notwithstanding the relevance of further developing in future these kind of evaluation, the current set are still seen not mature enough for being recommended. Midpoint to endpoint weighting sets. The different EF midpoint impact categories are pointing towards the three main areas of protection (Human health, ecosystem health and Natural resources). However, the recommendation for life cycle impact assessment are not yet seen robust at the endpoint level and only midpoint models are proposed for EF. The basic idea behind the proposed midpoint to endpoint weighting set was to highlight the relative importance of midpoint indicators in light of their contribution to endpoint impact categories. Details of the proposed approach are in Annex 12. The two reported sets are proposals coming from experts involved in the pilots and their calculation principles were considered in the evaluation of the different sets for their possible contribution to the identification of a suitable set. In fact, in the webinar, questions were posed to experts in relation to the severity of impact categories towards the endpoints. Monetisation. Even if monetisation approaches are still considered in need of further refinements (e.g. by the UNEP-SETAC working group on normalisation and weighting, Pizzol et al 2016), an approach has been taken into account in this overview (Stepwise, based on Weidema et al 2009) which is the one able to cover an higher number of impact categories compared to other monetisation sets. The set of weighting factors assessed are reported in Annex 12 Climate change and land use often dominate the weighting sets. However, the different sets present differences in the way weights are distributed and in the range of the weighting coefficient and this, of course, may significantly affect the final comparison between two products. 35
40 Table 33. Overview of recommended Weighting factors with their relative importance compared with other developed or existing sets discussed during the development of this study. Set reported including toxicity impact categories. EF Impact Category Unit Global NFs recommended Aggregated weighting set (50:50 approach) (%) Final weighting factors (including robustness (%) Distance to policy target EU2020 (Castellani et al. 2016) (%) Planetary boundarie s resulting from the webinar (%) Planetary boundaries (Bjørn & Hauschild 2015) (%) Climate change kg CO2 eq. 5.35E Ozone depletion kg CFC-11 eq. 1.61E Human toxicity, cancer effects CTUh 2.66E na Human toxicity, non-cancer effects CTUh 3.27E na Particulate matter disease incidences 4.28E na Ionizing radiation, human health kbq U 235 eq. 2.04E na Photochemical ozone formation, human health kg NMVOC eq. 2.80E Acidification mol H + eq. 3.83E Eutrophication, terrestrial mol N eq. 1.22E Eutrophication, freshwater kg P eq. 5.06E Eutrophication, marine kg N eq. 1.95E Land use pt 1.98E Ecotoxicity freshwater CTUe 8.15E Water use m 3 water eq. 7.91E Resource use, fossils MJ 4.50E na Resource use, minerals and metals kg Sb eq. 3.99E na 5 This (unexpectedly high) value seems to be currently under investigation 36
41 Table 34. Overview of recommended Weighting factors with their relative importance compared with other developed or existing sets discussed during the development of this study. Set reported excluding toxicity impact categories. EF Impact Category Unit Global NFs recommended Aggregated weighting set (50:50 approach) (%) Final weighting factors (including robustness (%) Distance to policy target EU2020 (Castellani et al. 2016) (%) Planetary boundaries resulting from the webinar (%) Planetary boundaries (Bjørn & Hauschild 2015) (%) Climate change kg CO2 eq. 5.35E Ozone depletion kg CFC-11 eq. 1.61E Particulate matter disease incidences 4.28E na Ionizing radiation, human health kbq U235 eq. 2.04E na Photochemical ozone formation, human health kg NMVOC eq. 2.80E Acidification mol H+ eq. 3.83E Eutrophication, terrestrial mol N eq. 1.22E Eutrophication, freshwater kg P eq. 5.06E Eutrophication, marine kg N eq. 1.95E Land use pt 1.98E Water use m 3 water eq. 7.91E Resource use, fossils MJ 4.50E na Resource use, minerals and metals kg Sb eq. 3.99E na 37
42 References Ahlroth, S., G. Finnveden Ecovalue08 A new valuation set for environmental systems analysis tools. Journal of Cleaner Production 19: Bengtsson, M. and B. Steen Weighting in LCA approaches and applications. Environmental Progress & Sustainable Energy 19: Benini, L., Sala, S Uncertainty and sensitivity analysis of normalization factors to methodological assumptions. The International Journal of Life Cycle Assessment 21 (2): Bjørn, A., & Hauschild, M. Z Introducing carrying capacity-based normalisation in LCA: framework and development of references at midpoint level. The International Journal of Life Cycle Assessment, 20(7), Boardman, A. E., D. H. Greenberg, A. R. Vining, and D. L. Weimer Cost-Benefit Analysis, Concepts and Practice. Bos U., Horn R., Beck T., Lindner J.P., Fischer M LANCA - Characterisation Factors for Life Cycle Impact Assessment, Version 2.0, Fraunhofer Verlag, Stuttgart Boulay A.M., Bare J., Benini L., Berger M., Lathuillière M.J., Manzardo A., Margni M., Motoshita M., Núñez M., Pastor A.V., Ridoutt B., Oki T., Worbe S., Pfister S The WULCA consensus characterization model for water scarcity footprints: Assessing impacts of water consumption based on available water remaining (AWARE). The International Journal of Life Cycle Assessment 23(2): Castellani, V., Benini, L., Sala, S., Pant, R A distance-to-target weighting method for Europe The International Journal of Life Cycle Assessment, 21 (8): EC-JRC Recommendations based on existing environmental impact assessment models and factors for life cycle assessment in European context. Publications Office of the European Union. Luxembourg. Accessed on 4 October 2016 at: Recommendation-of-methods-for-LCIA-def.pdf. European Commission (EC). 2013a. Communication of the European Commission: Building the Single Market for Green Products Facilitating better information on the environmental performance of products and organisations (COM (2013) 196 final) EC. 2013b. Commission Recommendation of 9 April 2013 on the use of common methods to measure and communicate the life cycle environmental performance of products and organisations (Recommendation 2013/179/EU) EC Guidance for the implementation of the EU Product Environmental Footprint (PEF) during the Environmental Footprint (EF) pilot phase, Version 6.1. European Commission, Draft available in the PEF Wiki page: Fantke, P., Evans, J., Hodas, N., Apte, J., Jantunen, M., Jolliet, O., McKone, T.E Health impacts of fine particulate matter. In: Frischknecht, R., Jolliet, O. (Eds.), Global Guidance for Life Cycle Impact Assessment Indicators: Volume 1. UNEP/SETAC Life Cycle Initiative, Paris, pp Finnveden, G., Eldh P., Johansson J Weighting in LCA based on ecotaxes: Development of a mid-point method and experiences from case studies. International Journal of Life Cycle Assessment 11: Finnveden, G., Hauschild M. Z., Ekvall T., Guinée J., Heijungs R., Hellweg S., Koehler A., Pennington D., and Suh S Recent developments in Life Cycle Assessment. Journal of Environmental Management 91:1-21. Frischknecht, R., Braunschweig, A., Hofstetter P., Suter P Modelling human health effects of radioactive releases in Life Cycle Impact Assessment. Environmental Impact Assessment Review, 20 (2) pp Goedkoop, M., R. Heijungs, M. Huijbregts, A. De Schryver, J. Struijs, and R. van Zelm ReCiPe 2008 A life cycle impact assessment method which comprises harmonised category indicators at the midpoint and the endpoint level, First edition (version 1.08), Report I: Characterisation. PRE Consultants, Amersfoort, CML University of Leiden, RUN Radboud University Nijmegen, RIVM Bilthoven - Netherlands. Goedkoop, M. Spriensma R., The Eco-indicator 99 - A damage oriented method for Life Cycle Impact Assessment. Pre Consultants B.V., The Netherlands. 38
43 Hauschild, M. and J. Potting Spatial differentiation in Life Cycle impact assessment - The EDIP2003 methodology. Danish EPA, Environmental news No.80. Humbert, S OEF retail screening report in the context of the EU Organization Environmental Footprint Sector Rules (OEFSR) Pilots - section 3.7 Normalisation and weighting, and damage assessment. Huppes, G. and L. van Oers Background Review of Existing Weighting Approaches in Life Cycle Impact Assessment (LCIA). Publications Office of the European Union. Luxembourg. Accessed on 4 October 2016 at: Site/en_GB/-/EUR/ViewPublication-Start?PublicationKey=LBNA24997 Huppes, G., L. van Oers, U. Pretato, and D. W. Pennington Weighting environmental effects: Analytic survey with operational evaluation methods and a meta-method. The International Journal of Life Cycle Assessment 17: IPCC Myhre, G., D. Shindell, F.-M. Bréon, W. Collins, J. Fuglestvedt, J. Huang, D. Koch, J.-F. Lamarque, D. Lee, B. Mendoza, T. Nakajima, A. Robock, G. Stephens, T. Takemura and H. Zhang, 2013: Anthropogenic and Natural Radiative Forcing. In: Climate Change 2013: The Physical Science Basis. Contribution of Working Group I to the Fifth Assessment Report of the Intergovernmental Panel on Climate Change [Stocker, T.F., D. Qin, G.-K. Plattner, M. Tignor, S.K. Allen, J. Boschung, A. Nauels, Y. Xia, V. Bex and P.M. Midgley (eds.)]. Cambridge University Press, Cambridge, United Kingdom and New York, NY, USA. ISO ISO Environmental management Life cycle assessment Requirements and guidelines. International Standard Organization. ISO ISO Environmental management - Water footprint - Principles, requirements and guidelines. Page 33. International Standard Organization. Itsubo, N Weighting. In LCA Compendium The Complete World of Life Cycle Assessment. Hauschild MZ and Huijbregts MAJ Eds. pp Itsubo, N., K. Murakami, K. Kuriyama, K. Yoshida, K. Tokimatsu, and A. Inaba Development of weighting factors for G20 countries explore the difference in environmental awareness between developed and emerging countries. International Journal of Life Cycle Assessment. Itsubo, N., M. Sakagami, K. Kuriyama, and A. Inaba Statistical analysis for the development of national average weighting factors-visualization of the variability between each individual's environmental thoughts. The International Journal of Life Cycle Assessment 17: Itsubo, N., M. Sakagami, T. Washida, K. Kokubu, and A. Inaba Weighting across safeguard subjects for LCIA through the application of conjoint analysis. International Journal of Life Cycle Assessment 9: Johnsen, F. M., and Løkke, S Review of criteria for evaluating LCA weighting methods. The International Journal of Life Cycle Assessment, 18(4), Kägi, T., F. Dinkel, R. Frischknecht, S. Humbert, J. Lindberg, S. De Mester, T. Ponsioen, S. Sala, and U. W. Schenker Session Midpoint, endpoint or single score for decision-making? SETAC Europe 25th Annual Meeting, May 5th, The International Journal of Life Cycle Assessment 21: Myllyviita, T., A. Holma, R. Antikainen, K. Lähtinen, and P. Leskinen Assessing environmental impacts of biomass production chains application of life cycle assessment (LCA) and multi-criteria decision analysis (MCDA). Journal of Cleaner Production 29 30: Myllyviita, T., P. Leskinen, and J. Seppälä Impact of normalisation, elicitation technique and background information on panel weighting results in life cycle assessment. The International Journal of Life Cycle Assessment 19: Norris, G. A. and H. E. Marshall Multiattribute Decision Analysis Method for Evaluating Buildings and Building Systems. Building and Fire Research Laboratory, National Institute of Standards and Technology, Gaithersburg. Pennington, D. W., J. Potting, G. Finnveden, E. Lindeijer, O. Jolliet, T. Rydberg, and G. Rebitzer Life cycle assessment Part 2: Current impact assessment practice. Environment International 30:
44 Pizzol, M., A. Laurent, S. Sala, B. Weidema, F. Verones, and C. Koffler Normalisation and weighting in life cycle assessment: quo vadis? The International Journal of Life Cycle Assessment 22(6): Ponsioen, T.C., Goedkoop, M.J Midpoint weighting based on endpoint information, personal communication. Posch, M., Seppälä, J., Hettelingh, J.P., Johansson, M., Margni M., Jolliet, O. (2008). The role of atmospheric dispersion models and ecosystem sensitivity in the determination of characterisation factors for acidifying and eutrophying emissions in LCIA. International Journal of Life Cycle Assessment (13) pp Riabacke, M., M. Danielson, and L. Ekenberg State-of-the-Art Prescriptive Criteria Weight Elicitation. Advances in Decision Sciences 2012:24. Ridoutt, B., P. Fantke, S. Pfister, J. Bare, A.-M. Boulay, F. Cherubini, R. Frischknecht, M. Hauschild, S. Hellweg, A. Henderson, O. Jolliet, A. Levasseur, M. Margni, T. McKone, O. Michelsen, L. Milà i Canals, G. Page, R. Pant, M. Raugei, S. Sala, E. Saouter, F. Verones, and T. Wiedmann Making Sense of the Minefield of Footprint Indicators. Environmental Science & Technology 49: Rosenbaum, R.K., Bachmann, T.M., Gold, L.S., Huijbregts, M.A.J., Jolliet, O., Juraske, R., Köhler, A., Larsen, H.F., MacLeod, M., Margni, M., McKone, T.E., Payet, J., Schuhmacher, M., van de Meent, D., Hauschild, M.Z USEtox - The UNEP-SETAC toxicity model: recommended characterisation factors for human toxicity and freshwater ecotoxicity in Life Cycle Impact Assessment. International Journal of Life Cycle Assessment, 13(7): , 2008 Rowley, H. V., G. M. Peters, S. Lundie, and S. J. Moore Aggregating sustainability indicators: beyond the weighted sum. Journal of Environmental Management 111: Rüdenauer, I., C.-O. Gensch, R. Grießhammer, and D. Bunke Integrated Environmental and Economic Assessment of Products and Processes. Journal of Industrial Ecology 9: Saaty, T. L The Analytic Hierarchy Process. McGraw-Hill, New York. Sala, S., Benini, L., Mancini, L., Pant, R Integrated assessment of environmental impact of Europe in 2010: data sources and extrapolation strategies for calculating normalisation factors. The International Journal of Life Cycle Assessment, 20(11), Sala S, Benini L, Castellani V, Vidal Legaz B, Pant R., Environmental Footprint - Update of Life Cycle Impact Assessment methods: resource, water, land and particulate matter. EUR (28636) Luxembourg (Luxembourg): Publications Office of the European Union; ISBN doi ( /356756) Seppälä, J., L. Basson, and G. A. Norris Decision Analysis Frameworks for Life-Cycle Impact Assessment. Journal of Industrial Ecology 5: Soares, S. R., L. Toffoletto, and L. Deschênes Development of weighting factors in the context of LCIA. Journal of Cleaner Production 14: Steen, B. 1999a. A systematic approach to environmental strategies in product development (EPS). Version General system characteristics. Centre for Environmental Assessment of Products and Material Systems. Chalmers University of Technology, Technical Environmental Planning. Steen, B. 1999b. A systematic approach to environmental strategies in product development (EPS). Version Models and data of the default methods. Centre for Environmental Assessment of Products and Material Systems. Chalmers University of Technology, Technical Environmental Planning. Steffen, W., Richardson, K., Rockström, J., Cornell, S. E., Fetzer, I., Bennett, E. M.,... & Folke, C., Planetary boundaries: Guiding human development on a changing planet. Science, 347(6223), Struijs, J., Beusen, A., van Jaarsveld, H. and Huijbregts, M.A.J. (2009b). Aquatic Eutrophication. Chapter 6 in: Goedkoop, M., Heijungs, R., Huijbregts, M.A.J., De Schryver, A., Struijs, J., Van Zelm, R. (2009). ReCiPe 2008 A life cycle impact assessment method which comprises harmonised category indicators at the midpoint and the endpoint level. Report I: Characterisation factors, first edition Tervonen, T JSMAA: open source software for SMAA computations. International Journal of Systems Science 45: Van Oers L., de Koning A., Guinee J.B., Huppes G Abiotic Resource Depletion in LCA. Road and Hydraulic Engineering Institute, Ministry of Transport and Water, Amsterdam. 40
45 Van Zelm, R., Huijbregts, M.A.J., Den Hollander, H.A., Van Jaarsveld, H.A., Sauter, F.J., Struijs, J., Van Wijnen, H.J., Van de Meent, D European characterization factors for human health damage of PM10 and ozone in life cycle impact assessment. Atmospheric Environment 42, Weidema, B., M. Z. Hauschild, and O. Jolliet Preparing characterisation methods for endpoint impact assessment - Annex II of Eder P & Delgado L (eds.): "Environmental improvement potentials of meat and dairy products". Institute for Prospective Technological Studies, Sevilla. Weidema, B. P Using the budget constraint to monetarise impact assessment results. Ecological Economics 68: Weidema, B. P Comparing three life cycle impact assessment methods from an endpoint perspective. Journal of Industrial Ecology, 19(1): Weiss, M., M. Patel, H. Heilmeier, and S. Bringezu Applying distance-to-target weighing methodology to evaluate the environmental performance of bio-based energy, fuels, and materials. Resources, Conservation and Recycling 50: Whitmee, S., Haines, A., Beyrer, C., Boltz, F., Capon, A. G., de Souza Dias, B. F.,... & Horton, R Safeguarding human health in the Anthropocene epoch: report of The Rockefeller Foundation Lancet Commission on planetary health. The Lancet, 386(10007): World Meteorological Organisation (WMO) (1999). Scientific Assessment of Ozone Depletion: Global Ozone Research and Monitoring Project - Report No. 44, ISBN , Geneva. 41
46 List of Figures Figure 1. Overview and taxonomy of available weighting methods in LCA... 8 Figure 2. Performance of weighting options 1 and 2 according to assessment criteria (the higher the score the better)...17 Figure 3. Performance of weighting options 3 and 4 according to assessment criteria (the higher the score the better)...17 Figure 4. Results of the relative importance of each criterion (Step 3) expressed through Box & Wishers representation (the X is the average, the box contains 50% of the values, upper and lower wishers are minimum and maximum values)
47 List of Tables Table 1. Classification of weighting approaches and methods, modified from Pizzol et al Table 2. Criteria for the evaluation of weighting methods (from Pizzol et al. 2017) Table 3. Performance and use recommendation of weighting methods according to evaluation criteria from (Pizzol et al. 2017) and elaboration by EC-JRC (+ (good), o (medium), (poor) performance of weighting method on assessment criteria) Table 4. Summary of weighting options developed for EF Table 5. Summary of weighting sub-options developed for EF Table 6. Technical specification of samples for the online survey Table 7. Weights by country Table 8. Technical specification for the LCA experts survey...21 Table 9. LCA Expert respondents by country and gender...21 Table 10. General Public Summary statistics Endpoints (n=2,400) Table 11. General Public Summary statistics Midpoints (Human Health) (n=2,400) Table 12. General Public Summary statistics Midpoints (Natural Environment) (n=2,400) Table 13. General Public Summary statistics Midpoints (Natural Resources) (n=2,400) Table 14. LCA Experts Summary statistics Endpoints (n=519) Table 15. LCA Experts Summary statistics Midpoints (Human Health) (n=519) Table 16. LCA Experts Summary statistics Midpoints (Natural Environment) (n=519). 23 Table 17. LCA Experts Summary statistics Midpoints (Natural Resources) (n=519) Table 18. List of impact dimensions and associated criteria Table 19. Excel files received and impact categories evaluated for the weighting set Table 20. Results of scores associated to each criterion for each impact category according to experts views Table 21. Results of the relative importance of each criterion (Step 3) Table 22. Weighting set derived from the relative importance of the criteria in relation to 100 (including endpoints) Table 23. Weighting set derived from the relative importance of the criteria in relation to 100 (excluding endpoints) Table 24. Weighting sets calculated according to the three options, considering ILCD impact categories, including toxicity categories Table 25. Weighting sets calculated according to the three options, excluding toxicityrelated impact categories Table 26. Aggregated weighting sets (from sets in table 24) considering all impact categories...29 Table 27. Aggregated weighting sets (from sets in table 25), excluding toxicity-related impact categories Table 28. Basis for robustness factors and uncertainty criteria of Soares et al (modified from: Sala et al 2015) Table 29. Scores associated to the different levels of robustness in Table
48 Table 30. Robustness factors using a scale from 1 to 0.5 or a scale from 1 to Table 31. The recommended weighting set, robustness factors and final weighting factors for all midpoint impact categories, including toxicity categories Table 32. The recommended weighting set, robustness factors and final weighting factors excluding toxicity-related impact categories Table 33. Overview of recommended Weighting factors with their relative importance compared with other developed or existing sets discussed during the development of this study. Set reported including toxicity impact categories Table 34. Overview of recommended Weighting factors with their relative importance compared with other developed or existing sets discussed during the development of this study. Set reported excluding toxicity impact categories
49 Acronyms CFC Chlorofluorocarbons CTU Comparative toxic units DALY Disability adjusted life years EC-JRC European Commission, Joint Research Centre ILCD International Reference Life Cycle Data System NMVOC Non-methane volatile organic compound OEF Organisation Environmental Footprint PDF Potentially Disappeared Fraction of species PEF Product Environmental Footprint PM Particulate matter UNEP-SETAC life cycle initiative United Nations Environment Programme (UNEP) and the Society for Environmental Toxicology and Chemistry (SETAC) Life Cycle Initiative 45
50 Annexes Annex 1. Weighting tool In the course of the development of the deliverable, a weighting tool has been developed in order to enable the EF pilots to test different available option for weighting with their own results. The list of weighting sets included in the Weighting tool is reported in the table below. The weighting tool was made available via the DG ENV wiki page for the EF 6. Table A1.1. References of the methods compared in the weighting tool. Weighting approach Reference Distance to target, EU 2020 Castellani et al WFsA Distance to target, EU 2020 with target under discussion Castellani et al WFsB Distance to target EDIP EDIP 2003 Planetary boundaries Tuomisto et al Planetary boundaries Bjørn & Hauschild 2015 Midpoint to endpoint Ponsioen& Goedkoop 2015 Meta model (averaging available models) Huppes et al Soares et al Midpoint to endpoint based on: Ponsioen & Goedkoop 2015 Midpoint to endpoint based on: Humbert 2015 Monetisation based on: Weidema 2009 Monetisation ECOTAX 2002 (Pizzol et al. 2015) Monetisation ECOVALUE 08 (Pizzol et al 2015) Monetisation MAC/RCA (Pizzol et al. 2015) 6 under the subheading: "Other guidance; File name: Normalization and weighting factors for testing EC-JRC_v0.2.xlsx; uploaded January 8,
51 Annex 2. Distance to target method for Europe in 2020 Castellani, V., Benini, L., Sala, S., & Pant, R. (2016). A distance-to-target weighting method for Europe The International Journal of Life Cycle Assessment, 21(8), (Open Access) Distance-to-target (DTT) methods are weighting methods aimed at assessing the distance of an existing situation from a desired state (the target). Weighting factors in DTT methods could be based on calculation which is performed on normalisation factors (NFs) developed for life cycle assessment (LCA). At present, some DTT weighting sets have been developed. However, there is no DTT weighting set assessing the distance of EU domestic impacts from the desired state set by EU binding or non-binding policy targets (e.g., those related to the Climate and Energy Package and the Roadmap to a Resource Efficient Europe ). In the paper, a methodology to derive target references from policy-based targets in 2020 (TRs2020), both binding (A) and non-binding (B), is presented. Resulting target factors and DTT weighting factors were then compared to the current normalisation factors (based on 2010 normalisation references). The resulting weighting factor (WF) sets were presented and discussed in light of their use for decision support in policy and business contexts. We applied the WF sets to characterization results to an example (the EU energy mix process) aiming at illustrating key differences and effects on the results. The three reference sets (NRs2010, TRs2020A, and TRs2020B) show, in some impact categories, a relatively small difference. WFs referred to set A and set B result to be quite similar, with the only exception of water depletion impact category, for which a very relevant change is foreseen when considering the effect of the non-binding target of limiting the abstraction of water resource to 20 % of the available renewable water resources. This is mainly due to the higher difficulty in deriving quantitative targets from non-binding strategies and policies rather than from binding ones. The resulting weighting sets present strengths and limitations. The translation of policy targets into quantitative modifications to the baseline inventories appeared to be not a straightforward task, due to several reasons discussed in the paper (e.g., not all the policy targets are expressed in quantitative terms or can be translated into quantitative reductions and modifications of the elementary flows in the existing baseline inventories). Aiming at improving the effectiveness in supporting policies, further development of the methodology may be the integration with other DTT approaches such those based on carrying capacity, developed to integrate Earth s carrying capacity concept and planetary boundaries. The paper is published as open access and fully accessible at the following link: 47
52 Table A2.1 Normalisation references for year 2010 (NRs2010) and target references for year 2020 (TRs2020A applying binding targets and TRs2020B applying binding and non-binding targets) and related weighting factors (WFsA and WFsB) NRs2010 TRs2020A TRs2020B WFsA WFsB Climate change midpoint 4.60E E E Ozone depletion midpoint 1.08E E E Human toxicity midpoint, cancer effects Human toxicity midpoint, noncancer effects Particulate matter/respiratory inorganics midpoint Ionizing radiation midpoint, human health Photochemical ozone formation midpoint, human health 1.88E E E E E E E E E E E E E E E Acidification midpoint 2.36E E E Eutrophication terrestrial midpoint Eutrophication freshwater midpoint 8.76E E E E E E Eutrophication marine midpoint 8.44E E E Ecotoxicity freshwater midpoint 3.78E E E Land use midpoint 4.46E E E Resource depletion water, midpoint Resource depletion, mineral, fossils, and renewable, midpoint 4.06E E E E E E
53 Annex 3. Minutes of the weighting workshop in Brussels (November 2015) The workshop Environmental Footprint Weighting had multiple purposes: i) to get information on state-of-the art weighting methodologies, their critical appraisal focused on maturity and applicability and their current use within the LCA community; ii) to stimulate debate amongst experts and PEF pilots participants. It was not the objective of the workshop to take any decisions on a weighting set. The workshop was seen as crucial in order to acquire the knowledge basis on which to define further steps to be taken in the context of weighting within EF activities. The information gathered will also be analysed by the different Commission service when (after the pilot phase is concluded and the PEF/OEF methods will have been reviewed) the eventual use of PEF/OEF methods into existing or new policies is discussed. It was also clarified that the PEFCRs/OEFSRs developed within current the pilot phase will use the approach based on "expert judgement" for the identification of the most relevant impact categories and will not be affected by the outcomes of the workshop. In total 12 presentations were given. It is possible to group them according to the main object of the presentation: Description of a particular weighting methodology Analysis of the criteria for evaluating weighting methodologies and current use of such methods Description of a process towards the definition weighting factors, considering the context of application Type 1 presentations covered the following weighting methodologies: non-monetary panelbased (polls) (P. Saling); distance to planetary boundaries (A. Bjørn); distance to policy targets (S. Sala); monetization (M. Gama Caldas); fuzzy-logic (V. Kouloumpis); mid-toendpoint (M. Goedkoop). Type 2 presentations covered: criteria for the evaluation of monetary methods (M. Pizzol); criteria for the evaluation of weighting methods (F.M. Johnsen); survey of the use and perception of normalisation and weighting methods (M. Pizzol). Some of the type 1 presentations had also introduced relevant criteria for the evaluation of the weighting methodologies. Type 3 presentations focussed on the processes towards weighting sets (E. Eriksson and B. Steen), pointing out the fact that weighting and aggregation schemes are objective-dependent (e.g. benchmark) (F. Lupiáñez-Villanueva) and that step-wise approaches can be adopted (J.P. Ventère). The detailed program is provided in attachment. A discussion session was held after the presentations session. The discussion followed the following lines: What are the key requirements from the policy, the industry and the scientific perspective and what shall be covered in a weighting set within the EF context? Which weighting set(s) is preferred? Priority actions to be taken? What do we need to do next? As to be expected, different participants had different preferences. Some participants warned on aggregate indices as potential dictatorship and possibility to cheat as they are seen as lacking of transparency. Others asked whether we should not leave that all to consumers and NGOs. Many opinions were voiced on the value of developing a single score. Many statements were not in favour, while some pilots raised their voice on the need of several weighting sets to be tested in their supporting studies, including single score. Overall, none of the weighting methods available fulfils all the requirements mentioned in the workshop, and there was broad acceptance of the fact that all methods need normative assessments: there is no purely scientific value free solution. Some methods were seen as more mature than others for application at the ILCD midpoint recommended impact categories. All current monetization methods have limits at the midpoint level; planetary boundaries currently don t cover human-health related impact categories; policy targets are not based on global figures, part of the supply chain is disregarded; fuzzy logic methods 49
54 can be implemented at endpoint but not easily at the midpoint because of the large number of linguistic rules to be introduced; mid-to-endpoint methods add scientific information to the aggregation but still need further normative judgement to reach a single score; panelsbased methods suffer cognitive biases such as scale and framing. In order to reach a convention on the weighting factors to be used, the following methodological and procedural needs were discussed: need for clarification about the policy context of EF, including actual context of use and goal as well as reflections on benchmarking and communication; these aspects are connected to weighting; need for the identification of a procedure through which to reach a weighting set, including the definition of panels of experts and or stakeholders to be involved for this purpose, who can state preferences on the basis of hypothetical policy scenarios on EF implementation; need for the identification of the criteria for evaluating the weighting methods (a list of criteria mentioned during the workshop is reported in Annex I). What are the key requirements from the policy, the industry and the scientific perspective and what shall be covered in a weighting set within the EF context? The existence of multiple perspectives and different preferences is acknowledged by the participants. Therefore, some participants questioned whether it is good to have a single index and why it wouldn t work with a separate set of indicators; the example of nutrition is provided for similarity (i.e. all nutrients are needed). Some participants argued whether it wouldn t be better to leave the decision power in the hands of the consumers (i.e. letting them decide what they care about) or NGOs instead of imposing things (also considering the increased possibility of accessing information e.g. through smartphones capability in supporting purchasing choices). It was also argued that there are blind spots in the current set of impact categories (e.g. biodiversity) and that only when all information, including additional information, is on the table then it would be possible to derive a meaningful weighting set (comprehensiveness). One size-fits-all approach was seen by some as bound to fail due to the high uncertainties in weighting and the existence of pluralism. Not many contributions raised by participants during the workshop supported a single score approach. It was argued that leaving weighting open (i.e. not specifying weighting factors) would leave the door open to arrive at completely different interpretations based on the same data. The results of the weighting should be accepted by the recipients of the study. Weighting might also help in achieving greater accountability. Optimization towards 14 indicators is much more difficult than optimization towards 1 variable and this was seen as one of the reasons for success of single existing single issue approaches like carbon footprint. However, transparency in the methodology was seen as fundamental and that uncertainty must be part of the communication as well. The use of multiple tools (e.g. input/output, consequential LCA, etc.) could be useful to make uncertainty and sensitivity analysis more effective. From a pragmatic perspective it was argued that if no better weighting method is identified, the approach may be maintained (or expert knowledge within the pilots, for the time being); therefore, it would be beneficial to improve the current equal weighting approach. The procedure and who should be involved A participant argued whether a step-wise procedure shouldn t be adopted: first, seeking agreement on the selection of the main impact categories and secondly deciding on how to weighting them (maybe with 1-1-1), as anyway the EF is an approximation. This is proposed because finding consensus on weighting over 15 indicators (i.e. defining a universal system of weights) is a long-term process which cannot be obtained within the timeframe of EF. The proposed stepwise approach fits with a sectorial application of the EF. Along the same lines a participant argued that the selection should focus on the most 50
55 important impact categories, i.e. those that are important to society. It is responsibility of citizens, or consumers, with the help of experts. NGOs are to be included. It was commented however that if not all mandatory impact categories are included, those excluded are in fact weighed with 0. It was noted by a participant that in order to secure comparability between different product groups, there is a need to have the same impact categories. All data on all ICs should be made available; if impact categories are omitted then it might look like an attempt to hide something. For which purpose and in which context? Several participants posed the question about the purpose and the context of application of EF, stating that different weighting methodologies might better fit different goals. However, the need and added value of having different weighting methods was also questioned, even if serving different purposes. It was proposed that maybe for B2B communication weighting may not be needed. Another participant supported weighting for both B2B and B2C communications. The goal of EF is not clear, should it help consumers in making their life style more sustainable? Different weighting methods can be used in different circumstances; if it is for reducing overall impacts (e.g. for prioritizing purchase choices) then planetary boundaries approach would be ok as measure of absolute sustainability, else, if it is for deciding which is the product with lowest impact within a category of products that you want to consume anyway, other methods might be suitable as well. Which weighting set(s) is preferred? Operational instances: what to do now Several EF-pilots participants argued that, given the fact that a good solution matching all expectations is hard to be achieved in short term, the testing of multiple weighting methods would be very useful. It should be possible provided to the pilots in form of a table together with guidance given the fact that there aren t resources available for them to invest on the methodological development of weighting. Some pilots members reported that the development of a new weighting and testing would be difficult in the time frame of the EF. The Commission re-iterated that the pilots were invited to test alternative weighting methods. Methodological instances: what is relevant to consider Some participants recommended that tested method should also include something on biodiversity and renewability. Others stated preferences on methods pointing at the real damage due to a product, asking for their inclusion in testing. Others stressed importance on the concept of reversibility, which should be in included in carry capacity concept somehow. A clear request for inclusion of damage-based methodologies (mid-to-endpoint) and planetary boundary was made, together with considerations on the importance of the impacts. Along these lines a combination of approaches developed by Soares et al was briefly presented by the EC-JRC. The method combines following aspects: scale, duration, distance to target, reversibility, natural resources, ecosystem health, human health, uncertainty. A similar approach could be developed and tested (i.e. taking the advantageous aspects of all methods). A weighting approach based on the grouping or ranking of impact categories was recommended for consideration as well. Normalisation is part of the picture as well, as the decision about weighting might depend on normalisation. Some participants argued that it would be better to discuss and seek for agreement on the criteria that the weighting systems should fulfill in order to be acceptable instead of trying to vote on specific methods. An expert panel discussing about reversibility of impacts was mentioned as a viable strategy. 51
56 It was stated that uncertainty has to be addressed somehow, as the underlying impact categories can be more uncertain than the weighting itself. High uncertainty doesn t limit the use of some methods according to survey s results. Procedural instances: how to get there There will be one method used, therefore it is crucial to look at the process on how to get there. Panels Weighting is about social attitudes, different stakeholders should have a say. Explore different panels (politicians, consumers, scientists) and weight them. Suggestions: stakeholders discussion (panel) on which criteria to select for evaluating weighting methods; expert panel discussing about reversibility of impacts. If weighting coming up from panel consultations leads to unexpected results and stakeholders consultation cannot be done again, there might be a concrete risk that empty solutions would occur. Better to have a multiple number of weighting schemes instead of one. Some participants argued that the policy context of EF applications is important for making a decision within the panels, if defined it can help in finding a convention. It was not clarified why the methodology for weighting should change on the basis of its purpose. Suggestion: It could be asked to the panels to imagine different policy contexts so to get preferences. Proactive stakeholders I was suggested by a participant to leave it open to EF participants/stakeholders to coming up with ideas about type of communications useful in specific contexts and not having a prescriptive one for all contexts. Also in relation to the statement that many impact categories would not meet quality requirements and LCIA models can be more uncertain than the weighting. Overall procedure Suggested procedure by a participant: 1. selection of a set of weighting methods; 2. evaluation against criteria; 3. gathering of stakeholders for selecting weighting methods to be recommended for use within EF pilots Conclusion: Priority actions to be taken? Some participants warned on single numbers as potential dictatorship and possibility to cheat. Other asks should we not leave that all to NGOs,while some pilots raised the needs for clear weighting sets to test. Many opinions - not necessarily agreeing - over the value of having a single score. Next step: a list of weighting methods that were discussed today could be prepared in clear tables, with the preference for damage based approach, monetization and planetary boundaries. Can we identify already indicative preferences for a certain approach? Preferences observed among participants on weighting methods ( show of hands ) Monetisation: 12 52
57 Panel based: 6 End point / damage based approach: 6 / 20 Distance to target: policy targets 3, planetary boundaries: 20 Next steps Short-term vs long-term: 1) quick solution for use within the pilots, simple guidance on that; 2) mid-term tailored strategy/process towards a weighting set, through the establishment of a working group on weighting. Short-term EC-JRC commitment: Development and circulation of a set of weighting factors based on the ILCD recommended midterm impact categories and indicators before Christmas 2015, at least covering: damage-oriented methods and planetary boundaries (potentially with some limitations). Monetization approaches (e.g. EPS2000, STEPWISE), will have to be dealt with separately, as it did not seem feasible to link them to the ILCD midpoint categories. Mid-term Creation of a Working Group on weighting from volunteers was proposed, e.g. supporting the identification of criteria for the evaluation of weighting methods. No decision was taken. The creation, scope, mandate, and guidance for such a working group was left open. Proposed participants during the workshop included: Kim Christiansen, Bernard De Caevel, Mark Goedkoop, Elin Eriksson, EC-JRC. To be clarified is the intention (or not) of involvement of Bengt Steen, who broad the proposal on the table to base this project on the work of UNCCE. The commission will communicate after the workshop how it sees its possible involvement. 53
58 AGENDA Environmental Footprint Weighting Workshop MONDAY 16TH NOVEMBER 2015 Centre Albert Borschette (CCAB), Room AB 1A, 36 Rue Froissart, 1040 Brussels : Opening of the workshop: setting the scene (Moderator: An De Schryver) The workshop starts with an opening of the European Commission, indicating what questions we want to answer, which problem we want to tackle and which goals we want to reach : A deep dive (Moderator: Serenella Sala) 1. Elin Eriksson (IVL) and Bengt Steen (Chalmers): Weighting in PEF: Why, when and how? Suggestions for a procedure (20min) 2. Massimo Pizzol (The Danish Centre for Environmental Assessment): Monetary valuation in LCA: a review and assessment of methods and applications (video conference) (20min) 3. Peter Saling (BASF): Normalization and weighting requirements for a meaningful interpretation of LCA (20min) : Break 1. Tommie Ponsioen (PRé consultants): Midpoint to endpoint as weighting (15min) 2. Anders Bjørn (DTU): Using planetary boundaries and carrying capacity as references of environmental sustainability in LCA: A sound way of arriving at a single score (15 min) 3. Viktor Kouloumpis (University of Manchester): The use of fuzzy logic for weighting schemes in LCA (video conference) (15min) : Lunch break : Practical application of weighting: What do we need? (Moderator: An De Schryver) 1. Jean-Paul Ventère (Ministry of ecology, sust. Develop. France): How to aggregate multiple indicators : ideas and reflections (20min) 2. Gama Caldas Miguel (JRC-SEVILLA): Monetisation of environmental impacts for Product Policy Support (20min) 3. Serenella Sala (JRC-ISPRA): Distance to target applied to ILCD (20min) Coffee break: Francisco Lupiáñez-Villanueva (Open Evidence/Open University of Catalonia): PROS and CONS of compound indicators and weighting (20 min) 2. Johnsen (Aalborg University): Criteria for the evaluation of weighting methods (20min) 3. Massimo Pizzol (UNEP/SETAC flagship): A public survey on normalisation and weighting (video conference) (10 min) : Discussion session: The right answer on the right question (Moderator: Mark Goedkoop) 54
59 Annex 4. Materials on the evaluation of weighting methods Table A4.1 Full List of criteria used for comparing classes of methods based on normalisation and (simple additive) weighting, based on the list of criteria developed by Pizzol et al 2016 Main- Criteria Scientific foundation Documentation Completeness Research question Sub-Criteria What is the science behind the development of the method? Does the documentation allow understanding and reproducing the method? Scientific robustness and inherent consistency Peer-review and publication of model Reflection of state-of-the-art knowledge on monetary valuation Possibility for consistent improvement to reflect geographical and temporal differentiations Clear and unequivocal identification of the objectives, underlying hypothesis, analytical approach (e.g. top-down vs. bottom-up), and principles Timeframe consideration and representation by a robust and justified discount rate Provision of monetary valuation values covering a significant number of inventory and/or impact flows Distinction between marginal and average data Robustness of monetary valuation factors Ability to take into account budget constraint Hysteresis (providing equal scores for cost or benefit of the same impact, whether increasing or decreasing) Independence of estimate from causality (what or who caused the damage), fairness, responsibility, payment medium, risk-averse/-taking behaviour. Publication and accessibility (how much effort is needed to retrieve the method-documentation? Is the method available free of charge? Is the method available online?) of the model of the model documentation of set of characterization factors of input data Transparency of algorithms data factors documentation Ability to be reproduced and extended by third parties Explicit statement of value choices Extensive coverage of biophysical and social impacts/externalities What is its overall Inclusion of positive and negative externalities scientific relevance of Validity across cultures and relevant to different decision-making contexts (business strategy, public policy, cost the method? calculations / risk assessment / internalisation)? Ability to be applied to site specific contexts 55
60 Main- Criteria Uncertainty Complexity Relevance to / compatibility with LCA Research question Sub-Criteria How are the uncertainties of the method addressed and described? What knowledge is required to apply the method in practice? What is the relation between the method and LCA, and its potential for application in LCA? Ability to capture abstract levels of values and be applied in non-specific contexts Extensive coverage by monetary valuation factors of the mechanisms and elementary flows for: Area of Protection Human Health Area of Protection Natural Environment Area of Protection Natural Resources Closeness between object of monetary valuation and intrinsically valuable safeguard subjects Spatial and temporal differentiation (A= values provided for several space/time options; C= generic; D= site/time specific) Global scope (geographically) Avoidance of double counting Identification of the principal unknowns in the theoretical structure of the monetary valuation method and of the main assumptions and choices, e.g. choice of time horizon (Modelling Uncertainty) Explicit statement of the uncertainty associated with the final results, e.g., in terms of standard deviation, range of values, order of magnitude (Quantitative uncertainty) Identification of the parameters of the model that have the highest influence on the final results (Sensitivity analysis) Identification of the method used for the analysis of uncertainties, e.g. Monte Carlo simulation, others (Uncertainty analysis) High accuracy (under/over-estimation) High precision Provision, justification and reporting in statistical terms of uncertainty estimates Explicit address of scenario, model, substance and parameter uncertainty Level of background scientific knowledge (trans-disciplinary, cross-disciplinary) (A = High, D = Low amount of knowledge) Technical support required for the performance of the monetary valuation method, in order to arrive at new or updated monetary valuation values, such as: dedicated software mathematical models databases General amount of data/information required Degree to which it has been adapted to LCA Potential for application in LCA Sound justification of the monetary valuation of flows, impacts and Areas of Protection Compatibility of nomenclature with flows in main LCA databases (e.g. ecoinvent, ELCD) Ability to be updated for conformity with, e.g.. ILCD nomenclature and units Ease of application of already generated monetary valuation values by practitioners and in common LCA tools 56
61 Table A4.2 Recommendations on weighting approaches as from Pizzol et al. (2016), Mid-to-endpoint and meta models approaches, in Italic, have been added by EC-JRC Final recommendation by Weighting model Weighting UNEP/SETAC (Pizzol et al., selected for PROS CONS methods 2016) and additions from ECconsideration JRC Normative targets EU policy targets (Castellani et al., 2016b) Planetary Boundaries (Bjorn and Hauschild, 2015; Tuomisto et al., 2012) Recommended if weighting between targets is included, or the lack of this is explicitly mentioned; recommended for midpoint only Stakeholders panel Huppes et al. (2012) Recommended for midpoint/endpoint, if information on panel composition and criteria for selection is provided Experts Panel Soares et al. (2006) Recommended for midpoint/endpoint, if information on panel composition and criteria for panel selection is explicitly provided Observed preferences none Not recommended and if applied, recommended for midpoint only Linked to thresholds/targets defined through a consultation process, based of scientific outcomes, as well as on stakeholders and policy makers interactions While each planetary boundary / policy target has a clear meaning, their combined use as tradeoff coefficients in simple average weighted raises issues on compensability. i.e. does it have the same effect to overcome the planetary boundaries on climate change and those of nitrogen fixation? highly participatory Usually, stakeholders panels provide weights in form of coefficients of importance rather than tradeoffs. Therefore their use as in a fully compensatory framework like normalisation and weighting is inconsistent, unless tradeoffs are explicitly elicited from stakeholders preferences Inclusion of expert viewpoints on specific environmental aspects Market price. It reflects an existing market (Pizzol et al., 2015). Prices are used Although expert knowledge can be a viable source of information, it is difficult that every single individual expert has knowledge vast enough to master the cause-effect mechanisms underlying all the selected impact category indicators, their implication and their compensability. If expert knowledge is elicited leads to the elicitation of weights as coefficients of importance, then the same issues observed for stakeholders panels apply to experts panels as well Applicable to market goods only 57
62 Weighting methods Revealed preferences Weighting selected consideration model for ECOTAX2002 (Finnveden et al., 2006) Stated Preferences ECOVALUE08 (Ahlroth and Finnveden, 2011) Final recommendation by UNEP/SETAC (Pizzol et al., 2016) and additions from EC- JRC Not recommended in general, if applied recommended for midpoint only Recommended for endpoint only. Weights derived via choice experiment recommended over weights derived via contingent valuation (the former has higher consistency) Abatement cost MAC/RCA (Steen 1999) Not explicitly discudded in UNEP/SETAC recommendations Equal weighting none Recommended for midpoint/endpoint, if explicit statement is provided that no PROS as weights i.e. as coefficients of trade-offs by definition Ease of communication as it provides monetary units. Based on the averting behaviour approach. It observes actual behaviour, it accounts only for use value (Pizzol et al., 2015). weights are used in form of tradeoff Ease of communication as it provides monetary units; weights are elicited and used in form of tradeoff Based on an intuitive concept, normally used to assess policy targets. It is related to real costs occurring for specific interventions. none CONS Difficult to isolate averting behaviour from other varaibles; secondary benefits are not taken into account by this method (Pizzol et al., 2015) Uncertainty characterizing choice experiments are very high; the way tests are conducted can influence the results. Distributional aspects are seldom tackled. Gaps between stated preferences and actual behavior. Ethical implications on the value of e.g. human life. In case of contingent valuation is instead based on extrapolations from context-specific problems. Doesn t value utility losses (damages), or only partly (Pizzol et al., 2015). Difficult to use them in combination with impact categories, as they refer to interventions rather than characterized results Although it appears to be a fair choice as all indicators get the same weight, in reality it introduces weights defined as coefficients of importance (i.e. all indicators have the same importance), 58
63 Weighting methods Weighting selected consideration model for Final recommendation by UNEP/SETAC (Pizzol et al., 2016) and additions from EC- JRC weighting is really applied by the analyst Footprinting none Recommended for midpoint/endpoint, if explicit statement of implicit weighting is provided and motivations for selecting/excluding the categories are provided Mid-to-endpoint * Mid-to-endpoint based on EU27 normalisation references (Ponsioen and Goedkoop, 2015) Average factors based on ReCiPe (Ponsioen and Goedkoop, 2015) Average factors based on Impact World+ (Humbert, 2015) Average factors based on Weidema et al. (2009) Not recommended if robust endpoint methods are available for use. In specific circumstances can be recommended for transforming midpoint into endpoint assessments, only if the errors introduced by such simplification is proven being low in comparison to full endpoint modelling. Meta-models * none They carry all the uncertainties and limitations of the underlying weighting methods. Recommended to midpoint/endpoint if information on the weighting amongst weighting methods is provided and units are coherently addressed PROS Simple to communicate If normalisation is not used then they Adoption of multiple perspectives CONS instead they introduce coefficients of tradeoffs, which are not based on any form of evidence. Multi-dimensionality is lost The uncertainty underlying endpoint modelling is, in general, higher than uncertainty associated to midpoint modelling. Some endpoint indicators are badly framed (i.e. probability of disappeared species fraction. Which species? All have the same relevance/importance?) The use of proxy mid-to-endpoint factors additionally reduces the accuracy of the outcome. If implemented as simple average weighted across selected weighting methods then it leads to full compensability across the mixing of weighting factors, which are based on different rationales. The way different perspectives are weighted is generally not discussed and assumed to be
64 Annex 5. Options developed for weighting of impact categories A5.1. Option 1 Flat weighting at the midpoint Description: this option foresees the use of all 15 impact categories in one single elicitation table. There will firstly be a characterization table following the approach described in (Soares et al. 2006), based on the state of the art information for each impact category regarding scale, reversibility, duration and distance to target of the impacts, as well as the uncertainty of the models. The core of the elicitation process can be based on an adaptation of SMART and SWING elicitation methods (Riabacke et al. 2012): 100 points are allocated to the most important impact categories and proportions are assigned to the others according to their relative importance with respect to the most important one. Input needed from: Relevant experts in the field of each impact category, with knowledge on the EU/global current situation Drawbacks: Upsides Outputs: Large set of comparisons "in one go": Risk of difficulties in judgments from the respondents as the comparisons are to be performed 14 times with reference to the same most important criterion; It would be very challenging to elicit preferences from the public as the knowledge and understanding of the public the 15 midpoints is limited. Most scientific approach that integrates experts' opinion with technical stakeholders involved in the EF. It does not need to be based on the modelling from midpoint to endpoints. It can provide a single score as main output. Normalisation is necessary and it requires careful selection and analysis of implications on the final results (see (Myllyviita et al. 2012, Myllyviita et al. 2014)) In order to use this method, the proposal is to normalize the LCIA results of each product category pilot study against a reference. In this case the selected reference is Global normalisation factors as developed by the JRC. It has to be noted that currently normalisation values have their limitations in the coverage of relevant environmental flows, especially on a global scale. The 3 most contributing impact categories can be identified for each of the product groups by selecting those impact categories contributing the most to the single score. This option allows performing the contribution analysis for each of the 15 impact category indicators separately as well as on the single score. Classes of environmental performance could be in principle calculated on the basis of the single score and the spread around representative product C, for each of the product groups. A5.2 Option 2 - Weighting at endpoints Description: this option foresees the use of mid-to-endpoint factors as suggested by (Weidema 2009) Humbert, 2015; Ponsioen and Goedkoop, 2015) for translating midpoint characterized results into 3 endpoint indicators, one for each area of protection. Then, the results of the 3 AoPs indicators are weighted according to the elicitation from PEF/OEF stakeholders through elicitation techniques, similarly to what develop by (Itsubo et al. 2015) on the basis of utility theory. The results are obtained in form of coefficients of exchange by assuming that utility if a linear function of the 3 AoP indicators. The definition of the classes of performance (from A to E) can be developed on the basis of the 60
65 single score and the spread around representative product, defined as class C, for each of the product groups. Input needed from: Experts in the field of each impact category, EF stakeholders and the general public Drawbacks: Upsides Outputs: The EC recommended the use of midpoint characterization models instead of endpoint characterization models because of the supposedly lower uncertainty and higher maturity of the former. This weighting method attempts to translate midpoint impact indicators results into endpoint indicators, by means of proxy characterization factors derived on the basis of those endpoint models that are considered in the ILCD handbook (EC-JRC 2011) as too uncertain for being recommended. Relatively simple procedure which provides a platform to allow EF stakeholders and general public to express their views and derive weights for endpoints Normalisation is avoided. The procedure described above provides a single score as main output, representing the average utility associated with the environmental impacts generated to produce a product. The 3 most contributing impact categories can be identified for each of the product groups by selecting those ILCD impact categories contributing the most to the single score. This option allows performing the contribution analysis for each of the 15 impact category indicators separately as well as on the single score. Classes of environmental performance could be in principle calculated on the basis of the single score and the spread around representative product C, for each of the product groups. A5.3 Option 3 Hierarchical weighting at the midpoint Description: this option tackles the drawbacks of the previous options and combines them to reduce the preference elicitation burden on the experts as well as to include the general public and non LCA-experts from EF stakeholders. The structure builds upon the hierarchical endpoint and midpoint correspondence (Table A5.1). 61
66 Table A5.1. Hierarchical structure of LCA impact categories for Option 3 Endpoint Midpoint Climate change Ozone depletion Human Health Natural Environment Natural Resources Human toxicity, cancer effects Human toxicity, non-cancer effects Ionizing radiation, human health Particulate matter/respiratory inorganics Photochemical ozone formation, human health Acidification Climate change Ecotoxicity freshwater Eutrophication terrestrial Eutrophication freshwater Eutrophication marine Land use Resource use: water Climate change Land use Resource use: water Resource use: metals and minerals Resource use: fossils This option can be divided into two steps, one covering the midpoint level and one the endpoint level (detailed description available in Section 4): Step 1 weighting on midpoint impact categories: A description of the midpoint ICs will be provided separately for the impact categories relevant for each endpoint. This will lead to three descriptions one for the midpoints related to human health, one for the midpoints related to natural environment and one for the midpoints related to natural resources. The core of the elicitation process can be the similar as for option 1 but questionnaires will relate to a selection of midpoints that contribute to the same endpoint and not with respect to the whole set of 15 ICs in one approach, which makes the elicitation process easier to handle and more robust. Instead of using questionnaires, this step can also be based on webinars or workshops to share and gather more details information from experts related to the scoring of criteria used by Soares et al Input needed from: Experts in the field of each impact category, EF stakeholders and the general public. Step 2 weighting on endpoint categories: The core of the elicitation process can be based on an adaptation of SMART and SWING elicitation methods (Riabacke et al. 2012): 100 points are allocated to the most important endpoint and proportions are assigned to the others according to their relative importance with respect to the most important one. Another possibility is to use the analytical hierarchy process (AHP) (Saaty 1980), so that consistency checks can be performed to assess whether the respondents were consistent with their judgments. 62
67 The input from step 1 and 2 are then combined to derive final set of weights on midpoints Input needed from: Experts in the field of each impact category, EF stakeholders and the general public. Drawbacks: Upsides Outputs: Inconsistencies in judgments cannot be evaluated at the midpoint level as the use of an AHP procedure would require a high number of comparisons and make it unpractical (i.e. more than 200 in total); Requires to look into development of meaningful scenarios with consistency check using SMART/AHP weights methodology. Most scientific approach that integrates experts' opinion with stakeholders involved in the EF; The public can also express their views and influence the derivation of weights for midpoints too. Can provide a single score as main output. Normalisation is necessary and it requires careful selection and analysis of implications on the final results (see (Myllyviita et al. 2012, Myllyviita et al. 2014)) The 3 most contributing impact categories can be identified for each of the product groups by selecting those impact categories contributing the most to the single score. This option allows performing the contribution analysis for each of the 15 ILCD impact category indicators separately as well as on the single score. Classes of environmental performance could be in principle calculated on the basis of the single score and the spread around representative product C, for each of the product groups. Please note: all the options proposed above imply the acceptance of substitution between impact categories / areas of protection, which means that the decrease in quality for one of them (e.g. higher GHG emissions) can be compensated by the improvement on another one (e.g. lower ozone depletion). The implication is that impact category indicators are compared by using the same metric. This implies that, for instance, x kg of CO2 eq can be exchanged with y m 3 eq of water scarcity or with k CTUh of Toxicity - human cancer. The weights are elicited as coefficients of importance specific of the impact category and not of the specific indicator used to measure an impact, as points are allocated regardless of the scale of measurement that is used for quantifying midpoint indicators. Therefore, their use in a compensatory framework to derive a set of weighting factors can be questioned from a methodological standpoint, as no questions related to the compensability of these aspects is posed to the experts participating in survey. This is due to the lack of the possibility of using the range of the scale of the ICs. It has to be noted that the foreseen aggregation approach for Option 1-3 is the weighted average, while the weights would be coefficients of importance. The use of weights as importance coefficients instead of coefficients of exchange (trade-offs) into the weighted sum approach has methodological downsides. A5.4 Option 4 - Outranking matrix Description: Step 1: same procedure for weights elicitation as for Option 3. 63
68 All the options presented above are based on the use of a compensatory aggregation approach, which is the weighted average. This implies that compensation between ICs is accepted and consequently the performance among the ICs can be exchanged. However, there is no scientific basis to justify the acceptance for the decrease of impact in one IC that compensate for the increase in another one. Furthermore, Option 1 and 3 rely on normalisation factors that aim to make the ICs comparable, though this choice can severely affect the results and drive them too (Myllyviita et al. 2014). Step 2. Attribution to a class of environmental performance. The classes of environmental performance (from A to E) must be defined for each of the impact categories, ideally as defined in the issue paper: Determining the EF benchmark and performance classes, for each of the product groups. Once the benchmarks defining the classes are identified then the Stochastic Multi-criteria Acceptability Analysis (SMAA) is recommended as procedure to be applied for the classification of a product into a class of environmental performance. For this, benchmarks (at least the boundaries of class C) by impact category and by product group are required as input. The EC-JRC would recommend the use of the JSMAA software (Tervonen 2014) which is freely available and licensed under open source, GNU general public license v3. In the SMAA the 5 classes of environmental performance are introduced consistently with PEF/OEF pilots proposed classes, for each of the product category. In order to assess whether a product (e.g. product X ) belongs to one of the impact categories, the characterized results of the product are compared against the benchmarks for each of the impact category. In fact, the benchmarks represent an average product, which does not necessarily exist in reality, and to which the considered product (e.g. product X ) can be compared against. In case the performance of product X is lower (i.e. better) than e.g. the threshold defining class A for a given impact category, then the product gets classified as belonging to class A for a given impact category. This exercise is repeated for all of the impact categories, so that the number of times in which the product is classified in a given class out of the total number of impact categories gives a coefficient of membership to a given class. For example, if all impact category indicators of product X fall into class A then the membership of product X to class A is 100%. Whereas, if 50% of the impact category indicators of product X are classified in class B and 50% in class A, then the product is 50% on class A and 50% on class B. Then a set of basic rules regarding the membership values can be defined (e.g. the worst class is taken in case the membership is not significantly different amongst two classes 50%, or others). Similarly, veto thresholds can be introduced. The ordinal ranking amongst impact categories obtained through the first step is used in order to introduce weighting factors based on the ordinal scale obtained from step 1. The ordinal information is mapped assuming an equal probability between different configurations which respect the ordinal information and assuming that weights can vary between 0 and 1, while their sum is equal to 1. E.g. impact category 1 is more important than impact category 2 then a set of weighting factors which respect this order is considered. By doing so impact categories are prioritized according to the outputs of step 1. As the approach is stochastic, meaning that the whole procedure is automatically repeated times through a Monte-Carlo generator; this allows taking potentially into account uncertainty affecting impact category indicators results as well as benchmarks. Drawbacks: Even if according to the PEF implementation guide (EC 2016), Technical Secretariat of the PEF pilots should define 5 classes of environmental performance ranging from A to E, with A being the best performing class and class C the benchmark, i.e. the characterized result of the PEF profile of the representative product(s), this was not developed in a broad and consistent way by the EF pilots. As a result, the class profiles are not available and the definition of hypothetical values would be not robust; The approach is product category specific, which implies that the class boundaries should be defined according to each product group. This means that for each product group the 5 classes of environmental performance are required. 64
69 Upsides The procedure is partially non-compensatory and avoids issues linked to full substitutability amongst impact category indicators and commensurability issues; The well-known issue affecting normalisation references and impact assessment indicators flaws are substantially mitigated. Outputs: The procedure described above allows the identification of the three most important impact category indicators, as well as the classification of a product in a given class of environmental performance. No single score is calculated so to avoid the drawbacks of the other approaches. This option allows performing the contribution analysis for each of the 15 impact category indicators separately only (i.e. no contribution to the single score). Classes of environmental performance are defined on the basis of the PEF/OEF outputs and are specific for each of the product groups. 65
70 Annex 6. Evaluation of the proposed weighting options Table A6.1 Evaluation of the proposed weighting options ( :poor, o: medium, +: good performance) Criteria Description Option 1: Flat weighting at the midpoint Option 2: Weighting at the endpoints Option 3: Hierarchical weighting at midpoint Option 4: Outranking matrix Inclusiveness/Pl uralism of perspectives Are multiple perspectives/stakeh olders considered by the procedure? (only experts) + (experts and other stakeholders) + (experts and other stakeholders) + (experts and other stakeholders) Transparency Is the procedure transparent and easily understandable? + (easily understandabl e weighting and aggregation method) o (easily understandable preference elicitation but weights elicitation is complex) + (easily understandable weighting and aggregation method) o (the computational procedure could be difficult to understand and perceived as less transparent) Stability Are the results of the procedure stable against inclusion or exclusion of particular alternatives, according to theory? + (results are unaffected from the number of alternatives) + (results are unaffected from the number of alternatives) + (results are unaffected from the number of alternatives) (the class boundaries need to be defined per product category and they might vary according to the considered spread around the benchmark) Strong/weak sustainability Does the procedure allow for full, partial or it avoids compensation? (full compensation is accepted) (full compensation is accepted) - (full compensation is accepted) + (noncompensatory, no poor performance on one IC can be compensated for good performance on another) Ability to include multiple forms of information Is the procedure and its mathematical implementation able to include the following forms of information: qualitative judgments, crisp numbers, uncertainty, fuzziness? o (Yes, but data need to be converted to a common scale) o (Yes, but data need to be converted to a common scale) o (Yes, but data need to be converted to a common scale) + (no data transformation is required) Ability to include information on robustness Is the procedure and its mathematical implementation able to take into account robustness associated with inventory and LCIA results? + (robustness factors can be introduced) + (robustness factors can be introduced) + (robustness factors can be introduced) + (robustness factors can be introduced) 66
71 Criteria Description Option 1: Flat weighting at the midpoint Option 2: Weighting at the endpoints Option 3: Hierarchical weighting at midpoint Option 4: Outranking matrix Specificity by PEF product group Does the procedure require to focus on each product group/sector? + (no, the results are independent from the PEF results and can be applied to other case studies) + (no, the results are independent from the PEF results and can be applied to other case studies) + (no, the results are independent from the PEF results and can be applied to other case studies) (yes, the class boundaries need to be defined for each product category) Communicability of product performance Does the procedure provide results which can be communicated as product performance? Single score or multiple scores? + (yes, as single score that can be related to a class) + (yes, as single score that can be related to a class) + (yes, as single score that can be related to a class) o (yes, only as a class) Complexity in the interaction with stakeholders Complexity of the information requested to the participants o (medium, 15 comparisons all in a round) + (low, only endpoints are included) o (medium, subsets of ICs are considered) (high, class boundaries selection) Computational demand Simplicity of the operations or operations requiring dedicated software/application s + (simple formula for calculation of weights and implementatio n of weighted average in LCA software) (complex formula for calculation of weights) + (simple formula for calculation of weights and implementation of weighted average in LCA software) (the use of a dedicated software is envisaged for the computation of the classifications) Consistency with ILCD midpoint Is the procedure leading to a ranking of the 15 ILCD impact categories? + (yes) (no, the 15 ILCD midpoint impact category indicators are translated into 3 endpoint impact category indicators) + (yes) + (yes) Considerations that apply after the weights have been elicited Avoidance of LCA steps considered as problematic Is the procedure avoiding the use of normalisation and/or other methodological (no, use of normalisation) (no, use of mid-toendpoints characterization factors) (no, use of normalisation) + (data can be treated as they are) Consistent use of information (weighting factors) Are the weighting factors used as coefficients of importance or coefficient of tradeoffs, consistently with the way they are developed? (importance coefficients are used as trade-offs) + (yes, weights represent trade-offs) (importance coefficients are used as tradeoffs) + (yes, weights are used as importance coefficients) 67
72 Annex 7. Questionnaire design [Extracted from the report: Assessment of different communication vehicles for providing Environmental Footprint information. Implementation of the weighting exercise Presented in consortium by London School of Economics and partners] The method of hierarchical weighting at midpoints and endpoint aims at developing factors applicable to the EU context based on respondents assessment of the 15 impact categories (midpoints) within the 3 super-ordinate main areas (endpoints). Two different target groups are envisaged: the general population (lay respondents) and experts in the environmental field. Two questionnaires have been designed. one for the experts and one for lay respondents. They cover similar issues but differ in wording. Demographic characteristics have been elicited for both the public and experts. A7.1 General public The first target group has been accessed using an online panel to recruit a representative sample of 400 Internet users in each country. The respondents have been invited to complete an online survey of circa minutes. After replying to socio-demographics characteristics, in Step 1 respondents swing the weightings of the three end points. Endpoint number 1 gets 100 points and then participants have to rate the other 2 relatives to number 1. Step 2 comprises the ranking of the mid points. Participants are asked to rank the midpoints of the top endpoint they selected in step 1. Following the same logic applied in Step 1, the first mid-point gets 100 points and the others are rated relative to number 1. After this exercise is performed, participants have been randomly allocated using quotas to perform the same exercise with one of the two other endpoints. Lastly, respondents were asked to replay to battery of questions related to their environmental attitude. The figure below sketches the overall procedure. Figure A7.1 General public survey procedure 68

: Figure A7.")
73 The questionnaire includes the following sentences to address the end-points: Human Health. The aim is to quantify the negative effects capturing death and illnesses as consequence of e.g. emitted chemicals or radiation that take place during the life cycle of a product; Natural Environment. The aim is to quantify the negative effects on the function and structure of natural ecosystems as a consequence of e.g. emitted chemicals or physical interventions that take place during the life cycle of a product; Natural Resources. The aim is to quantify the negative effects due to the use of abiotic resources which results in a decrease in the availability of the total resource stock. as abiotic resources are usually finite and non-renewable. To perform this task, respondents would see the following screens (impact categories have been randomized to avoid order effects): Figure A7.2 Screen 1 Figure A7.3 Screen 2 To address the midpoints the following explanations have been provided. Before launching the online survey these explanations have been piloted. 69
74 Human Health Climate change. Emissions of greenhouse gases change temperature and the climate for the worse. impacting indirectly also your health. Ozone depletion. Emissions damage the ozone layer leading to increased ultraviolet radiation resulting to skin cancer and damage to plants. Human Toxicity (cancer). Emissions of toxic substances leading to an increased risk of cancer. via the air we breathe and also indirectly via the food we eat and the water we drink. Human Toxicity (non-cancer). Emissions of toxic substances damaging your health. via the air we breathe and also indirectly via the food we eat and the water we drink. Particulate matter. Emissions of tiny particles that lead to respiratory diseases and the so called winter smog. Ionizing radiation. Radiation that increases risk of cancer. Photochemical ozone formation. Emissions creating so called summer smog and respiratory diseases. Natural Environment Climate change. Emission of greenhouse gases changes temperature and the climate for the worse. impacting indirectly also the ecosystems. Acidification. Emission of substance that lead to acid rain and poorer quality of air. water and soil. Eutrophication terrestrial. Too many nutrients in the environment. e.g. by over use of fertilisers in farming. upset the balance of nature. Eutrophication freshwater. Too many nutrients in freshwater. e.g. by the over use of fertilisers in farming and release of wastewater. upset the balance of nature. e.g. leading to algal blooms and killing fish. Eutrophication marine. Too many nutrients in marine water. e.g. by the over use of fertilisers in farming and release of wastewater. upset the balance of nature. e.g. leading to algal blooms in sea water. Land use. Use of land and soil endanger soil fertility as well as the survival of some species of animals and plants. Ecotoxicity freshwater. Emission of toxic substances that are a danger to organisms like fish. algae and other organisms living in fresh water. Natural Resources A7.2 Experts Land use. Use of land creates pressures on the availability of soil as resource. Climate change. Emission of greenhouse gases changes temperature and the climate for the worse. impacting indirectly also the natural resource provision. Resource use: metals and minerals. The use of minerals. metals and other resources in a product affects their availability for future uses. Resource use: fossils. The use fossil fuels affects their availability for future uses. Water use. The use of freshwater affects its availability for future uses. After replying to socio-demographics characteristics, experts swing the weightings of the three end points (Step 1). End-point number 1 gets 100 points and then participants have to rate the other 2 relatives to number 1. Step 2 comprises the ranking of the mid points. Participants have been randomly allocated to rank the mid-points of either Human Health or Ecosystem Quality. Following the same logic applied in Step 1, the first mid-point gets 100 points and the others are rated relative to number 1. After this exercise was performed. participants were also asked to weight the resources mid-points. In both cases participants were asked to rank their level of expertise in each mid-point. Lastly, 70
75 respondents were asked to replay to battery of questions related to their environmental attitude. The following figure sketches the overall process. Figure A7.3 Experts survey procedure 71
76 The experts questionnaire includes the definition of the 15 impact categories as provided by JRC: Climate change. Refers to the changes induced to the World s climate as a consequence of the emissions to the atmosphere of the so-called greenhouse gases, such as CO2, N2O, CH4. The Earth s atmosphere absorbs part of the energy emitted as infrared radiation from Earth towards space, and is thereby heated. This natural greenhouse effect leading to a warming of the atmosphere has been increased over the past few centuries by human activity leading to accumulation of such compounds as CO2, N2O, CH4 and halocarbons to the atmosphere. The most important human contribution to the emissions of greenhouse gases is attributed to the combustion of fossil fuels such as coal, oil and natural gas. The consequences include increased global average temperatures and sudden regional climatic changes. Ozone depletion. The stratospheric Ozone (O3) layer (that can stretch from ~8km to ~50 km height) protects us from hazardous ultraviolet radiation (UV- B). Its depletion can have dangerous consequences in the form of increased frequency of skin cancer in humans and damage to plants. Stratospheric O3 is broken down as a consequence of man-made emissions of halocarbons (as CFCs and HCFCs), halons and other long-lived gases containing chloride and bromine. The ozone content of the stratosphere was therefore decreasing, and since 1985 a dramatic temporary thinning of the ozone layer, often referred to as ozone hole, has been observed each year, over the South Pole. In recent years the problem has been reduced due to international ban of substances contributing to ozone depletion. Human toxicity cancer effects. Chemicals emitted as a consequence of human activities can contribute to cancer in humans via exposure to the environment. For a substance to be regarded as contributing to human toxicity, it must of course cause cancer. In addition, also the substance s behavior has to be considered in that there can be several routes of exposure to humans. The most important routes of exposure are via the air breathed in or via other materials ingested orally, e.g. food or water. Human toxicity non-cancer effects. Chemicals emitted as a consequence of human activities can contribute to human toxicity via exposure to the environment. For a substance to be regarded as contributing to human toxicity, it must of course be poisonous to humans. In addition, also the substance s behavior has to be considered in that there can be several routes of exposure to humans. The most important routes of exposure looked at in those categories are via the air breathed in or via other materials ingested orally, e.g. food or water. Particulate matter/respiratory inorganics. Ambient concentrations of dust or particulate matter (PM) are elevated by emissions of primary and secondary particulates. The mechanism for the creation of secondary emissions involves emissions of SO2 and NOx that create sulphate and nitrate aerosols. Particulate matter is measured in a variety of ways: total suspended particulates (TSP), particulate matter less than 10 microns in diameter (PM10), particulate matter less than 2.5 microns in diameter (PM2.5) or particulate matter less than 0.1 microns in diameter (PM0.1). Usually, the smaller the particles are the more dangerous they are as they can get deeper into the lungs. Ionising radiation, human health. The exposure to ionising radiation ( radioactivity ) can have impacts on human health. The modelling starts with releases at the point of emission, expressed as Becquerel (Bq). The exposure analysis calculates the dose that a human actually absorbs, given the radiation levels that are calculated in the fate analysis. The measure for the effective dose is the Sievert (Sv), based on human body equivalence factors for the different ionising radiation types. It is to be noted, that in Life Cycle Assessment and in the Environmental Footprint only emissions are taken into account that occur 72
77 under normal operating conditions. The risks due to nuclear accidents are not covered by the EF. Photochemical ozone formation, human health. While a sufficiently high concentration of ozone up in the stratosphere (8-50 km) is vital to protect the earth from hazardous ultraviolet radiation (UV-B), ozone on the ground (in the troposphere) attacks organic compounds and especially the respiratory tract in humans. This leads to an increased frequency of problems of the respiratory tract in humans during periods of photochemical smog in cities ( summer smog ). When solvents and other volatile organic compounds (VOCs) are released to the atmosphere (e.g. by emissions from combustion processes), they can be degraded within a few days. The reaction involved is an oxidation, which occurs under the influence of light from the sun. In the presence of oxides of nitrogen (NOx) ozone can be formed. NOx are not consumed during ozone formation, but have a catalyst-like function. This process is termed photochemical ozone formation. Acidification. Acidification has contributed to a decline of coniferous forests and increased fish mortality. Acidification can be caused by emissions to air, water and soil. For instance when gaseous SO2 is released and reaches a water body, it reacts with H2O to form the acid H2SO4. When acids (and compounds that can be converted to acids) are emitted to the atmosphere and deposited in water and soil, the addition of hydrogen ions (H+) may result in a decrease in the ph of the water body. The most significant man-made sources of acidification are combustion processes in electricity, heating production and transport. The contribution to acidification is greatest when the fuels used contain a high content of sulphure. Eutrophication terrestrial. Eutrophication is an impact on the ecosystems from substances containing nitrogen (N) or phosphorus (P). As a rule, the availability of one of these nutrients will be a limiting factor for growth in the ecosystem, and if this nutrient is added, the growth of algae or specific plants will be increased. On land, ecosystems which need an environment with only little nutrients are gradually disappearing mainly as a result of the addition of nitrogen (N). Oxides of nitrogen (NOX) from combustion processes are of significance for both aquatic and terrestrial ecosystems. Eutrophication freshwater. Eutrophication is an impact on the ecosystems from substances containing nitrogen (N) or phosphorus (P). As a rule, the availability of one of these nutrients will be a limiting factor for growth in the ecosystem, and if this nutrient is added, the growth of algae or specific plants will be increased. In lakes and rivers this will be mainly due to the increase of phosphorus (P). Too rapid growth of algae can lead to situations without enough oxygen in the water for fish to survive once the algae die and are degraded (which consumes oxygen). Emissions of nitrogen to the aquatic environment are caused largely by the agricultural use of fertilizers, but oxides of nitrogen from combustion processes are also of significance for both aquatic and terrestrial ecosystems. The most significant sources of emissions of phosphorus are sewage treatment plants for urban and industrial effluents and leaching from agricultural land. Eutrophication marine. Eutrophication is an impact on the ecosystems from substances containing nitrogen (N) or phosphorus (P). As a rule, the availability of one of these nutrients will be a limiting factor for growth in the ecosystem, and if this nutrient is added, the growth of algae or specific plants will be increased. For the marine environment this will be mainly due to the increase of nitrogen (N). Emissions of nitrogen are caused largely by the agricultural use of fertilizers, but oxides of nitrogen from combustion processes are also of significance for both aquatic and terrestrial ecosystems. Ecotoxicity freshwater. A substance contributing to ecotoxicity, affects the function and structure of the ecosystem by exerting toxic effects on the organisms which live in it. Toxic effects can occur as soon as the substances are 73
78 released (acute ecotoxicity), or may appear after repeated or long-term exposure to the substances (chronic ecotoxicity). Chronic ecotoxicity is often caused by substances which have a low degradability in the environment and which can therefore remain for a long time after their emission (persistent substances). Some substances also have the tendency of accumulating in living organisms, so that tissues and organs can be exposed to concentrations of the substance which are far higher than the concentration in the surrounding environment. The chronic ecotoxicity of a compound is thus determined by its toxic effects, its biodegradability, and its ability of accumulating in living organisms. Land use. The impact category Land Use tries to estimate the damage to ecosystems due to the effects of occupation and transformation of land. Examples of land use are agricultural production, mineral extraction and human settlement. Transformation is the conversion of land from one use to another use. The impacts can be various such as loss of species, soil organic matter content or reduced primary production or loss of the soil itself ( erosion ). Resource use water. The withdrawal of water from lakes, rivers or groundwater can contribute to the depletion of the available water, while water itself is seen as a renewable resource. The impact category considers the availability or scarcity of water in the regions where the activity takes place, if this information is known. Resource use metals and minerals. The earth contains a finite amount of non-renewable resources, such as metals, minerals. The use of resources may lead to a decrease of availability of potential functions of resources. Resource use fossils. The earth contains a finite amount of non-renewable resources, such as fossils like coal, oil and gas. The use of resources may lead to a decrease of availability of potential functions of resources. 74
79 Annex 8. Participants to the webinar Two webinars were held on the Adobe Connect platform, one on February 28 th 2017 and one on March 1 st Participants had the possibility to make comments and questions both using the microphone and the chat. Several points were raised by participants and collected from JRC for further analysis and modifications of the model. As reported in table A8.1 Around 47% of the excel files were received from experts not attending a webinar. Table A8.1. Number of participants of the two webinars and excel file received. 28th February 1st March (Not attended) total Registered at the webinar Participants to the webinar Excel file received Among the 84 experts that sent the excel file, the following agreed to have their name listed as contributor to the results of the exercise. Rodrigo Alvarenga, Anders Andrae, Fulvio Ardente, Rémi Bagard, Anders Bjoern, Florian Boess, Ulrike Bos, Anne-Marie Boulay, Kate Brauman, Arthur Braunschweig, Sandra Sofia Ferreira da Silva Caeiro, Lee Chew Tin Cancelori, Viêt Cao, Marco Casazza, Kim Christiansen, Luca Ciacci, Andreas Ciroth, Sanne Dekker, Brendan Edgerton, Paul Ekins, Kai Fang, Peter Glavic, Castelan Guy, Oihana Hernaez, Jean-Paul Hettelingh, Roland Hischier, Katarzyna Joachimiak-Lechman, Niels Jungbluth, Lara Lamon, Alexis Laurent, Etienne Lees-Perasso, Anna Lewandowska, Johan Lhotellier, Jan Paul Lindner, Lorcan Lyons, Sylvain Martinez, Antonio Marvuglia, Natalia Matiz, Valeria Mezzanotte, Llorenc Mila-I-Canals, Ingunn Saur Modahl, Nunez-Pineda Montse, Monia Niero, Eirik Nordheim, Alexander Passer, Maria Grazia Perrone, Gregory Peters, Marianna Pierobon, Massimo Pizzol, Leo Posthuma, Ramona Rieckhof, Vincent Rossi, Marcella Sade, Peter Saling, Thomas Schaubroeck, Sue Ellen Taelman, Marie Tichá, Hanna Tuomisto, John Tzilivakis, Nicole Unger, Arkaitz Usubiaga, Harry Heeswijk van Ewijk, Beatriz Vidal-Legaz, Klaus Wiesen, Joanna Witczak. 75
80 Annex 9. Criteria design and preliminary assessment An environmental impact can be described using several dimensions, such as the geographical scale, the time to occur and others. In this research five dimensions were considered sufficient to describe an impact and one or more corresponding criteria were associated. Table 1 presents the dimensions of the impacts and the criteria used for the assessment. Dimensions Geography Time Physical-chemical properties Magnitude Intensity Criteria associated (I) spread of the impact (II) time span of generated impact (III) reversibility of impact (IV) level of impact compared to planetary boundary (V) severity of effects on human health (VI) severity of effects on ecosystem quality (VII) severity of effects on ecosystem quality Each of the criteria is then organized in 6 levels of qualification according to the dimension that it referrers to. (I) Spread of impact. This criterion refers to the level of diffusion of a certain impact. The higher is the level of spread the higher occurrence the sources of pressure have in the World Punctual impact Little diffused Medium diffused Highly diffused Widespread Globally present very localized impact localized impact regional impact or local impacts experienced on regional level impact on a country level or local impacts experienced on a country level impact on a continental level or local impacts experienced on a continental level global impact or local impacts experienced on a global scale Impact category Predefined level Predefined score Climate change Globally present 100 Ozone depletion Widespread 80 Human toxicity, cancer effects Widespread 80 Human toxicity, non-cancer effects Widespread 80 Particulate matter/respiratory inorganics Widespread 80 Ionizing radiation, human health Little diffused 20 Photochemical ozone formation, human health Medium diffused 40 Acidification Globally present 80 Eutrophication Widespread 40 Land use Globally present 100 Ecotoxicity freshwater Widespread 80 Resource use, water Widespread 80 Resource use, mineral and metals Globally present 100 Resource use, fossils Globally present 100 (II) Time span of generated impact. This criterion refers to the magnitude of the time interval in which the impact take place. In operative terms, it answers the question: 'how long the impact lasts when the pressure is ending?' 76
81 Momentary Very short term Short term Medium term Long term Very long term less than 1 month more than 1 month and less than 1 year 1-3 years 4-30 years years more than 100 years Impact category Predefined level Predefined score Climate change Very long term 100 Ozone depletion Long term 80 Human toxicity, cancer effects Very long term 100 Human toxicity, non-cancer effects Very long term 100 Particulate matter/respiratory inorganics Very long term 20 Ionizing radiation, human health Very long term 100 Photochemical ozone formation, human health Momentary 1 Acidification Medium term 60 Eutrophication Medium term 60 Land use Long term 80 Ecotoxicity freshwater Very long term 100 Resource use, water Medium term 60 Resource use, mineral and metals Long term 80 Resource use, fossils Very long term 100 (III) Reversibility of impact. This criterion refers to the difficulty to -hypothetical- bring back the situation as before the impact took place, in case the pressure stops. Natural instantaneous Natural (complete) Natural (partial) Solely artificial (complete) Solely artificial (incomplete) Irreversible the return to a previous situation is natural and requires less than 1 year the return to a previous situation is natural and complete even if in more than 1 year the return to a previous situation is possible naturally but just to some extent the return to a previous situation is possible just with the human intervention it is possible to return to a previous situation, but not completely and just with the human intervention the return to a previous situation is impossible Impact category Predefined level Predefined score Climate change Natural (partial) 40 Ozone depletion Natural (complete) 20 Human toxicity, cancer effects Irreversible 100 Human toxicity, non-cancer effects Solely artificial (partial) 80 Particulate matter/respiratory inorganics Solely artificial (partial) 80 Ionizing radiation, human health Irreversible 100 Photochemical ozone formation, human health Solely artificial (partial) 80 Acidification Natural (partial) 40 Eutrophication Natural (partial) 40 Land use Natural (partial) 40 Ecotoxicity freshwater Solely artificial (partial) 80 Resource use, water Solely artificial (partial) 80 Resource use, mineral and metals Solely artificial (partial) 80 Resource use, fossils Irreversible
82 (IV) Level of impact compared to planetary boundary. This criterion refers to the extent to which the impact has reached or surpassed the planetary capacity to metabolize the impact itself. In practical terms, the greater distance to the planetary boundary is estimated, the greater mitigation effort is expected and urgent. The possible status refer to a threshold that is specific for each impact category and calculated according to several studies on the planetary boundaries (Rockström et al., 2009; Sala et al., 2016; Whitmee et al., 2015). Negligible Far smaller than the threshold Smaller than the threshold Of the same order than the threshold Greater than the threshold Far greater than the threshold the extent of the impact is less than 1% of the planetary boundary the extent of the impact is between 1% and 24% of the planetary boundary the extent of the impact is between 25% and 89% of the planetary boundary the extent of the impact is between 90% and 110% of the planetary boundary the extent of the impact is between 111% and 200% of the planetary boundary the extent of the impact is more than double of the planetary boundary Impact category Predefined level Predefined score Climate change Greater than the threshold 80 Ozone depletion Far smaller than the threshold 20 Human toxicity, cancer effects Greater than the threshold 80 Human toxicity, non-cancer effects Of the same order of the threshold 60 Particulate matter/respiratory inorganics Greater than the threshold 80 Ionizing radiation, human health Of the same order of the threshold 60 Photochemical ozone formation, human health Of the same order of the threshold 60 Acidification Far smaller than the threshold 20 Eutrophication Far greater than the threshold 100 Land use Greater than the threshold 80 Ecotoxicity freshwater Far greater than the threshold 100 Resource use, water Smaller than the threshold 40 Resource use, mineral and metals Smaller than the threshold 40 Resource use, fossils Of the same order of the threshold 60 (V) Severity of effects on human health. This criterion refers to how severely each impact influences human health. In particular this criterion refers to mortality rates and human diseases related to the impact. Non-existent Very low Low Medium High Very high the impact has no direct effect on human health the impact has no mortality rate and low recovery time the impact has no mortality rate but a long recovery is needed the impact has a low mortality rate or a significant effort for recovery is needed the impact has a medium mortality rate or the recovery is rarely complete the impact has a high mortality rate or result in a permanent disease 78
83 Impact category Predefined level Predefined score Climate change High 80 Ozone depletion Very high 100 Human toxicity, cancer effects Very high 100 Human toxicity, non-cancer effects Very high 100 Particulate matter/respiratory inorganics High 80 Ionizing radiation, human health Very high 100 Photochemical ozone formation, human health High 80 Acidification Non-existent 0 Eutrophication Non-existent 0 Land use Non-existent 0 Ecotoxicity freshwater Non-existent 0 Resource use, water Very high 100 Resource use, mineral and metals Low 40 Resource use, fossils Low 40 (VI) Severity of effects on ecosystem quality. This criterion refers to how severely each impact influences ecosystem quality. In particular this criterion refers to biodiversity losses and ecosystem dysfunctions in relation to the impact. Non-existent Very low Low Medium High Very high the impact has no direct effect on ecosystem quality few species are threatened and the overall function of the target ecosystem is not in danger several species are threatened and the balance of the target ecosystem cannot be directly compromised effective loss of some key species or the overall function of the target ecosystem is at serious risk a sensible damage on the biodiversity or the overall function of the target ecosystem is partially compromised a severe damage on the biodiversity or the overall function of the target ecosystem is dramatically compromised Impact category Predefined level Predefined score Climate change Low 40 Ozone depletion High 80 Human toxicity, cancer effects Non-existent 0 Human toxicity, non-cancer effects Non-existent 0 Particulate matter/respiratory inorganics Non-existent 0 Ionizing radiation, human health Low 40 Photochemical ozone formation, human health Low 40 Acidification High 80 Eutrophication High 80 Land use Very high 100 Ecotoxicity freshwater Very high 100 Resource use, water Very high 100 Resource use, mineral and metals High 80 Resource use, fossils High 80 (VII) Severity of effects on resource availability. This criterion refers to how severely each impact influences resource availability. In particular this criterion refers to the reduced stock, fund or flow of natural resources (renewable and non-renewable). 79
84 Non-existent Very low Low Medium High Very high the impact has no direct effect on resource availability the impact has a negligible effect on the availability of natural resources the impact has a minor effect on the availability of natural resources the impact has a sensible effect on the availability of natural resources the impact significantly contribute to reduce the availability of natural resources the impact as a severe repercussion on the availability of natural resources Impact category Predefined level Predefined score Climate change Medium 60 Ozone depletion Non-existent 0 Human toxicity, cancer effects Non-existent 0 Human toxicity, non-cancer effects Non-existent 0 Particulate matter/respiratory inorganics Non-existent 0 Ionizing radiation, human health Non-existent 0 Photochemical ozone formation, human health Non-existent 0 Acidification Medium 60 Eutrophication Medium 60 Land use High 80 Ecotoxicity freshwater High 80 Resource use, water Very high 100 Resource use, mineral and metals Very high 100 Resource use, fossils Very high
85 Annex 10. Agenda and slides presented in the two webinars Tuesday 28th February 2017, starting from 14:00 CET time. The webinar had the following agenda: Presenter Topic Schedule 1. Rana Pant 2. Serenella Sala 3. Alessandro Cerutti Opening and welcome Weighting in Life Cycle Assessment The importance of weighting for decision support in the context of the EF Key methodological aspects of the calculation of a weighting set for the EF Criteria for assessing environmental impacts based on expert input Description and opening of the questionnaire 4. Open session The webinar room will stay open for questions and comments from the audience while participants are requested to complete the questionnaire 14:00 14:20 14:20 14:30 14:30 14:40 14:40 16:00 Wednesday 1 st March 2017, starting from 10:00 CET time. The webinar has the following agenda: Presenter Topic Schedule 1. Rana Pant 2. Alessandro Cerutti Opening and welcome Weighting in Life Cycle Assessment Key methodological aspects of the calculation of a weighting set for the EF Criteria for assessing environmental impacts based on expert input Description and opening of the questionnaire 3. Open session The webinar room will stay open for questions and comments from the audience while participants are requested to complete the questionnaire 10:00 10:20 10:20 10:40 10:40 12:00 81
86 Slides presented in the two webinars 82

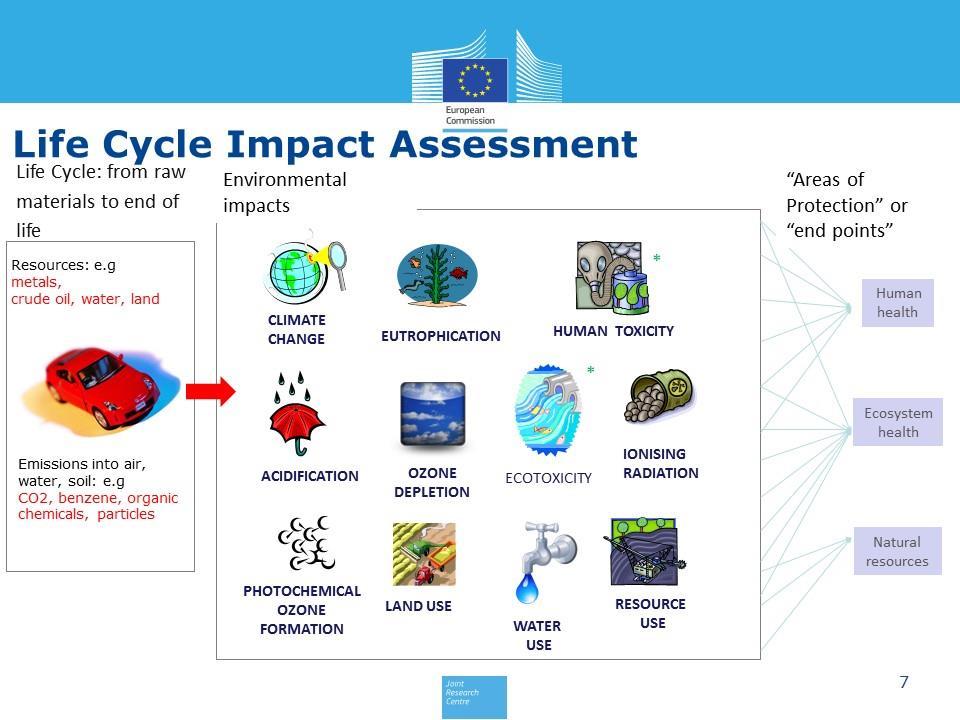
87 83

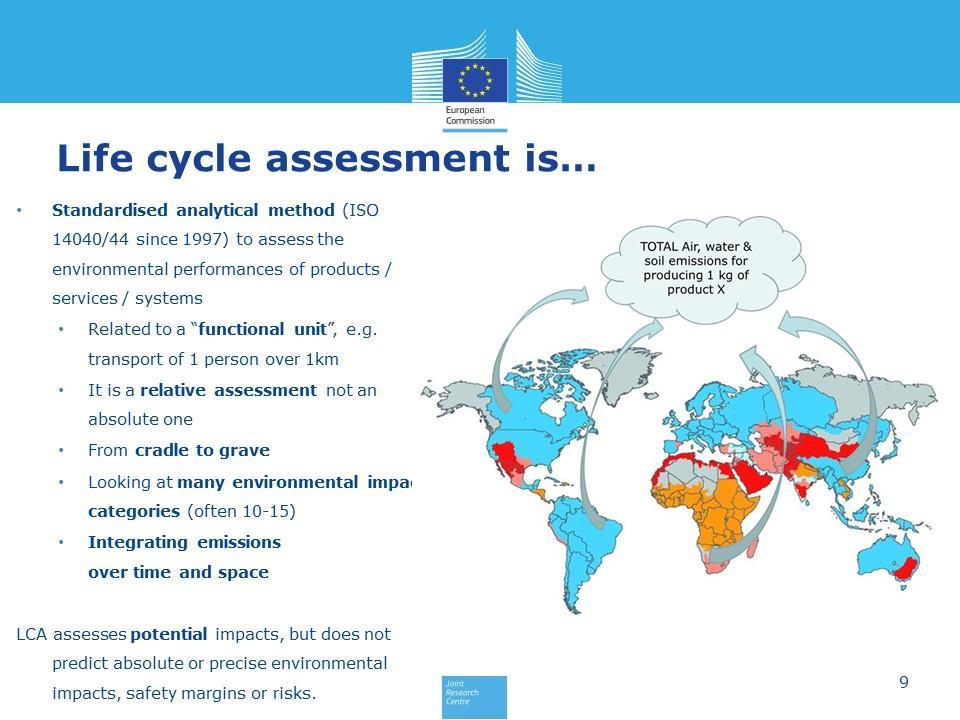
88 84


89 85


90 86

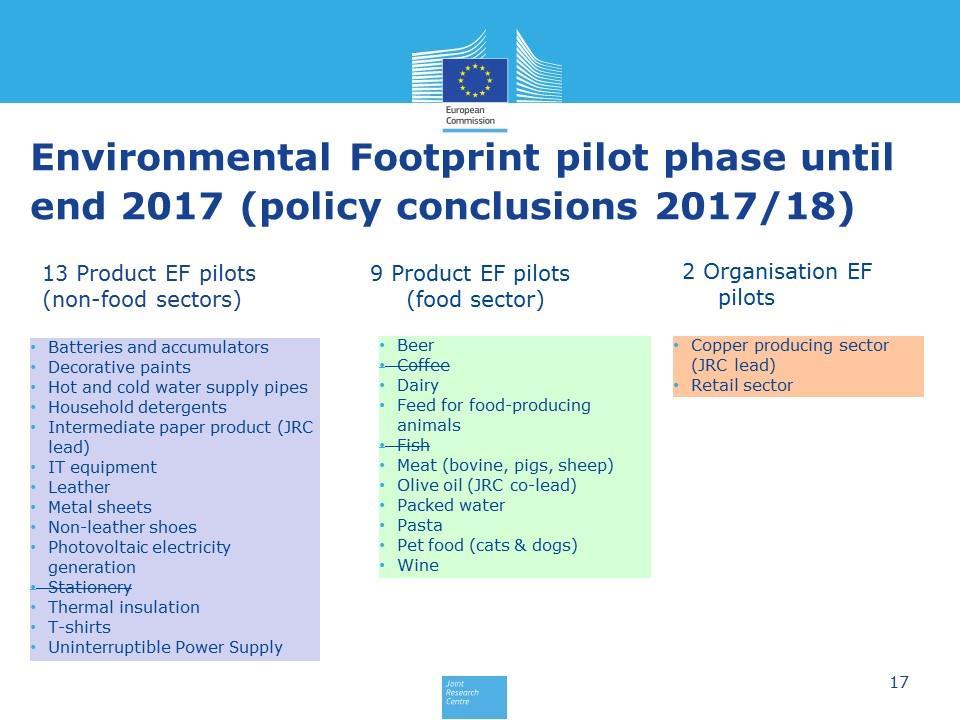
91 87


92 88


93 89


94 90


95 91

96 92


97 93

98 94


99 95

100 96


101 97

102 98

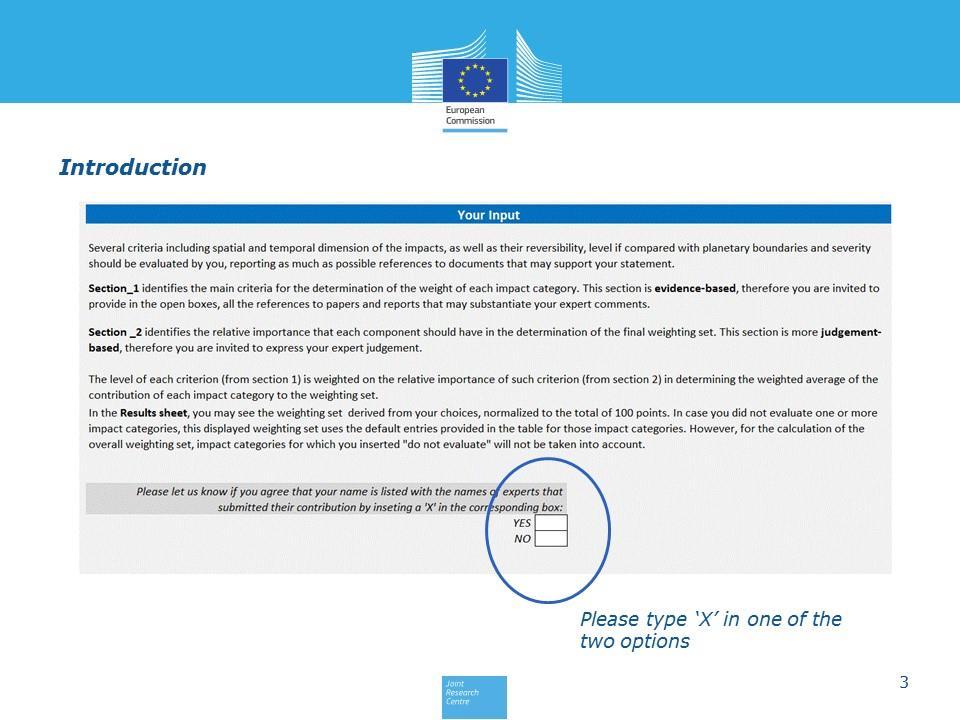
103 99


104 100

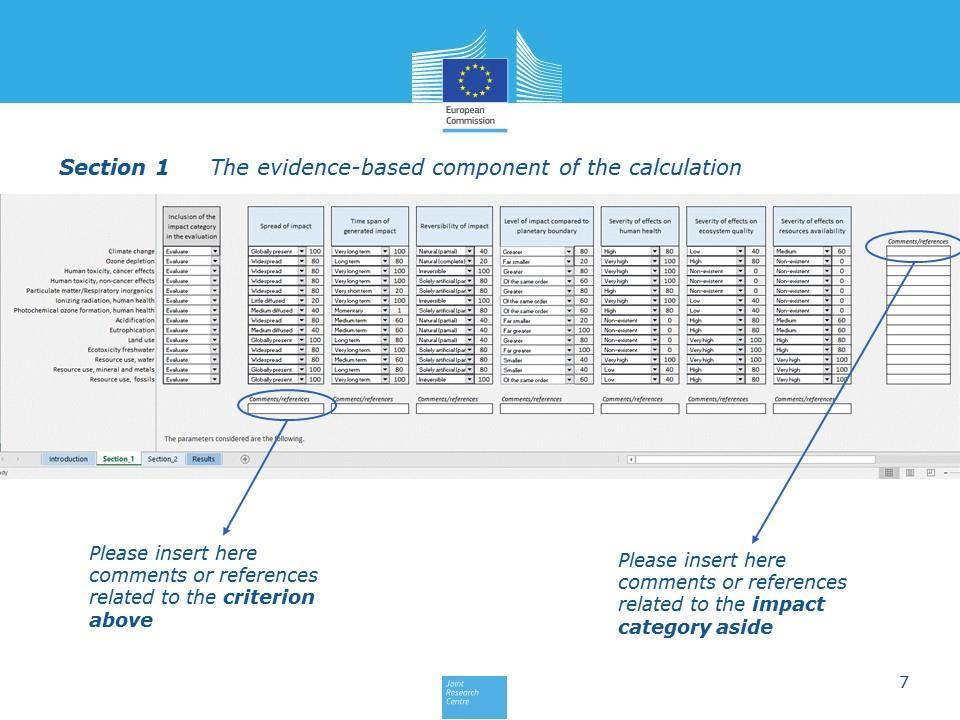
105 101

106 102


107 103
108 Annex 11. Comments received during the webinar and its follow-up As input to the webinar, the JRC provided default values to kick-start the thought process. Participants were very active in challenging and changing those values based on their expertise in the field. This was precisely the objective of this part of the process to derive weighting factors for the impact categories used in the Environmental Footprint. Comments on the adopted criteria, the methodological choices and the impact categories are reported anonymously. Overall, we received many valuable comments and insights. Some reflections of JRC on those comments are also provided. Those reflections may have been shared with participants during the webinar (be it in discussions or in the chat) but also go beyond this. It is correct that the provided scale up to 100 limited somewhat the possibility to spread the values even further. However, the option to assign certain impact categories or criteria a value of zero also was provided. With this the JRC judges that sufficient possibility was available to express also a very low value and by doing so to discriminate between the impact categories or criteria. In fact, looking at the overall results, many participants did not make use of the more extreme values very often but expressed a more centred view. It is correct that there are certainly significant variations due to regional and local dependencies and to different substances with different profile (e.g. related to persistency) contributing to one impact, which will alter the evaluation against the criteria. Generally speaking, the evaluations should reflect an average situation ( best estimate ) as much as possible. This refers for example to the spread of the sources of emissions, the substances causing the impacts, the environmental conditions (e.g. capability to adapt to acidifying substances), the existing background pressures related to the impacts, but also to the duration for which impacts can be expected. On the question if individuals are impacted or an entire population, the evaluation should also take into account aspects beyond the level of individuals. It is correct that several overlaps can be identified both on the level of safeguard subjects (human health, ecosystem health and natural resources) and on the level of criteria, e.g. between time span and reversibility or between reversibility and severity of impacts towards one of the three safeguard subjects. However, as each criterion is also having very specific and distinct aspects to be considered, we think that all of them deserve to be taken into account. Comments on the criterion: Spread of impacts Water is a very local aspect, and while impacts may be experienced up to the country level, specifically regarding human health, food production, or economical aspects, I am unaware of water issues being experienced at the continental level, since so much diversity of water-related situations exist within a continent I regard the spread of impact also 80, because water scarcity is a local issue on all continents (but Antarctica). When not including Antarctica, I would say 100 It is recommended that you introduce "interaction between impacts" as an additional category to assess "spread of impact". This would imply a 14x14 matrix in which cells can be shaded to indicate interaction with another impact (either directly, or indirectly, i.e. via an input). The number of shaded cells (=interaction) could then indicate the relative importance of an impact. Note that eutrophication is an issue that causes significant effects over broad regions in many continents, hence "widespread". Water impacts are mostly local, but they happen in local places all over the globe 104
109 I think that the values assigned are reasonable. However, it results that only 3 out of the 14 impact categories have a level other than widespread or globally present. For localized assessments the outcomes of this criterion would not be very relevant - in case, consider for revisioning. This parameter represents regionality? I miss a distinction between the scale of the impact (global, regional, local) and the spread of sources that contribute to the impact. Land use and water use are ubiquitous but the impact from a specific land use or water extraction is very local. In my opinion the inherent scale of the impact (following from the impact pathway) is as important as the proliferation of the sources the latter can be changed by regulation, the former not. Human toxicity, cancer and non-cancer effect, cannot be evaluated without a clear definition of the substance including properties like stability. It is no appropriate impact. Particulate matter/respiratory inorganics: the spread of impact of particulate matter depends on the kind of emission. It cannot be collated to a special spread of impact. There has to be made also a differentiations on the basis of bio availability. It is no appropriate impact. Land use as impact category is of no worth when the type of land is not defined Eco toxicity freshwater depends on the substance (formula, stability in nature, availability for organisms) and the kind of water body, a general impact cannot be given. Resource use, water depends on the regional and geographical background. The impact can differ from punctual to wide spread. Resource use differs for different resources, also in combination with the saving of resources by actual recycling. For acidification, eutrophication, water use, land use and particulate matter the emission or resource is very local and emission deposit in these regions. They do not spread very much and are relevant in some regions where in other regions these issues are not relevant. The definition of this criterion is biased because it tries to scale up rather local issues (e.g. toxicity that depends on so many local conditions like background concentrations, etc.) towards higher spreads. The mineral and fossil resources use affects the human economy globally, it is a very important strategic (not environmental) problem, ok, but it remains localized in mining sites and wells, mostly underground. Reflections of JRC on the comments received: The spread of impacts should take into account if an impact is local (or regional) but if these local impacts occur everywhere around the globe, this should be taken into account in the evaluation. This covers the spread of sources/interventions leading to the impacts. It is certainly correct that there are significant variations due to regional and local dependencies and to different substances with different profile (e.g. related to persistency) contributing to the impact, which will alter the evaluation against this criterion. Generally speaking, the evaluations should reflect an average situation ( best estimate ) as much as possible. This refers for example to the spread of the sources of emissions and the substances causing the impacts. Comments on the criterion: Time span of generated impacts Cancer effects: what is the time span referring to? On the final health effects or on the persistence of cancerogenic substances originating those effects? In the first case more than 100 years compared to a human being lifespan is not realistic? In case it refers to persistence of substance: several substances 105
110 causing cancer will degrade in this time span. Overall: long term seems more appropriate than very long term Land use is tricky, because in some cases the use has converted the land from nature to human use and this is irreversible. In other cases the land has already been used for arable/human occupation for ages and not using it would mean it is now available for other types of human use. So question is what the neutral situation is. For eutrophication I think 30 years is quite long. For P issue remains for longer period than for N, which can be quite easily degraded. For resource use mineral and metals, a lot depends where the resource ends up and how easy it can be recovered (dispersion) for recycling. Persistence of particulate in air should be very low. Some overlap with reversibility. What is the difference? very long term should be more than 500/1000years (e.g. half-life radioactive) No particular comment, although the range of values used can be questionable. The grading scale and pre-defined ranges of the criteria will predominate in the final weighting score. Hence a large part of the weighting scores is in fact already pre-defined and not subject to the expert judgement. The time span of generated impact, when only addressing water scarcity itself, differs between surface water (very short) and groundwater (very long). As an example, when surface water abstractions are taken away, river water is restored immediately. When groundwater abstractions are taken away, it can take many years before groundwater aquifers are replenished. Therefore the time span cannot be defined when taking surface and groundwater together. The time span of regeneration of ecosystems depending on water can be many years. I therefore rate the current value of 60 not relevant. Therefore in sheet section 2 I give 0 as value. Time span of generated impact and reversibility of impact overlaps. If the time span of the impact is long, it is not possible to reverse the impact very soon either. Human toxicity, cancer and non-cancer effect, a time span without naming the substance is not possible. Important is the stability of the substance. Ionizing radiation, human health, depends on the distribution and correlated with this the availability. Time span of acidification is dependent of the kind of environment where the effect arises (acidic or alkaline environment; buffer efficiency). Eco toxicity freshwater depends on the substance (formula, stability in nature, availability for organisms) and the kind of water body, a general impact cannot be given. Land use: from momentary (infiltration in humid area) to very long (carbon sequestration), depending on the specific impact Human toxicity is typically limited by the life time of humans and the impact is in most cases limited to max 30 years. Resource issues are even shorter given the fact that in latest one or two decades back-stop technologies are found that make these resources redundant respectively find substitutes (and by the way: there is no resource that is or will be completely depleted) The duration of acidification and eutrophication effects depends on the chemical and biological resilience of terrestrial or aquatic ecosystems, hence "long term" For the toxicity related impacts, this is completely dependent on the environmental persistence of the concerned chemicals. For most chemicals it is very short term to short term (fortunately) but there are a few chemicals where it is medium term or even long term (e.g. dioxins) or very long term (metals). The argument for a default time span of long term would be that the latter dominate the impact? It is not obvious why there is a difference here between human toxicity and ecotoxicity? 106
111 Reflections of JRC on the comments received: It is correct that there are certainly significant variations due to different substances with different profile (e.g. related to persistency) contributing to the impact, which will alter the evaluation against this criteria. Generally speaking, the evaluations should reflect an average situation ( best estimate ) as much as possible. This refers for example to the substances causing the impacts, the existing background pressures related to the impacts, but also to the duration for which impacts can be expected, for example human health impacts are often evaluated looking at a long time horizon. It is correct that the provided scale up to 100 limited somewhat the possibility to spread the values even further. However, the option to assign certain impact categories or criteria a value of zero also was provided. With this the JRC judges that sufficient possibility was available to express also a very low value and by doing so to discriminate between the impact categories or criteria. It is correct that several overlaps can be identified e.g. between time span and reversibility However, as each criterion is also having very specific and distinct aspects to be considered, we think that all of them deserve to be taken into account. For example, even if impacts are expected to last for a long time, that does not indicate whether they are to be seen as irreversible or not. Comments on the criterion: Reversibility of impacts The human body has various elimination mechanisms for many noncarcinogens, so I think they should be more reversible than your default value. Reversibility of impact / Climate change: even by decreasing of pressure, the return to a situation before the pressure existed is questionable: e.g. due to irreversible change on ecosystems. As outlined in the webinar, we are heading for a level above 2 C, which can be considered as irreversible. Therefore Irreversible seems more appropriate. Cancer Effects: Modern medicine and drugs can partially cure cancer, therefore this is not irreversible, but can be at least partially reversed, artificially. This is difficult to answer as it depends on the time span. If I wait a billion years then everything is probably back to "normal" For resource use, water - there's little reason to think that if water resources are no longer withdrawn they would not fully return to a natural state within a couple of years. Groundwater might be a bit slower, but in most cases will revert. Default values are reasonable. My only concern relates to the fact that the impact categories seems to split in two main groups: i.e., likely reversible or likely irreversible. Thus, any weighting factor will little discriminate impact categories. See also comments for "spread of impact". There is interaction between time span and reversibility. Much depends on how easily the impact is dispersed over a larger area over time Many toxic components will do no damage to humans if they are present in very low concentrations. For water scoring will depends on whether we speak about ground water or surface water (for agriculture). Ground water takes very long to be 'refilled' but surface water can be reversed much quicker. The damage done by bad water management (erosion) can require 'artificial repair' about GWP, not sure that reversibility will be achieved naturally (some irreversible effects will occur anyway); reversibility of land use and eutrophication should be naturally complete (or mostly complete), after a sufficient time Without a clear definition of each category it is not possible to interpret this. This criterion significantly overlaps with "time span" I am not sure how to fill in this criteria. Reversibility is dependent on the magnitude/intensity of the impacts (non-linear), the location of the impacts (for 107
112 local/regional impacts and also global impacts), the time span considered and the human interventions. All these aspects should be clarified before indicating reversibility of the impacts. For example, ozone depletion leads to irreversible impacts if its PB is exceeded. This was prevented only thanks to human interventions (i.e. Montreal Protocol). So, should it be "irreversible" or "solely artificial"? This of course disregarding the fact that it is no longer an important concern as most ODS have now been banned. I put "solely artificial" since we know that human interventions and cut of ODS use have led to recovering stratospheric ozone over recent years (still on-going). The same for impacts on human health, mortality and most morbidity are irreversible if there are sustained levels of high exposures, but they can be reversed with low levels (-- > non-linearity of the impacts). Hence by default I put "irreversible" to all. For acidification, eutrophication and ecotoxicity, if emissions are cut thanks to human interventions, return to a previous state to some extent could be possible. For land use, I considered "soil quality" indicator in my answer (soil quality can be somewhat rehabilitated if appropriate human interventions are taken); if impacts on biodiversity were to be considered, "irreversible" should be considered. For metals/mineral, I put irreversible, only because the other option could not fit. We cannot go back to the previous situation, but can go to a new situation with different stocks and flows fo metal/mineral resources. Water can be replenished assuming proper human interventions (hence solely artificial); fossils are lost once combusted, hence irreversible impact (assuming a scarcity-based indicator). The time span of generated impact, when only addressing water scarcity itself, differs between surface water (very short) and groundwater (very long). As an example, when surface water abstractions are taken away, river water is restored immediately. When groundwater abstractions are taken away, it can take many years before groundwater aquifers are replenished. Therefore the time span cannot be defined when taking surface and groundwater together. The time span of regeneration of ecosystems depending on water can be many years. I therefore rate the current value of 60 not relevant. Therefore in sheet section 2 I give 0 as value. It is not clear what the baseline is. Should we consider whether the current level of the impact would be possible to reverse back to the pre-industrial levels, for instance, or should we consider whether at some point in the future there is a tipping point where it is not possible to come back. The difference between L1 and L2 is really high as L1 means recovery period less than 1 year, whereas L2 covers natural recovery from anything above 1 year. Therefore, L1 could mean 1 year recovery and L year recovery and the difference between those two cases would be only 20 points. It is also actually not so clear what is meaning of an impact. For instance, in the case that the impact causes deaths of people, it is not possible to bring those people back. Does it mean that the impacts is irreversible? Eco toxicity freshwater dependent of the kind of substance, waterbody. No general impact can be defined. Resource use, water depends on the regional and geographical background. No general conclusion on this impact can be made. Reversibility for resource use: I used a long term approach for my assessment. Fossils do get refilled - geologically. The description of the criterion is biased and vague: what is completely reversible (if there is global warming this may lead to extinction of species, however, the temperature increase can be completely brought back to prior level --> is this now completely or not?). Also: why is it of any problem that human intervention can reverse the impact if we speak about impacts that are only of relevance for humans (like resource use of metals)? Also: cancer is often not reversible if you look at the individual. However, why are you valuing the loss of a individual (cancer) higher than the loss of several species (e.g. 108
113 triggered by climate change)? With this you are also making a double-weighting: the severity of an impact is getting into this if you count loss of an individual) and the time aspect is covered in the time span. If you exclude severity (loss of life, species) and time all seem to be rather similar. The interruption of the pressure (i.e. Water consumption) allows for the natural flows to eventually return close to what they originally were. Human intervention is not necessary, except in some very specific case, i.e. Artificial recharge of groundwater, or added pulse or base flows to rivers, but in my view these could be achieved by interrupting human consumption as well (except it is not realistic). Some aspect, such as saline intrusion are less likely to be reversible. a point that is probably missing is whether the substance is persistent or not; how is this addressed? Eutrophication and acidification are natural processes. However, the human activity makes them much more intensive (in terms of spread and time span). It is true that the return to a previous situation is possible naturally, but often without the human intervention, the water and soil quality (biodiversity) is decreased permanently. I would suggest to change the reversibility into "Artificial (partial)". I think there's confusion here about the reversibility of the impact vs the situation - clearly, the impact (e.g. on Human Health) should generally be irreversible (dead people remain dead). The situation may be reversible - that's what I have rated here. Reflections of JRC on the comments received: It is correct that several overlaps can be identified e.g. between time span and reversibility and between reversibility and severity towards the safeguard subjects. However, as each criterion is also having very specific and distinct aspects to be considered, we think that all of them deserve to be taken into account. For example, even if impacts are expected to last for a long time, that does not indicate whether they are to be seen as irreversible or not. Reversibility is not seen to be limited to an individual but should take into account also aspects relevant to the entire population and the environmental conditions. It is correct that there are certainly significant variations due to different substances with different profile (e.g. related to persistency) contributing to the impact, which will alter the evaluation against this criteria. Generally speaking, the evaluations should reflect an average situation ( best estimate ) as much as possible. This refers for example to the substances causing the impacts. Comments on the criterion: Level of impact compared to planetary boundary I am not convinced of the concept of planetary boundaries. It is difficult to consider planetary boundaries for categories with a local impact For freshwater, and also some other ones, the local/regional boundary can be far transgressed, elsewhere not. Regionalization matters. For eutrophication in some regions N and P are removed and in other they are overloaded. So except for the addition of P applied as artificial fertilizers (N can be degraded microbially) which is additional, the planetary situation is neutral. For fossil fuels the use is many times larger than the rate of natural build up of fossil fuel. So many times above planetary boundary. On the other hand once we run out of fossil fuels the effect on climate change will be solved... I really wonder whether PB is the best framework to link to all the impact categories in LCA, as many of them are local or regional in nature (e.g. PM, land, water scarcity) and LCA integrates the results over space. The literature on PB is growing, but you should not disregard relevant criticism such as Nordhaus et al. 2012, Brook et al. 2013, Bass Instead of PB I would look 109
114 for an alternative metric of relevance or urgency, which would inevitably require expert judgement. That is what I understand you want anyway once I read the instructions given below. All in all, I would suggest that you consider carefully embracing this concept. I also wonder whether we should value urgency considering the current situation or current trends. CC might not have transgressed the PB, but we are on the way to transgress it by x2-4 Bass, S Keep off the grass. Nature Reports Climate Change, Brook, B. W., Ellis, E. C., Perring, M. P., Mackay, A. W. & Blomqvist, L Does the terrestrial biosphere have planetary tipping points? Trends Ecol Evol, 28, Nordhaus, T., Shellenberger, M. & Blomqvist, L., The planetary boundary hypothesis. A review of the evidence, Breakthrough Institute, Oakland. Resources consumption is proved to be beyond the carrying capacity of the planet (since resources as fossil are close to deplete, and mineral become more and more difficult to dig). Not clear why the value for ecotoxicity freshwater and eutrophication was so high (the highest of all). smaller rand i.e. 25 zo 89% seems to big spread For several categories, I cannot judge the level of impacts compared to planetary boundaries, and I do not agree with having the default values. There is no strong evidence about quantifying planetary boundaries for toxic impacts -none exists yet. Same with PM, ionizing radiation, metal resources (which can be recycled), photochemical ozone formation. Also how do you address the impacts on human health: human health is irrelevant to the PB concept, which only considers the state of the Holocene. Hence the values indicated for these categories as default (or filled in by participants) are totally arbitrary and subjective and the values for these impacts cannot be evidence-based (equivalent to throwing darts). Finally, taking the toxic impacts or water use impact categories, there is a strong spatial specificity, hence a planetary boundaries is somewhat meaningless. Therefore, despite being a relevant criteria for the weighting exercise, this is a huge problem here because it creates an important bias between the impact categories that are well aligned with the PB concept, for which we know where we stand, and those which are not, for which it is real guess work (see list above). To my opinion, this requires addressing before moving along with this criteria. Relevant literature: PB: Steffen W, Richardson K, Rockström J, Cornell S, Fetzer I, Bennett E, Biggs R, Carpenter S: Planetary boundaries: Guiding human development on a changing planet. Science 2015, 347:6223; PB and LCIA: Ryberg MW, Owsianiak M, Richardson K, Hauschild MZ: Challenges in implementing a Planetary Boundaries based Life-Cycle Impact Assessment methodology. J. Clean. Prod. 2016, 139: ; mismatch between footprints, LCIA and PB: Laurent and Owsianiak (2017) Potentials and limitations of footprints for gauging environmental sustainability (Under review in Current Opinion for Environmental Sustainability). correct as to the references on planetary boundaries Why were resources ranked so low? I do not agree! The planetary boundaries have been defined in a scientific process, and therefore, it is not needed to ask experts to ask the scoring as it is a matter of just checking the numbers from the paper. However, I'm not quite sure how the numbers should be determined to those impact categories that were not included in the planetary boundary paper. I didn't change the levels in this category as I trust that you have interpreted the planetary boundary paper correctly and I don't have any scientific evidence easily available to show the level of impact for those categories that were not included in the planetary boundary paper. Not all impact categories have a direct link to PB (cfr. Rockstrom et al, Steffen et al, e.g. resource use, metal and fossil; for HT and FET the threshold are not 110
115 available (so I choose "of the same order" below); I don t think this criterion needs an expert based judgment - a comparison with Steffen et al (2015) and other available values as reported in Sala et al (2016) value would be enough. For eutrophication there are 2 PB limits (N and P, with different values) Check Ryberg et al. J Clean Prod 139 (2016) For nearly no impact categories general conclusions can be made. They are related to the kind of impact and the background situation. It is absolutely impossible to compare the level of impact compared to planetary boundary with human health. Irrelevant for weighting because i) enormous uncertainty on the computation of planetary boundaries, which claimed to be science-based, ii) it is impossible to measure the distance to the planetary boundary for local spread impacts, where the planet is a irrelevant spatial scale It is difficult to apply this criterion to emissions that impact locally/regionally rather than having global impacts: for sure toxicity, POCP, PM is rather localized and not really impacting the air above oceans, deserts, most areas outside big cities/outside reach of sources, etc. Resources: besides water the planet does not need most of them This is highly location-dependent and the "global planetary boundary" for water is not relevant, as discussed in the updated PB litterature. However, in general it is indeed smaller than the local PB, whereas significant portion of human water consumption occurs in regions where the PB is already violated (33% on a monthly scale, 4% on an annual scale, representing 12 and <1% of surface area, respectively. Ref: Boulay et al, 2016, submitted). very big regional differences, a regional impact can not be compared to a planetary boundary, this criterion is useless Maybe because I missed the presentation but I am not fully sure how this should be evaluated; if I think the planetary boundaries concept is giving incorrect threshold information and if yes, I should indicate here the relation to a correct threshold? Main issue with current planetary boundaries is that it averages worldwide which does not address regional or local impacts correctly; which means also the relation of the (according to me) real threshold to the one of PB is, expressed in one value, using a global average for, e.g., particulate matter which I am not fully sure how to do, other than by gut feeling. Which does not fit to an evidence based method. This is not relevant for several of the factors Critical loads for acidification (especially terrestrial) are still exceeded in some regions in Europe and the US and in many regions in e.g. SE Asia. Planetary boundary is not a smart wording since it for many refers to the concept of the Stockholm Resilience Institute which only addresses some of the impact categories in LCA and notably none of the human health-related impacts. A reference to natural no-effect levels (or in the spirit of the planetary boundaries to the lower bond of the uncertainty range around these thresholds) would be more meaningful. The challenge is also that most of the impacts are regional or even local (e.g. water use) meaning that in some locations the impact is far below the threshold and in other locations far above. You should advice the panel members to base their scoring on a common perspective, e.g. their assessment of the global average situation in terms of exceedance of thresholds too generalized category if spatial differences are not taken into account Reflections of JRC on the comments received: The discussion around using the planetary boundaries in an LCA context are ongoing and range from support to use them to pointing out the difficulties in establishing them for more local/regional impacts and for impacts not related to the ecosystem health but for human health and resources. 111
116 It is correct that several overlaps can be identified e.g. between reversibility and planetary boundaries. Comments on the criterion: Severity of effects on human health I am not sure what severity implies here. Is it per person, or does it include magnitude on the total population? My understanding of the criteria is that there is disregard of the background situations to evaluate each impact. Because of the non-linearity of the impacts, the regional/local differences in the exposure to some impact categories and the possibly long-term impacts (e.g. climate change), essentially, all impacts have the potential to induce a high or very high mortality rate if there are high emissions and/or high exposure. So assessing the impacts without specifying the context is not really useful here. There is a need to consider the background emission loads and the total exposed population to evaluate overall severity of the impact (also accounting for regional variations in a global perspective, and the time span of the impacts). I can see this is not how the criteria are framed, hence I put "very high" to all: again, all have the potential to bring high mortality rate if levels of emissions and exposure is high enough. For overall magnitude of the impacts at global scale, see the Global Burden of Disease, split by different causes of death and disability ( DALYs associated with water consumption are associated with lower food production and malnutrition, which can be recovered (and mortality avoided) if proper nutrition is provided. Damages to human health may also be associated with water-related diseases, where mortality can be higher, however these concern only selected regions of the world, and are also associated with socioeconomic and WASH issues, in addition to infrastructure. In these cases, "High" would be appropriate, but because of the multiple causes, as well as the large diversity of contexts in the world, probably "medium" is more representative. Indirect effects considered as well (e.g. land use also impacts on human health, e.g. via heat islands in cities). These are not part of the cause-effect chains of the LCIA, but here we can input indirect effects Default 100 only when addressing no water availability to humans. However, water scarcity in a location refers to the people living under levels of water scarcity. Water for drinking water purposes can be imported to a region (eg bottled water) or water for food can also be imported. This is a difficult topic, I do not support a certain value for this, and therefore put in section 2 the value 0. Exclude, not sufficiently robust to be used Wrong! Of course acidification and eutrophication, ecotox of freshwater have an impact on human health! Non-cancer effects considered less relevant than cancerogenic. Why resource use is affecting human health (they could change the style of life, but very indirectly)? Indirectly also land use could affect health (e.g. Food shortage) I would say that all environmental impacts are related to human health at least indirectly. Also, ecosystem quality and resource availability are linked to human health indirectly. Therefore, a proper scientific way of creating weighting factors would be to convert everything to DALYs. It is true that the scientific evidence is not necessarily robust enough for converting all impacts to DALYs, but at least, it would be a better method than anything that is available at the moment. All methods have uncertainties, but at least the basis for the method would be more scientific than anything that is currently available. The uncertainties will be reduced once more scientific information becomes available. It is recommended to clearly define "human health". If "human wellbeing" as described in e.g. the Millennium Ecosystem assessment is included then adverse impacts on biodiversity (ecosystem services) should be included in the weighing. 112
117 Hence "Eutrophication", "acidification" (leading to e.g. the mobility of (heavy) metals in soils in some regions) and "ecotoxicity of freshwater" would warrant the score "low". In my opinion land use could affect human health in very low degree. Land use is a main driver of global biodiversity loss, so in this sense it affect also human health. The same situation is with regard to eutrophication. Bathing in contaminated water can cause certain health problems. So, also eutrophication could affect human health in very low degree. Ecotoxicity has been scored here higher than 0, because ecotoxicity can operate as early-warning of biological impacts of compounds to living systems, even when the human-health USEtox-type values are lacking The problem of eutrophication relates also to water used for recreational purposes. The skin problems can occur after contacting with the water (it can touch not only skin allergic, but all people) I used the global burden of disease source: Page 27 the most severe environmental risk factor for health impacts is air pollution. And within this impact 80% are non-cancer effects. ME_GBD2015_report.pdf All these midpoint categories lead to cancer and non cancer effects, so since the impact pathways are overlapping and not transparent, I left only these two impacts. The sum gives 100 so that there are no overlaps. Again here, some guidance would be useful on how to handle the sitedependency of the non-global impacts. Particulate matter has a very high severity where it occurs, but this is limited to major urban regions of the world, where the exposure is high. The present levels are often much less relevant than stated here. This is misleading. Many people e.g. will find cancer a severe danger. But, this is not due to environmental effect, but due to single issues like smoking, diet, sports. Climate change: the severity of effects on human health is dependent on the meteorological and geographical background. In polar regions it can be quite positive because the danger of frostbite is decreasing. In other regions in can be a negative effect based on rising temperatures. Ozone depletion and the effect on ultra violet radiation depends on the degree of latitude. Human toxicity, cancer and non-cancer effect, particulate matter/respiratory inorganics: if the European legislation is fulfilled the effects are negligible. Resource use water only can have an indirect effect on human health. No general conclusion on this impact can be made. The direct effect of resource use on human health is only related with the mining of resources. If all work safety measures which are given in the European safetyat-work legislation are fulfilled the effect is negligible. I do not understand what exactly you want to measure with this criterion, whether severity or prevalence. For instance, I had a conflict scoring ozone: ozone depletion showed to have severe impacts on human health but it is not an environmental problem anymore. I filled it in with "high severity", which has a strong influence on my set of weighting factors. Same happens with ionizing radiation. PM is one of the top causes of death worldwide, far more important than photochemical ozone Lack of water (in quantity) does very rarely lead to impacts on human health. It is the consumption of unsafe (toxic) water and unsafe sanitation what is harmful Relevant references are: Lim SS, Vos T, Flaxman AD, et al. A comparative risk assessment of burden of disease and injury attributable to 67 risk factors and risk factor clusters in
118 regions, : a systematic analysis for the Global Burden of Disease Study Lancet 2012; 380: Murray JL et al. Global, regional, and national comparative risk assessment of 79 behavioral, environmental and occupational, and metabolic risks or clusters of risks in 188 countries, : a systematic analysis for the Global Burden of Disease Study Lancet 2015; 386: Impacts on humans given to the use of abiotic resources are already counted in other impact categories This is a criterion that is a double-weighting: the result of an LCA should show how high toxicity etc. is, this does not need to be leveraged by an additional criterion It might make sense to weight each of the impact categories based on the endpoint impact characterisation factor. Despite the uncertainty, it should be a more scientific way of doing it compared to asking external experts. For instance, does each unit of water use, ionizing radiation, human toxicity and ozone depletion contribute equally to DALYs? That seems to be the case according to the scores above. Reflections of JRC on the comments received: The severity on human health is not seen to be limited to an individual but should take into account also aspects relevant to the entire population. It is correct that there are certainly significant variations due to different substances with different profile (e.g. related to persistency) contributing to the impact, which will alter the evaluation against this criteria. Generally speaking, the evaluations should reflect an average situation ( best estimate ) as much as possible. This refers for example to the substances causing the impacts but also to the background situation. Some comments suggested that modelling from midpoint to endpoint would be preferable as more science based over the chosen approach of surveys and expert panels. However, we also see the risk that going to endpoints has significant uncertainties, which might not be that visible and transparent anymore once the endpoint results are calculated and presented. Comments on the criterion: Severity of effects on ecosystem quality Note that the default value for ionising radiation and photochemical ozone formation are inconsistent. The impact category names clearly state "human health". Hence impacts on ecosystems quality should not be considered and marked here (else it is a bias). With that said, both ionising radiation and photochemical ozone formation leads to damages to ecosystems. But the fact that the ILCD LCIA method does not address those should be consistent with the weighting scheme here. Hence "non-existent" should be indicated as default. Idem for non-renewable resources: the current indicator do not encompass damages to human health or ecosystems, hence "non-existent" should be indicated there (same in "severity of effects on human health"). For the same reasons as for human health, I also put "very high" to all impacts. indirect effects considered as well (e.g. non-cancer problems to humans often do also impact on other mammals) Default value 100 is correct. Local water scarcity has a direct impact on local ecosystems. Delete, not sufficiently developed Climate change is affecting ecosystem probably as severely as for human health. Similarly for ionizing radiations. ODP is probably lower than GWP Note that agricultural areas affected by radionuclides (nuclear accidents) cannot straightaway be re-used, while diets may need to be adapted at least on a regional/local scale (mushroom, game, seafood ). Literature on impacts of the 114
119 Chernobyl and Fukushima accidents (and to a certain extent of 3-Mile island) gives varying information on the kind of and severity of impacts. In my view, application of the precautionary principle warrants a score "medium" rather than "low". Use of resources "very high" as they impede ecosystem services; which is part of next criteria? Some of these criteria cannot be correctly rated because it depends on urban/rural area Invasive species, both depending in climate and transport etc are highly disturbing locally and regionally. Important impact on eco. Further, radioactivity affects humans, but also long-lived protected mammalian species on red lists etc. the biology of impacts is alike, and it may have a population-level effect in those species Climate change effects on ecosystem are not fully analyzed yet, but increasing evidence of their influence are being investigated (see some literature as example). Therefore I changed the rating into: high. Resource use (fossil and mineral) do not impact ecosystems as such. In case you refer to the processes for their exploitation then this are different impact categories (e.g. ecotoxicity or water use impacts). Therefore I changed the rating into very low. Climate change and land use changes are the largest drivers of species extinction. See Rockstrom et al 2009 and e.g. this science popular paper. I couldn't find a precise statistic The sum gives 100 so that there are no overlaps. Same comment on spatial variability as for Severity of effects on human health. Specifically for ozone formation, you have formulated the impact category as Photochemical ozone formation, human health, and logically this category has no impacts on ecosystem quality (this would be covered under the impact category Photochemical ozone formation, natural vegetation, which is however not part of the ILCD method. Since you have given a default severity score that is different from zero, I assume that you inherently assume the impact category to be a proxy also of the impacts on vegetation, but this may not be evident to all contestants (given the name of the impact category J) Even if biodiversity problems are addressed here, I think it's important to have it as an impact category like proposed by Koellner, Thomas; Baan, Laura de; Beck, Tabea; Brandão, Miguel; Civit, Barbara; Margni, Manuele et al. (2013): UNEP-SETAC guideline on global land use impact assessment on biodiversity and ecosystem services in LCA. In: Int J Life Cycle Assess 18 (6), S DOI: /s z. Furthermore biodiversity is also catalogued as a critical process in the model of the planetary boundaries. Global warming can have negative effects in those regions where the yearly rainfall decreases, but it can also have a positive effect in regions where agriculture will be made possible by a decreasing number of frost day per year. Ozone depletion and the effect on ultra violet radiation depends on the degree of latitude. For non-renewable resources only the direct resource use has an effect on the severity of effects on resources availability. For renewable resources based on biomass land use can be affected at a high level Impacts on ecosystems given to the use of abiotic resources are already counted in other impact categories I considered the 'plastic soup' effect of resource use, fossil on the health of the environment. Anything that is toxic to mankind, is almost always toxic to certain animals Why particulate matter would not have impacts on animals or plants? And how could the fossil and mineral resources depletion possibly affect ecosystems? Emissions do, but not the depletion itself 115
120 Reflections of JRC on the comments received: It is correct that there are certainly significant variations due to different substances with different profile (e.g. related to persistency) or due to the local and regional differences contributing to the impact, which will alter the evaluation against this criteria. Generally speaking, the evaluations should reflect an average situation ( best estimate ) as much as possible. This refers for example to the substances causing the impacts but also to the background situation. It is correct that the ILCD midpoint impact categories used in the Environmental Footprint and for this webinar ionising radiation, human health and photochemical ozone formation, human health, are not covering impacts on ecosystem health but that there are also impacts on ecosystem health due to ionising radiation and photochemical ozone formation. Comments on the criterion: Severity of effects on resource availability Here too, I disagree with the default values, which are not consistent with the indicators of the ILCD method. I put "very high" in water and metal use indicators although there are variations across regions/countries (relevant for water) and variations across metals/minerals, added to the potential use of anthropogenic stock of metals/minerals, e.g. recycling, urban mining, etc. (relevant for metal use). "very high" for fossils, which are fully dissipated once used, also accounting for the limitations of the reserves. Climate change and freshwater ecotoxicity can lead to high effects on resource availabilities, in particular water resources. Same with eutrophication although to a lesser degree. Soil quality indicator for land use in ILCD does not have any effects on resource availabilities, although other land use impact categories can lead to effects to resource use (hence "non-existent"). Note also that, with exception of the 3 resource impact categories, none of the other LCIA methods currently address the impact pathways leading to damages to resources. It is however fair to incldue here because only midpoint indicators are considered (hence potentially capturing all subsequent impact pathways at a conceptual level). This is in my view very tricky and almost circular-reference with the two previous aspects (human health and ecosystems), since additional effects on resource availability not already captured by these two category is limited, and only concern fossil water availability. I would therefore set this aspect to "low". Resource availability is influenced by damages to ecosystem services. All the provisioning ecosystem services provide in fact natural resources to humans, therefore if they are damaged, the provision is affected Resources can be substituted -> the impact of using a resource decreases with substitutability, which is smallest with fresh water (or specific biota - if biodiversity/genpool is a resource) and highest with minerals). Ecotoxicity may reduce useable fresh water availability. climate change will have high impacts on biotic resources, probably higher than acidification and eutrophication Would be good to specify what resources are included under this category. Ionizing radiation can affect both terrestrial and aquatic food resources. Hence "medium". for some categories, quite complicated to rank If the severity of effects on resource availability has to be considered, including natural resources, then the impacts of land use and ecotoxicity are very high. For resource availability I referred to abiotic resources. Since the indicator is unclear, I couldn't find a reference so I used the abundance in mass as proxy. Water is way more abundant then the rest so this explain the values. The sum gives 100 so that there are no overlaps. I consider that long term climate change impacts on resources are counted within the (land, water, mineral, metals, fossils) categories Same as above for long term effects of pollution 116
121 I consider in the evaluation the impact even if it was in one single type of resource, like water for example, so no distinction if the impact of in one or more than one resource. see before - plus why is that of any relevance for an LCA? Isn't that an economic criterion? since biotic organisms can provide resources, e.g. wood or food products, anything that damages ecosystems also damages resource availability Reflections of JRC on the comments received: Some comments suggested that there is an overlap between ecosystem health and biotic resource provision, which certainly is true. However, currently the methods for resource use mainly cover metals, minerals and fossil fuels, not biotic resources. Comments on the assessing of the relative importance A1 A2 A3 A4 - My grades are primarily based on the uncertainties in filling in each criteria. For example, about the level to PB, although it is conceptually highly relevant, the current setting of the criteria does not allow a fair assessment and to prevent biasing the results, I preferred decreasing its relative importance in the calculation. I apply the same principle to reversibility and the severity assessments, for which some aspects can be questioned (see my specific comments in Section 1 table). - Note the comment I made in Section_1, cell I34, that the range of values used can be questionable. The grading scale and pre-defined ranges of the criteria will predominate in the final weighting score. Hence a large part of the weighting scores is in fact already pre-defined and not subject to the expert judgement." This is a general comment that can apply to all criteria of the table. The pre-defined numeric values that are used for the computation have a strong influence on the final results (see, e.g., photochemical ozone formation score in Results) - looking at the final score, I actually disagree with the results. For example, the high score obtained for ozone depletion is not realistic. This also indicates that some criteria are misrepresented or missing (the low weight on PB does not explain this trend). - In light of the alh the concerns I raised in Section 1 and above, I recommend to clearly indicate the large uncertainties and source of bias associated with the results. - General comment on weighting: I recommend the reading of the following paper Itsubo et al. (2017) Development of weighting factors for G20 countries explore the difference in environmental awareness between developed and emerging countries DOI /s z. This can bring relevant and useful perspectives to your work. I have assigned value of 0 to all criteria related to severity, because I think the perspective of severity of effects is inherently incompatible with the perspective of planetary boundaries. This is because planetary boundaries is based on the hypothesis that the relationship between pressure and impact is (generally) not linear. From this perspective, a constant factor translating between midpoint and endpoint indicator scores does not make sense. A criteria on the severity of exceeding planetary boundaries would have been more relevant from a planetary boundaries perspective. The spread of impacts is not such a relevant criteria in my view as some aspects may be much localized, yet represent very important ecological functions. I believe there is a redundancy between "time span" and "reversibility", as the former really quantifies the degree of the later. The values for the 3 AoP are purely based on personal values, and I would rather favor decisions based on reversibility/time span and planetary boundary, than on individual preferences. Lastly, seeing the results (and having assessed only water use), there is obviously a discrepancy in the way that I assessed the criteria and the default assessment, as several categories should be still lower than water use in my view. Ecosystems affect both human well-being and resources availability (provisioning ecosystem services), therefore I value quite important the severity of the effect on ecosystem quality. Why there is no effect on human well-being? There is no attempt to achieve a quantification of the impacts on human well-being via the calculation of some well-being indicators. 117
122 A5 A6 A7 A8 A9 A10 A11 A12 A13 A14 a) I used a rather standardized approach on this page: 100 pts for key elements, 33 pts for secondary elements. b) I totally agree with the panel which lead to the weighting of safeguard subjects in EI'99, which gave higher weight to Human Health and Ecosystem Quality, compared to resource availability (due to sustainability aspects, which are not asked as a separate criterion). c) The methodology used here leads to a single digit spread of weights (relation of weights, from highest to lowest weight). Our experience (for Swiss UBP) shows the importance of tests, as results of application may of course contain surprises, but should not be totally implausible, as it is a weighting method and not pure natural science. (This statement of mine is not contradicting the need for such a method - on the contrary. Testing is only one step necessary.) d) In practice, it is interesting is to compare the relative weights according to various weighting methods. (I did a quick check re Swiss UBP'13, which will spread more than your approach). This is only interesting - there is no right or wrong (only more or less plausible, but of course depending from standpoints). Your approach will certainly help to assess LCAs/PEFs in practice. Great, important work! e) There should be room for additional environmental damage pathways, such as Ecotox via other media (e.g. sea; soil), noise (e.g. to human health, but also underwater noise); hormonal effects (both to humans and to animals)? In my view, a method will at a given time always cover only a limited number of impacts, and to pre-define a list is of course necessary, but it should be open to be amended - in such a process, and of course over time. It's not clear how "level of impact compared to planetary boundary" would not be duplicated in the three severity criteria. See earlier comments about including human health and ecotoxicity. See ongoing work from USETox as reference. Several of the CF's for human tox and ecotox are labelled "Interim" and does not exist for a number of substances Human health matters for the political significance of LCA results, but from an ecological perspective, human populations are not as endangered as many other species. Resources are often exchangeable or substitutable, but extinction is forever. These are difficult to score as aspects are not comparable. As a general comment I would say that this is an interesting exercise and interesting idea, but requires a lot of development. It would be a good idea to have a common unit (e.g. DALYs) to which all impacts would be translated by using the best scientific knowledge available. I don't think that it is the best way forward to ask people's opinions (even if the people are experts). Everything should be backed up by scientific publications and then the method can be reviewed by experts. Anyway, this proposed approach is already a step forward from the previous exercise where LCA experts were asked to rank the impacts and give weights from scratch. A weakness of the current method is also that the final weights range only from 1 to 10, whereas in reality the some impact categories may be 10,000 times more important than others. I think they should all have an equal weighting, but have lowered the weighting for Level of impact compared to planetary boundary due to difficulties with its assessment Using PB is a mix of methods, where traceability is not yet understood - the linking and implications across the different categories. Some are like a bit overlapping, e.g. Reversibility is related to time span. I am not sure about "Level of impact compared to planetary". Effect on ecosystem seems too general. The severity of effect on human health and ecosystem quality has the highest importance because it determines directly the life time of people and animals/plants species. The sever pressure results in exceeding the lethal concentrations and human acute toxicity doses what leads to interruption of living organisms life. The severity on resource availability seems to have less importance since this is a subject of intensive technological improvement and the human dependence on resources can change (decrease) in future. Not only technological solutions, but also the behavioral changes (promoting dematerialization and de-consumption, extending durability and use time of products) can also reduce a demand for resources. Time span and geographical spread have lower importance because I would assess as better the case of widely spread and long term effect with low severity (fast recovery, no mortal effect) than the regional/local spread and short/medium term effect with (very) high severity. The first situation results in increased quality of life/life disability, but the life is still maintained. I recognize the level of impact compared to planetary boundary and the reversibility of impact as related criteria. The second one is a consequence of primary mechanism and a way how the environmental impact/effect/damage is formed, however in a situation where the ecological equilibrium is permanently impaired, the reversibility of impact can also be disturbed. Time span is somewhat included in reversibility, so could even be ignored 118
123 A15 A16 A17 A18 A19 A20 A21 A22 A23 A24 A25 A26 I consider "Spread of impact" and "Reversibility of impact" as very important categories. However, following the comments entered in Section1, given the score assigned any weighting factor attributed to these two criteria will affect only marginally the Results - much less than any change for the other criteria. I am wondering if "Spread of impact" and "Reversibility of impact" should not be instead considered as early discriminant in the impact categories selection. I found the following paper a very interesting reading. Let me to suggest it in case you have not already seen it: Steinmann et al. How many environmental impact indicators are needed in the evaluation of product life cycles? Environ. Sci. Technol. 2016, 50, At a planetary level reversibility is the most relevant criterion. The low value to the planetary boundary criterion depends on the high uncertainty. Evidence: biodiversity has been decreasing and disappearing, as documented by several publications, but the human population is still increasing and also the average expected lifetime, therefore the severity of effects on human health should be scored less. The concept of planetary boundaries seems not developed enough and not unique in its understanding, therefore I would take that only into minor account. Here I think the only trade off possible is between the three non-overlapping endpoints. Spread of impact refers to intragenerational equity, where I assume all people and places equal so the value is zero. Same for Time span and Reversibility, they refer to intergenerational equity and I assume future generation (even in 1 million years) equally important as us, so the value again is zero. Planetary boundaries have to do with the previous issues so this is overallping and honestly I was unsure about how to use it so I skipped it. Then, human health and ecosystem quality are for me prime concerns so I gave them equal weight, I left some points for resources availability but only because water is included (minerals and fossil fuels can be substituted). So actually this is the real value choice. I think there should be different sets of weighting to take into account of the relative importance given to the different criteria, something like the different cultural perspectives included e.g. in ReCiPe (egalitarian, hierarchical, individualist which give a different weight to the areas of protection) - in this case, the different sets could take into account of different relative importance given to the different criteria, e.g. spatio-temporal elements (first 2 criteria), reversibility and absolute reference (second 2 criteria), cultural perspective (last 3 criteria) Reversibility is closed related to the planetary boundary; in fact in their model, Steffen et al. also propose the zone of uncertainty, which would mean irreversibility. The level of impact compared to planetary boundary is given the highest weighting because if the planet cannot return to a habitable state then to a certain extent the other factors become irrelevant. Maximum weight to the endpoints HH and EQ, since the prevalence (not the severity!) of the impacts is what guide my decisions. I do not care about resources in the manner it is today included in LCA. I do not like at all the planetary boundaries concept in the (comparative) context of LCA. 50 for the other three criteria, even though I do not manage to differentiate well between time span and reversibility of impact Planetary boundaries have a low level of granularity, distances to goals are difficult to measure There seems to be a mistake in the result generating algorithm, as impact categories marked as "Do not evaluate" still appear (having the default weighting) since reversibility also involves time, I suggest to integrate it with time span; comparison to planetary boundaries not possible The way the different criteria are accounted seems biased so far. Indeed, by summing each criteria you can end up with significant weighting factors despite the emissions has no impact neither on human health nor ecosystem or resources. I would rather consider grouping severity together on one side, level of impact compared to planetary boundaries from another side and in a last group spread, time span and reversibility. Then each of these group should be multiplied by each other: --> if not severe at all --> low weighting factor --> if very far from planetary boundaries --> low weighting factor --> if local, time limited and reversible --> low weighting factor In order to be significant, you would need at least to have real impacts (severity) and to be at a minimum level compared to planetary boundaries. 119
124 A27 A28 A29 A30 A31 A32 A33 Why is there no weighing at endpoint level? I think the severity of the impact is most important. Given also the fact that I reason that sustainability is anthropocentric (see reference at the end of the text) but ecosystems and resources are needed for mankind, I put most emphasis on human health. I also consider ecosystem quality of more relevance given the considerable empathy we have towards living organisms. The other aspects do not seem that relevant and ideally they are taken into account in the severity computation. Schaubroeck, T., Rugani, B., Verheyen, K., Dewulf, J., Muys, B., Focusing on sustaining human well-being; a rationale for an anthropocentric sustainability concept, in: Setac Abstracts Meeting. Presented at the SETAC Europe 25th Annual Meeting, Barcelona, Spain, p The spread, time span and reversibility of impacts should be embedded into effects (characterization factors) on HH and EQ I think human health should be evaluated using LCA only in very specific situations - in most cases, other tools will work much better than LCA. Reversibility of impact: For this criterion to be relevant it should specify whether the impacts are reversible in a meaningful time frame (e.g. 1-2 generation(s)). For instance, I fail to see the rationale behind CC having 40 points in this category if it would take centuries to reverse the impacts. I provide considering reversibility over meaningful time frames. PB: As I mentioned in the first section, I think it would be better to have an indicator of relevance or urgency instead of this criterion. This should consider trends rather than the current situation. Here I score urgency rather than the closeness to PB. I want to really stress this. Using distance to policy targets here as proposed in the original Soares paper might be a better way to express urgency. The results should also be weighted in terms of the robustness of the data I think that the above mentioned criteria have all the same weight General comment that applies here and to the other criteria: it is a bit hard to have a homogeneous understanding if you are talking about, e.g., reversibility IMPACT, while some impact categories are actually ASPECTS (i.e., resource USE). I miss the aspect of public attention for the topic, which should be included in the assessment. For agriculture for example the issues climate change, acidification, eutrophication and land use are very well known. On some of the other env. Issues there may be an impact, but hardly any data available to monitor the topic and no media attention for the topic. So it is not so relevant to include these in the LCA. So next to weighting, I would also consider identification of a limited selection of impact categories that can be measured in a reliable way and are well known for the product category and can actually be affected by the industry (so the impact does not occur very far in the background) Reflections of JRC on the comments received: It is correct that several overlaps can be identified both on the level of safeguard subjects (human health, ecosystem health and natural resources) and on the level of criteria, e.g. between time span and reversibility or between reversibility and severity of impacts towards one of the three safeguard subjects. However, as each criterion is also having very specific and distinct aspects to be considered, we think that all of them deserve to be taken into account. Some comments suggested that modelling from midpoint to endpoint would be preferable as more science based over the chosen approach of surveys and expert panels. However, we also see the risk that going to endpoints has significant uncertainties, which might not be that visible and transparent anymore once the endpoint results are calculated and presented. One participant missed the aspect of the public attention for the various impacts. However, this webinar based on expert input is only one part of the efforts to derive a weighting set, which is not focused on the aspect of public awareness. The overall weighting set will take into account also results from a survey of LCA experts and the general public. Comments on single impact categories Comments on the impact category: Climate change Climate change does not have a "low" effect on ecosystem quality [1][2] 120
125 Risbey, J. S., & Kandlikar, M. (2007). Expressions of likelihood and confidence in the IPCC uncertainty assessment process. Climatic change, 85(1-2), Human health effects include direct effects like fatal heat stress, and indirect ones via e.g. desertification and bushfires. Over 100 people died in Victoria, Australia in recent bushfires which were more intense than any previously observed. Desertification due to climate change is equivalent to loss of ecosystem function. In Australia and the USA it already means increased bushfire incidence (Nature Ecology & Evolution 1, Article number: 0058 (2017) doi: /s ) with catastrophic consequences to resources and ecosystems. The reversibility of climate change is a tricky one as at some point the consequences of climate change may become irreversible. It was mentioned during the webinar that we should consider the current level of the impact, so I'm not sure whether the aim here is to consider whether the current level of climate change is reversible. However, what would be baseline in that case? Would it be to the levels before industrialisation? I don't think that it is a good idea to consider only the current level of the impacts, but it would be better to also take into account the trajectory. Regarding severity of effects on ecosystem quality, again the baseline is the issue. Should we consider whether future impact will change the quality of ecosystem? Climate change will definitely have a major impact on ecosystems as it will alter the species distribution and many species will become extinct. I would also rank the impact on resource availability high as climate change will have a major impact on water availability. I considered the aspect related to climate change impact on risks posed by chemicals because I have been working on this. About climate change, any prediction is highly uncertain and when it comes to chemicals risks this prediction combines several inputs with their uncertainty. References: Landis et al., Ecological risk assessment in the context of global climate change, Environmental toxicology and chemistry DOI: /etc.2047 Balbus et al., Implications of global climate change for the assessment and management of human health risks of chemicals in the natural environment. Environmental Toxicology and Chemistry DOI: /etc.2046 Some recent literature: "Incorporating climate change into ecosystem service assessments and decisions: a review" Runting, Rebecca K.; Bryan, Brett A.; Dee, Laura E.; et al. GLOBAL CHANGE BIOLOGY Volume: 23 Issue: 1 Pages: 28-41, JAN 2017 / Going with the flow: the role of ocean circulation in global marine ecosystems under a changing climate. By: van Gennip, Simon J; Popova, Ekaterina E; Yool, Andrew; et al. Global change biology Published: 2016-Dec-09 CC is irreversible in a time frame that matters. It would take decades/centuries to decrease the concentration of GHG in the atmosphere even if stopping the pressure right away. Yet concentration is a state indicator, so the time gap to reverse impacts would even be higher. Comments on the impact category: Ozone depletion Ozone depletion affects productivity of crops and therefore will have an impact on resources availability The reversibility is relatively slow, so I think that the score for reversibility should be higher than 20, therefore, I selected L3 even though by definition it should be L2. ozone depletion and climate change are related, so they cannot have very different weights Comments on the impact category: Human toxicity, cancer effects 121
126 Human toxicity characterisation factors are insufficiently developed and robust to be included Given that we have no indicator of toxic effects on terrestrial ecosystems in this list, (only freshwater ecotoxicity) it seems appropriate to include some effects on ecosystem quality here, as a proxy for TETP. I appreciate that the exposure models reflect human consumption of food, but prior to that they are based on compartment concentrations which affect all the animal species that breathe air and drink water from those compartments. Furthermore, the estimation of human health impacts is usually based on animal toxicity tests! The variability in USEtox results is something like 18 orders of magnitude, the variation in the human pathways is not that large Something that causes cancer in humans, most likely causes cancer in other species too. Therefore, I changed the effect on ecosystem quality to very high. Considering the carcinogenic chemicals: I think the relevance in terms of planetary boundary is quite high as it is a widespread concern (statistics show that) but it is a concern only on populated areas. I think this category impacts also environmental quality as many carcinogenic chemicals are also toxic to organisms other than humans. And the spread of carcinogenic chemicals of course impacts resource depletion. WHO provides a list of chemicals classified as carcinogens, and some of them may end up also in the environment. Eventually, human tox is being over-represented with 5 categories that explicitly relate mainly to HH In my opinion including human toxicity as an impact category and the other ones concerning human health (e.g. photochemical ozone formation) is kind of mixing up midpoints and endpoints. I agree that it's important to take into account the severity of effects on human health but this is addressed with the corresponding criterion (Severity of effects on human health). method not sufficiently robust to assess local impacts as emissions are not regionalized or local conditions are not known A problem most relevant for toxicity (human and Ecotox) is that the accuracy of the data is not taken into consideration. Impacts in Ecotox assessments can vary 4 orders of magnitude. I considered, if it is toxic to humans it is also for other organisms/ecosystem Anything that is toxic to mankind, is almost always toxic to certain animals Thinking about endocrine disruptors or phthalates or mixtures I think again these impacts may be relevant also for the environment and may deplete environmental resources. References: Wang, H., Liang, H. & Gao, D. J. For. Res. (2017). doi: /s Kole RK, Banerjee H, Bhattacharyya A, Chowdhury A, Aditya Chaudhury N. Photo transformation of some pesticides. J Indian Chem Soc. 1999;76: Comments on the impact category: Human toxicity, non-cancer effects method not sufficiently robust to assess local impacts as emissions are not regionalized or local conditions are not known A problem most relevant for toxicity (human and Ecotox) is that the accuracy of the data is not taken into consideration. Impacts in Ecotox assessments can vary 4 orders of magnitude. I considered, if it is toxic to humans it is also for other organisms/ecosystem; the category "non-cancer" is subjective, since it include a lot of substances with different toxic characteristics Anything that is toxic to mankind, is almost always toxic to certain animals 122
127 Comments on the impact category: Particulate matter/respiratory inorganics Particulate matter does not have a "non existent" effect on ecosystem quality, as shown in the EPA report (section 2.5.3)[3] 720&CFTOKEN= This is the most important mid-point in my opinion. [Steen, B. (2016). Calculation of Monetary Values of Environmental Impacts from Emissions and Resource Use The Case of Using the EPS 2015d Impact Assessment Method. Journal of Sustainable Development, 9(6), 15.] See: Kumar Rai, Impacts of particulate matter pollution on plants: Implications for environmental biomonitoring. Ecotoxicology and Environmental Safety, 129: If the time span of the impact is very short term, it means that the reversibility has to be shorter too. I changed the severity of effects on ecosystem quality to high as particulate matter affects animal species too. Impact of air pollution may act on the depletion of environmental resources: I would not feel like totally discarding this. Duan, K., Sun, G., Zhang, Y. et al. Climatic Change (2017) 140: 259. doi: /s Particulate comes from both global sources (carried by the wind) and local sources (mainly heating systems and cars). About aerosol and health impacts. There is an increasing evidence of particulate neurotoxicity related to Particulate Matter chronic Exposure [REFERENCES: Maher et al. (2016) PNAS doi/ /pnas Best et al. (2016) PLoS ONE 11(2): e doi: /journal.pone Casazza et al. (2016) Journal of Environmental Accounting and Management 4(1) 85-98, doi: /JEAM ]. About impacts on ecosystem quality, aerosol emissions change the characteristics of precipitation (i.e.: precipitation suppression + increase in precipitation intensity), which directly affects soil erosion (and, so, fertility). Impacts also occur in relation to quality of water bodies, also for pristine basins [REFERENCES ABOUT PRECIPITATION REGIME CHANGE and CHANGE OF WATER QUALITY: Ramanathan et al. (2001). Science 294 (5549), Rosenfeld (2003). Science 287(5459), Casazza and Piano (2003). Annals of Geophysics 46 (2), pp Khain et al. (2005). Quarterly Journal of the Royal Meteorological Society 131(611), Rosenfeld and Bell (2011). J. Geophys. Res., 116, D20211, doi: /2011jd Fan et al. (2015). Geophysical Research Letters 42(14), Seinfeld et al. (2016). PNAS 113(21), Casazza et al. (2017). Journal of Environmental Accounting and Management 5(1), doi: /JEAM ]. Particulate Matter should not be considered as an impact category but as part of Human Toxicity method not sufficiently robust to assess local impacts as emissions are not regionalized or local conditions are not known Double counting [HumanTox] I considered, if it is toxic to humans it is also for other organisms/ecosystem if it damages human health it will also damage other animals (especially mammals), for the impact on plants see e.g. "Particulate pollutants are capable to degrade epicuticular waxes and to decrease the drought tolerance of Scots pine (Pinus sylvestris L.)" Population exposure to dangerous levels is very uneven at country level. See "Horalek et al. 2016: European air quality maps of PM and ozone for 2013 and their uncertainty" for EU countries, so I wonder the default score in 'spread of impact' is justified. 123
128 Comments on the impact category: Ionizing radiation, human health It is not consistent that even though the impact category is called "ionizig radiation, human health" the severity of effects on ecosystem quality is scored too. Following the same logic, the human toxicity and particulate matter impacts should be scored for ecosystem quality too. Comments on the impact category: Photochemical ozone formation, human health It is not consistent that even though the impact category is called "ionizig radiation, human health" the severity of effects on ecosystem quality is scored too. Following the same logic, the human toxicity and particulate matter impacts should be scored for ecosystem quality too. Comments on the impact category: Acidification Acidification's effect on ecosystem quality is either "high" or "very high", and recently discovered indirect effects increase ecosystem depletion more than previously predicted [4][5] Fish resources Compared with the extent of acidification problems in the 1980s, agreements like LRTP have lowered the severity of this issue. Acidification has indirect impacts on human health due to the fact that acid rains have an impact of food production and water quality. I would say that it is important to consider the indirect impacts too as otherwise it lowers the scoring of this impact category as the impact for human health is zero. acidification affects the solubility of heavy metals with important effects both on human health and on ecosystem quality Comments on the impact category: Eutrophication Fish resources The spread of the impact in this case is a bit complicated as ocean eutrophication has widespread impacts. Also, reversibility is rather complicated as an extreme eutrophication can cause the death of most species in the lake/ocean. I don't know how long time it would take to recover, and potentially some species would not come back, e.g. if the eutrophication would cause extinction of some species. Eutrophication processes (in water bodies) connected to cyanobacteria and Harmful Algal Blooms are reported in Europe and their toxicity for humans is assessed [REFERENCES: Rao et al. (2002) Journal of Environmental Biology 23(3), Zanchett and Oliveira-Filho (2013). Toxins 2013, 5(10), ; doi: /toxins La Barre et al. (2014) Marine Cyanotoxins Potentially Harmful to Human Health, in Outstanding Marine Molecules: Chemistry, Biology, Analysis (eds S. La Barre and J.-M. Kornprobst), Wiley-VCH Verlag GmbH & Co. KGaA, Weinheim, Germany. doi: / ch01 Lévesque et al. (2014). Science of the Total Environment , Backer et al. (2015). Toxins 7(4), ; doi: /toxins Gkelis et al. (2015) Mar. Drugs 13(10), ; doi: /md Teta et al. (2017) Environ. Res. Lett. 12 (2017) , doi: / /aa5649] Cosme and Niero (2017) J Clean prod 140, Regarding the impact of eutrophication on human health see the work of the WHO (2003; Eutrophication and health; ISBN ) Cyanotoxin production by cyanobacteria often occurs in eutrophic lakes with severe effects on human health 124
129 Comments on the impact category: Land use The effercts of land use change on human health are not non-existent. See: Myers, S.S Land Use Change and Human Health. In Integrating Ecology and Poverty Reduction: Ecological Dimensions. Carter Ingram et al. (eds), New York, NY: Springer. Again, there are many indirect impacts on human health too. Reversibility depends on the degree and scale of initial land degradation: weight provided relates to a very common case, where impact gets to a point where it is not naturally reversed. As for effects on human health, soil degradation and crop failure is a key pathway to malnutrition and human health impacts. Bos et al The change in ecosystem services has effect on well-being (thus also health), Please also read "Progress toward an LCA impact assessment model linking land use and malnutrition-related DALYs" The level of importance of certain criteria may vary regionally Comments on the impact category: Ecotoxicity freshwater I fear bioaccumulation in fish spread to humans, the plastic waste in the Oceans, but so far the issue on severity needs more research. Ecotoxicity characterisation factors are insufficiently developed and robust to be included Again, there are many indirect impacts on human health too, especially if the toxic water has been used as drinking or irrigation water. method not sufficiently robust to assess local impacts as emissions are not regionalized or local conditions are not known A problem most relevant for toxicity (human and Ecotox) is that the accuracy of the data is not taken into consideration. Impacts in Ecotox assessments can vary 4 orders of magnitude. For human effects I consider that freshwater products are consumed by human (in human diet) if ecotoxicity occurs, effects on human health are also likely to occur Comments on the impact category: Resource use, water Water diversions are potentially completely reversible. The ecological damage may take longer to repair, for example if water control barriers are not demolished. But the hydrological scarcity response to the use pressure itself can be rapidly eliminated. Regarding human health, while sudden drought can impact human health, people can adapt when upstream users overuse water (the rate of change is slower), so the severity of impacts is lower than it is on ecosystems Water impacts are mostly through food security, and it's water withdrawals for this that are generally the cause of the problem. This is not actually that widespread. See: Brauman, KA, BD Richter, S Postel, M Malsy, M Flörke (2016) Water depletion: An improved metric for incorporating seasonal and dry-year water scarcity into water risk assessments. Elementa: Science of the Anthropocene 4(1). Similar to my comment on human health - actually the issues on resource use are addressed under the criterion "Severity of effects on resources availability". Big differences depending on region, should be weighted based on regional circumstances the impact of water use are considered really high however the natural cycle of water exists but can only be influenced by mankind The level of importance of certain criteria may vary regionally Comments on the impact category: Resource use, mineral and metals Rustad, J. R. (2012). Peak nothing: recent trends in mineral resource production. Environmental science & technology, 46(3),
130 Use of fossil fuels does not directly impact ecosystem quality, unless you mean by mine discharges etc. These tend to be very local, even if there is a global shortage of resources. I'm not quite sure what the direct impact on human health here is. Is it something to do with mine workers? Concerning the time span and reversibility, I selected the same category than Resource use, fossil, as I don't see the reason of any difference I consider that the use of minerals and metals, implies large amounts of soil or rock destruction Resource use has no direct impacts on human health or ecosystem quality. It is either the pressures related to extraction (e.g. land use, acid mine drainage) or the emissions arising from the use (e.g. PM, GHG, SOX). These are accounted for in other impact categories such as PM, CC, etc. If we take fossil fuels use in connection to CC, we be accounting the same twice. I would argue that resource use should be considered in relation to scarcity, which could have indirect impacts on humans by disrupting the economy. Yet I wonder if indirect impacts should be considered when you have a criterion on 'severity of effects on resources availability'. Comments on the impact category: Resource use, fossils Short term and natural partial reversibility IF abiotic oil is still somehow created inside Earth. [Kutcherov, V. G., & Krayushkin, V. A. (2010). Deep seated abiogenic origin of petroleum: From geological assessment to physical theory. Reviews of geophysics, 48(1).] Fossil resources are currently being substituted en mass by renewable energy, so I don't think the effects of resources availability is high. Use of fossil fuels does not directly impact ecosystem quality, unless you mean by mine discharges etc. These tend to be very local, even if there is a global shortage of resources. I'm not quite sure what the direct impact on human health here is. Is it something to do with mine workers? This criterion is highly correlated with climate change and should not be considered. Resource use has no direct impacts on human health or ecosystem quality. It is either the pressures related to extraction (e.g. land use, acid mine drainage) or the emissions arising from the use (e.g. PM, GHG, SOX). These are accounted for in other impact categories such as PM, CC, etc. If we take fossil fuels use in connection to CC, we be accounting the same twice. I would argue that resource use should be considered in relation to scarcity, which could have indirect impacts on humans by disrupting the economy,. Yet I wonder if indirect impacts should be considered when you have a criterion on 'severity of effects on resources availability'. Reflections of JRC on the comments received: Some participants questioned the robustness of specific impact categories, e.g. the toxicity categories, or the applicability of e.g. the resource use category in an environmental footprint context. We judge that while being aware of the challenges that environmental assessments pose and of the existing uncertainties better informed decisions can be made by including these impacts rather than by excluding them from the Environmental Footprint. 126
131 Annex 12. Midpoint to endpoint and monetisation Among the approaches discussed over the development of this study, two are further presented here: Midpoint to endpoint weighting sets The different EF midpoint indicators are pointing towards the three main areas of protection (Human health, ecosystem health and Natural resources). However, the recommendation for life cycle impact assessment are not yet seen robust at the endpoint level and only midpoint models are proposed for EF. The basic idea behind the proposed midpoint to endpoint weighting set was to highlight the relative importance of midpoint indicators in light of their contribution to endpoint impact categories. The two reported sets are proposals coming from experts involved in the pilots and were considered in the evaluation of the different sets for their possible contribution to the identification of a suitable set. However, in the case of Ponsioen and Goedkoop 2015 the coefficient used for moving from midpoint to endpoint are not based only on severity of the impact but on the magnitude of the underpinning emissions. For example, in Ponsioen and Goedkoop 2015, the 44% for climate change is the result of a sort of normalisation at the endpoint (taking as starting point the normalized figure for climate change at midpoint, multiplying this for a coefficient reflecting the potential Daly or PDF associated to the midpoint and then summing up the different contributors to the overall Daly). This results in a weighting set which is affected by the magnitude of current emission much more than by an estimated severity thereof. Ponsioen and Goedkoop 2015 proposed an equation to determine midpoint weighting factors based on midpoint to endpoint factors, a midpoint normalization reference, and endpoint weighting factors. The equation was applied to the ReCiPe and Impact method frameworks, but also to the ILCD recommended methods though some gaps were filled with ReCiPe methods. The calculated midpoint weighting factors are extremely different from those based on any other method to determine midpoint weighting factors. When using endpoint information, the relevant impact categories are in most cases climate change, human toxicity, particulate matter, and fossil depletion, while land use is mainly relevant for agricultural products. The other impact categories are in most cases negligible. The share of the relevant impact categories highly depends on the impact assessment method, the normalization reference and to a lesser extent the endpoint weighting factors. Ponsioen & Goedkoop 2015 (%) Impact Category midpoint to endpoint Climate change 44.3 Ozone depletion 0.03 Human toxicity, cancer effects 1.41 Human toxicity, non-cancer effects 4.33 Particulate matter/respiratory inorganics 7.95 Ionizing radiation, human health 0.27 Photochemical ozone formation, human health Acidification 0.17 Eutrophication terrestrial Eutrophication freshwater 0.04 Eutrophication marine Land use Ecotoxicity freshwater Resource use, water 3.22 Resource use fossils Resource use, mineral and metals na na 127
132 Humbert 2015 proposed another method in the context of the OEF retail pilot. This method is applied as a sensitivity analysis and as an alternative to the PEF/OEF normalisation and weighting approach to identify most relevant impact categories. Instead of normalising at midpoint to identify most relevant impact categories, this second method suggests to convert the different impact categories contributing to similar area of protection (human health or ecosystem quality) in a similar unit that can be directly compared in absolute value (using damage units such as DALY for human health or PDF m 2 y for ecosystem quality). In a first step, the impact categories climate change, water resource depletion, and mineral, fossil and renewable resource depletion are kept as three additional independent impact categories at midpoint since it is more difficult and uncertain to group them with other impact categories as either impacting human health or ecosystem quality. In a second step, it is still possible to use a damage approach to assess the overall importance of climate change and water resources depletion in terms of contribution to damage to human health or ecosystems as compared to the contribution of the other impact categories that are expressed in DALY or PDF m2 y respectively in the first step. Some midpoint categories such as ozone depletion or photochemical ozone formation are contributing to both impacts on human health and ecosystems but current knowledge in LCIA only allows expressing them for human health. The uncertainties associated with the different conversion factors from midpoint to damage or simplifications due to damage assessment have to be kept in mind during results interpretation. 128

133 129
134 Monetisation Even if monetisation approaches are still considered in need of further refinements (e.g. by the Unep- Setac working group on normalisation and weighting, Pizzol et al 2016), an approach has been taken into account in this overview (Stepwise, based on Weidema et al 2009) which is the one able to cover an higher number of impact categories at midpoint compared to other monetisation sets. Impact Category Climate change Ozone depletion Human toxicity, cancer effects Human toxicity, non-cancer effects Particulate matter/respiratory inorganics Ionizing radiation, human health Photochemical ozone formation, human health Acidification Eutrophication terrestrial Eutrophication freshwater Eutrophication marine Land use Ecotoxicity freshwater Resource use, water Resource use fossils Resource use, mineral and metals Weidema 2009 Stepwise (EUR2003) monetisation 8.32E E E E E E-04 na na na na 1.00E E E-06 Note: Weighting factors from Weidema 2009 (Stepwise) are meant to be multiplied directly by characterized results Moreover, Stepwise has been also applied by Weidema 2014 (comparing Ecoindicator 99, Stepwise 2006 and Recipe 2008) and by Bulle et al (comparing Ecoindicator 99,Recipe 2008, Impact world +, and Stepwise) in order to see how the different methods resulted in term of impact category relevance. In the case of Bulle et al 2014, the authors were reporting the differences when applying the characterisation and the weighting to the inventories related to global emission and resource use. The Stepwise weighting factors were used to put endpoint result on a comparable scale in euros assigning /DALY for human health and 0.14 per PDFm2 yr for ecosystem quality. Once applied on the normalisation values (global emission per person per year), it is stated that the approaches had a good agreement about the relative importance of climate change, respiratory inorganics and land use impacts. However, it was also stated that the land use impacts are 1 order of magnitude higher for ReCiPe. Further, it was also stated that all included methods agree on the relatively low importance of ionizing radiation, ecotoxicity and ozone depletion. Under main learnings it was stated that different behaviours of the methodologies for some impact categories need to be better understood to evaluate whether this is due to an improved assessment or to a modelling bias and that in particular, water impact on humans dominate in IMPACT World+, highlighting the need for further investigation. Overall, differences in the results can span an order of magnitude for some impacts, highlighting the need of further investigation in the differences between the different endpoint modelling as this could have significant impacts on results in a product comparison context. na na 7 Bulle, C., Weidema, B. P., Margni, M., Humbert, S., Rosenbaum, R. K., & Jolliet, O. (2014). Comparing IMPACT World+ with other LCIA methodologies at end-point level using the Stepwise weighting factors. In SETAC Europe 24th Annual Meeting. 130
135 Annex 13. Comments posted on the discussion part of the DG ENV EF wiki system A) From Mark Goedkoop Dear TAB members, I am very surprised and concerned that the weighting method proposed by JRC chooses option 3, which basically proposes a panel will be used to link mid to end point and a panel will again be used to weight the endpoints. While the latter is acceptable, using a panel to link mid to endpoint is really weird. This means we replace science by the verdict of panellist. I am quite aware about some of the uncertainties in the mid to end point factors, but I always thought we prefer science over the laymen s view. Uncertain science is always better than no science at all. In order more blunt words, I am wondering when we see the proposal to ask a panel to make a verdict about the relative contribution of NO2 and SO2 to acidification or the assessment of toxic effects of individual substances. Why not abolish science altogether??? The concept of midpoint-endpoint was developed out of the clear evidence in social science literature that people cannot weight 14 midpoints, for two reasons: 1. Having to weight more than 3 to 5 items causes cognitive stress; people are not designed to do this; such choices do not normally occur in daily life 2. People have only very vague ideas of what acidification does to nature and what climate change does to nature. They have heard about it, but they can certainly not estimate the quantitative link between the midpoint and endpoint (which the proposed procedure asks them to do) even the best LCA experts or acidification experts cannot do this without scientific models. The problem is that these issues make it very difficult to validate the results, and to check whether we are really measuring what the people in the panel mean. In order to deal with these restrictions the endpoint approach was developed for the same two reasons 1. People can weight three issues provided that they are sufficiently tangible 2. Science can (with uncertainties) model the link between mid and endpoint; at least it can do this better than a panel So while I reject the use of panels to link mid to endpoints, I would even warn against endpoint weighting. People relate in different ways to human health, ecosystem and resource impacts. Some damages can be experienced: A friend with asthma: some can be perceived: a newspaper article about ecosystem damage, some are only predicted: future scarcity, while in fact resources tend to get cheaper. This is just one of the many things that can cause a bias if you are not carefully present the issues to the panel. The questionnaire certainly does not do this. My proposal is to go with option 2, and simply use endpoint weighting (with all its difficulties) as endpoints are designed for. This optimises the use of science against laymen s verdicts that have no base at all. I am not advocating to use the ReCiPe 2008, but the just released and much improved ReCiPe 2016, in which I have had no share, and have no vested interest in. Mark Goedkoop 131
136 B) From Matthias Finkbeiner Dear TAB members, inspired by the contribution of Mark Goedkoop I like to offer my thoughts on the weighting debate. I do not know, whether Mark commented on behalf of the helpdesk or any specific pilot. I comment here with my personal view and not as TAB representative of Germany as we did not have an opportunity yet to agree on a formal position on this topic. I agree with Mark, that weighting is replacing science by the verdict of panellists and represents laymen s view. I disagree with Mark, that asking a panel to make a verdict about the relative contribution of NO2 and SO2 to acidification. is any different to asking them a verdict about DALYs and PDFs. In both cases, Mark s question Why not abolish science altogether? should lead to the same answer. As Mark rightly says: People have only very vague ideas of what acidification does to nature and what climate change does to nature. They have heard about it, but they can certainly not estimate the quantitative link between the midpoint and endpoint.even the best LCA experts cannot do this.. However, when it comes to endpoints, most people do not even have a vague idea anymore what they really mean or measure. They might have a fuzzy notion about what human health and natural resources mean to them, but they have no clue what they are actually weighting, e.g. in terms of DALYs or surplus cost, and which value choices and uncertainties they implicitly buy with it. So exactly the same statement that Mark formulated for midpoint weighting holds definitely true for endpoint weighting as well: The problem is that these issues make it very difficult to validate the results, and to check whether we are really measuring what the people in the panel mean. Mark says, he rejects the use of panels to link mid to endpoints [and] would even warn against endpoint weighting. I warn against both midpoint and endpoint weighting. Whether I reject either of them depends on what I want to do, i.e. the goal of the study. If there is a company which wants to express their environmental priorities in a weighting scheme for their internal studies, no issue for me. If there is a government, that intends to implement LCA related to their environmental priorities, no issue for me as long as they understand that many impacts they weight probably happen in other regions and therefore under other governments responsibilities and that this may lead to unintended consequences. Just as a side note: most governments environmental priorities, expressed in environmental legislation, are formulated (and therefore implicitly weighted) on the inventory level, not even the midpoint level. Some weighting methods work with such government targets. There are pros and cons to them as always, but they are at least more honest in the sense, that weighting is about values, policies and interests definitely not about science. I reject, if weighting is sold as science or evidence-based. Science can support and analyse weighting, but not do or even replace it. Is weighting LCA/PEF experts or LCA/PEF methodologies business? Not for me. The values or weights of LCA/PEF experts are not any better or more true or more relevant than that of other human beings, be it laymen or politicians or even lobbyists or whoever. Who do we think we are? So, if you want to keep the science intact, disconnect the weighting from the scientific assessment. Use LCA to come up with the facts and then deal with weighting in the decision making. This means for PEF, that weighting should be addressed in the policy implementation, as this will determine the need for it depending on the specific application. This will also determine which stakeholders should have a say in the weighting and how an 132
137 inclusive and representative process to come up with weighting factors should look like. Asking a bunch of LCA experts in surveys and webinars does not sound like a convincing stakeholder representation to me. My proposal is therefore, not to address weighting as part of the LCA or PEF baseline method. I recommend to the EU Commission to deal with the weighting issue during the policy implementation process. There are plenty of scientific issues to be addressed, improved or even corrected in this pilot process. The TAB should focus on them. If anyone thinks, that you do LCA or PEF a real favour by fixing the weighting as part of the baseline assessment method, then you have to address the scientific question, whether it is proper that the normalization step most probably will do the weighting. As the weighting spread is typically not very significant, even for endpoints (I never understood the hype about hierarchist or individualist or whatever as the weighting factors were basically the same for all, i.e. within one order of magnitude ); the much higher spread of normalization factors of several orders of magnitude will largely determine the outcome of the exercise, not the weights. Real world practitioners knew since years, some just learned lately during the PEF pilot phase, how poor the data quality of normalization factors is. If you let the normalization do the weighting, you are definitely wrong and then you can really abolish the science altogether as Mark phrased it. I encourage the numerous proponents of normalization and weighting in this community to think twice, where we should fix the system boundary or interface between science and policy, between the assessment method and the decision making process. I am a strong believer that keeping factual LCA intact is more sustainable than creating a postfactual version of it that pretends it can not only model complex product systems and complex environmental mechanisms (still enough homework to do for this..), but even the environmental priorities of society. If you continue to do so, it will just damage the credibility of the whole method. Matthias Finkbeiner C) Response from Mark Goedkoop to Matthias Finkbeiner Mark Goedkoop (personal view) March 7 th 2017 Matthias states he inspired by my response, but I feel I have not been clear enough and I do think we are very much aligned in our views. By the way; my response was not on behalf of the helpdesk; it was and this is my view. I did not intend to say weighting is replacing science with the verdict of panellist. This is exactly what I am against. My comment is that this is what the JRC proposes and it should not be done; so Matthias, we have full agreement I think. My statement that we could use panellist for the acidification category was not a proposal; an illustration of what this type of reasoning could lead to. So lets explain again. The endpoint approach was developed to make weighting somewhat less impossible, mainly by trying to simplify the job of a panel in two ways: 133
138 1. Reduce the number of impact categories to just three 2. Define the indicators in a way people may be able to relate to these. Matthias and I agree that even this lighter task is still very problematic and, if the intended audience does not insist on it, should be avoided. We also all agree it cannot be used for comparative assertions. In the context of the PEF I think we do not need endpoint weighting. It would be fine to just summarise the PEF results as three indicators which are hopefully understood by larger audiences. Some of the early communication vehicle proposals use this type of thinking. What JRC is proposing is to use a panel to link midpoints to endpoints, and this does in my view not make sense for the same reasons: 1. There are too many midpoints for ecosystems and human health, very difficult to make a trade off (check social scientists) 2. Impact categories like climate appear three times, how can a person relate to this? 3. The midpoints are very abstract, and very difficult to relate too, thus very difficult to give it a weight. What I really do not understand is why we need a panel for mid to endpoint weighting, if we already established a cause effect mechanism and we have a science based mid to endfactor. This was the confusion I started with. For the mid to end factors we need to choose between: Using the best available science we have in the mid to endpoint factors, knowing they can be quite uncertain, but also recognising they can be verified and improved. Conducting in my view the worst panel procedure possible, leading to completely unverifiable results. 134
139 Annex 14. Presentation to the EF Steering Committee on May 30, 2017, on the comments received on the consultation draft and related actions During the consultation period, the JRC team received comments from 18 contributors, 5 of which from a single company. All the comments were much appreciated and all of them were helpful to better understand strengths and weaknesses of the suggested approach. Comments received have been grouped in topics and addressed as follows. 1. General comments on weighting Value of weighting Response: Some comments expressed the concern to have weighting included at all in the EF. Some comments argued for it as a means to better support decision making An explicit weighting scheme is (and always will remain) controversial. However, in fact weighting is used - mostly in an implicit and intransparent manner - today in many decision making processes e.g. environmental labels and Green Public Procurement (GPP). For the EF, a transparent weighting scheme is essential for the identification of the most relevant impact categories, processes and elementary flows and hotspots. Weighting part of the EF pilots or of the policy process? Definition of a weighting scheme was seen as premature. Risk that a recommended weighting set from the EF pilots might lead to a de facto standard having an inappropriate influence on the policy process. The weighting should be part of the policy process from 2018 onwards and not of the EF pilots, it was argued. Response: Weighting is required for the identification of the most relevant impact categories, processes and elementary flows and hotspots. Any potential future policy process may look at the weighting set proposed as an input to their decision making process and is free to decide otherwise, change etc. etc Deviate from equal weighting All comments received stated that adopting weighting factors would be better than the equal weighting of impacts categories Equal weighting is seen as accidental (number of impact categories determines the weight of aspects) Equal weighting is not considering the different extent of maturity and robustness of the LCIA methods. Several contributors highlighted that it is important to develop weighting factors that combine science with societal values. Response: We agree. Importance of transparency Few comments highlighted that weighting could to some extent camouflage EF results (especially when weighting results are communicated at end point level). Response: 135
140 We think that this issue can be resolved as the weighting factors applied are transparently reported Also EF studies have to report LCIA results before normalization and weighting, so transparency is not lost. For communication (at least B2C) of EF results it is seen as not helpful to always keep all 16 midpoint categories, so some sort of weighting and selection has to happen at some point Presentation of results A comment proposed to present clustering impacts of similar nature instead of single score as result of the weighting process. Response: This approach is actually used in several labels already in place at the national level in some EU Member States. Nevertheless it is still difficult to be interpreted by consumers. When using clustered impacts, trade-off between them are more explicit but comparisons remain difficult. To clarify: Building a single score based on the weighting set is optional for the EF pilots, but it is not required to create a single score. Documentation of all comments received Several critics were made through the Technical Advisory Board, the LCA discussion list and the webinar chat but none of these critics are reported in the document. Response: The Commission cannot publish comments with names without having prior written authorization from the authors. While we are not sure about the added value, we can include an anonymized list in an annex to the document. It might be possible, to document those comments that were uploaded by the authors with their names to the wiki with names in an annex to the weighting report. These slides also can be included in an annex to the weighting report. 2. General comments on the chosen approach Alternative approaches: monetization Few alternative approaches have been proposed in the comments, among which a damage approach in combination with an evaluation of willingness to pay. Response: While this approach may look like a promising methodology to be tested and further developed in the future, currently monetization approaches are seen as not developed enough and sufficiently robust to be applied in the context of the Environmental Footprint. Alternative approaches: distance-to-target Another alternative approach that have been proposed is the Distance-to-Target where characterization results are related to target levels, either policy based or carrying capacity-based (e.g. planetary boundaries). Response: To a certain extend the basis of this approach is included in the weighting set obtained via the webinar of Impact Assessment experts, as one of the criteria was the distance to planetary boundaries. A distance to EU policy targets has been developed and tested by JRC but was not seen as suitable to be applied in the context of the Environmental Footprint. 136
141 Alternative approaches: ranking A comment highlighted that a single score can be obtained by other means than weighting and suggested a ranking procedure. Response: The described procedure is very interesting, nevertheless it shows a clear weakness: benchmarking values for each impact category are needed to assign impact classes. Currently benchmark values to build impact classes upon are not available, therefore assigning impact classes would be even more arbitrary than weighting. If solid benchmark values can be obtained for defining impact classes for the product categories, the ranking approach looks like a promising methodology to be tested and further developed in the future. Multicriteria Decision Analysis perspective A comment was made on the correlations and trade-offs among impacts that question the validity of a weighted average approach. Response: The used midpoint categories are not free from correlation, as some potential impacts can be linked to the same elementary flows. This is a limitation of the suggested approach, actually starting with the LCIA classification. However, options to avoid this like conducting the weighting on elementary flow or endpoint level seem to be either not feasible or not yielding more robust or transparent results. We may add a brief discussion to the report on the trade-offs that implicitly occur when the proposed weighting set is applied to increase transparency Weighting at midpoint versus endpoint Some comments were in favour of weighting at endpoint level instead of midpoint level to increase the relevance of science behind the weighting scheme. Some argued there is no real difference between the two. Response: Currently available methods to arrive from midpoints at the endpoints are not seen as more robust or more transparent compared to what can be achieved with a weighting scheme applied at midpoint level. Once endpoint models have been further developed and converge, they look like a promising approach to be tested and further developed in the future as basis for a weighting approach. 3. Specific / technical comments Credibility of the panel / respondents Several comments highlighted that when using a panel approach, the selection of the panel members is a key choice. A specific panel should be designed on purpose for this assessment, formed by the European Environmental Agency (EEA), as they are the EU's competent environmental body Response: We agree that the composition of the panel has an impact on the results. Therefore, in the weighing report it is described how the panels were constructed. Due to data privacy reasons the Commission cannot provide names, unless prior written agreement is provided. For some of the experts participating in the webinar an annex can be provided. 137
142 The approach taken tried to be more inclusive than relying solemnly on the expertise of staff members of EU institutions. The EEA was invited to participate to the webinars but unfortunately it was impossible for them to participate within the given time frame. Relevance for intermediate products and communication There was a question whether weighting also has to be applied to intermediate products. Another comment was on the decision about weighting on potential recommendations regarding communication of PEF profiles and other EF related information. Response: Weighting is indeed needed as to identify the most relevant impact categories, processes and elementary flows and hotspots. From that viewpoint, it also applies to intermediate products. There will be no recommendation from EC on communication as part of the PEFCRs/OEFSRs or the Guidance. Communication aspects will be dealt with together with any - potential - policy application of the EF. Update of weighting factors over time Did you in your approach account for review/change of weighting factors over time? Since those factors are so heavily based on value choices, political and cultural perspectives they are sensitive for changing in people s minds. May be, built in to reassess the values every 3 or 5 years? Response: An update and maintenance procedure for the weighting factors has not been defined. It looks sensible to do so in relation to any potential policy measure related to the EF. 4. Input to the questions posed In order to guide the consultation a specific question was proposed on the usefulness that the weighting sets produced from surveys of the general public (via questionnaires), of LCA experts (via questionnaires) and from experts in impact assessment (via webinar) are combined and integrated into one weighting set. The answers to this are quite different among the respondents. They are reported in the following table. Options # Main reasons Aggregation of 1/3 to each group 2 The reasoning behind the 25/25/50 proportion is not clear Excluding the general public, and around 1/2 to LCA and LCIA experts 2 Science is not participative Do not aggregate, choose just the general public 1 Best option is the general public (or their elected political representatives) because LCA experts and experts in impact assessment are required to assess objectively the impacts, but the people in charge to define the trade-off (weight) between criteria subjective part should be the decision makers. Excluding the LCIA experts 2* LCIA experts can weight exclusively the impact categories they are working on but not their relation with other categories Aggregation of all sets 2 Weighting is both a scientific matter and a judgment of values, so it is recommend to include elements of opinions across a diverse set of stakeholders Response/conclusion: 138
143 Based on the comments on this topic, it is not possible to identify a common shared position that would prevail and be an improvement over the suggested approach. The webinar and the surveys (public and LCA experts) are different ways to generate weighting sets that is why we chose to give them 50% share each. Therefore, we decided to not change the aggregation shares but we will describe the reasoning for the proportion of 50% from surveys and 50% from the webinar with experts in more detail in the report. General comments on robustness All respondents except two stated that the inclusion of robustness would add values because it reduces the chances that the result from a less certain impact category would dominate the aggregated to weighting set. Just two comments were negative, the first suggesting that robustness should be clearly separated from weighting and the second arguing that robustness should be combined with uncertainties of inventory and of normalisation values. Response: We agree in principle with the inclusion of uncertainties at Life Cycle Inventory (LCI) and normalization level. While uncertainties of the normalization factors are in fact captured in the suggested robustness factors, this is currently not possible with the uncertainties contained in the LCIs. Uncertainties in the LCI should be reduced by data quality requirements and the data needs matrix. How to consider robustness When asked if less robust impact categories should weigh more or be discounted, all comments were coherent suggesting to discount them. Several comments suggested that it would have been preferable to use a 1 to 0,1 scale for the robustness factors, instead of the used 1 to 0,5. Impact categories with a final robustness factor of e.g. lower than 0.75 or 0.7 (using the scale 1-0.5) should be excluded. Response: We will introduce robustness factors that will lead to a stronger discounting of the more uncertain impact categories. We do not agree with further exclusions because it would result in a weighting of 0 for impact categories that should be included to achieve one of the goals if the EF, namely being comprehensive. The way how the levels (I to III) of the three criteria have been assigned to the impact indicators remains obscure. Response: At the end of the day, the assigning of levels is based on expert judgment. However, the way is made transparent: For the ILCD LCIA recommendations, the way of deriving the levels is described in the ILCD Handbook mainly related to the characterization modelling. For the normalization it is described in Sala et al Integrated assessment of environmental impact of Europe in 2010: data sources and extrapolation strategies for calculating normalization factors (Int J Life Cycle Assess (2015) 20: , DOI /s Int) No uncertainty assessment is available in the report. Response: It is true that no uncertainty assessment is conducted in the report. 139
144 However, the robustness levels go back to evaluation of the characterization models and normalisation factors that take in itself into account the uncertainty, e.g. for the normalization described in Sala et al Integrated assessment of environmental impact of Europe in 2010: data sources and extrapolation strategies for calculating normalization factors (Int J Life Cycle Assess (2015) 20: , DOI /s Int) Comments on impact categories Two comments reported that the toxicity categories should not be excluded and one suggested that instead of exclusion, toxicity should have a lower weight Response: In principle, the EF method aims at looking at a comprehensive set of impact categories to help avoiding any potential shifting of burdens. However, the results of the EF screenings have demonstrated that the toxicity categories currently come with too many unresolved issues to be able to discriminate between different products in the EF context in a meaningful manner. Therefore, the decision was taken by the EF SC to assess and calculate the toxicity impact assessment results but to not include them in a weighting scheme until some improvements on the toxicity methods have taken place. One comment suggested that material and energy resource depletion should be removed, as these are society/social impact potentials, hence do not fit into (environmental) LCA. They would otherwise wrongly overshadow all the other impact categories, also as Resources is a separate AoP. Response: While it is correct that the use of abiotic resources capturing metals, minerals and energy contributes to an Area of Protection, that is different to many other midpoint impact categories, i.e. the AoP linked to resources, this aspect is also covered by ISO 14040/44: LCA considers all attributes or aspects of natural environment, human health and resources. By considering all attributes and aspects within one study in a cross-media perspective, potential trade-offs can be identified and assessed. LCA is not limited in its assessments to Ecosystems and Human health. Therefore, we do not see it as justified to exclude the aspect of resource use from LCA or the Environmental Footprint. Reference for global normalization factors A request for reference to the global normalization factors in Table 32 and 33 was raised in a comment. Response: The basis for these calculations can be find in: Sala S., Benini L., Crenna E., Secchi M., (2016). Global environmental impacts and planetary boundaries in LCA; EUR EN; JRC technical report; doi: / Nevertheless, the values reported in tables are coming from a calculation refinement that will be explained in a scientific paper in preparation from the same authors of the report. For this reason, the values could differ from the ones presented in the cited report. In reply to the comment, the technical report of Sala et al., 2016 and the updated values will be shared with the Steering Committee and Technical Advisory Board members and the will be added to the weighting report. table with the normalization values 140
145 Europe Direct is a service to help you find answers to your questions about the European Union. Freephone number (*): (*) The information given is free, as are most calls (though some operators, phone boxes or hotels may charge you). More information on the European Union is available on the internet ( HOW TO OBTAIN EU PUBLICATIONS Free publications: one copy: via EU Bookshop ( more than one copy or posters/maps: from the European Union s representations ( from the delegations in non-eu countries ( by contacting the Europe Direct service ( or calling (freephone number from anywhere in the EU) (*). (*) The information given is free, as are most calls (though some operators, phone boxes or hotels may charge you). Priced publications: via EU Bookshop (

146 KJ-NA EN-N doi: / ISBN