Understanding the Embodied Impacts of Precast Concrete and Other Pipeline Materials.
|
|
|
- Melvin Randall
- 5 years ago
- Views:
Transcription

1 Understanding the Embodied Impacts of Precast Concrete and Other Pipeline Materials
2 AGENDA Environmental Management who cares? CPSA Embodied Carbon Study background & scope Debunking carbon foot printing misperceptions What is a carbon footprint? Resin sourcing Beyond the factory gate... Transport emissions Site Safety - Manual lifting or mechanical? CPSA results Vs Industry Database who do your customers believe? how can you convince them to use your results? Beyond carbon...
3 Product Manufacturer Builder s Merchant Installer Specifier Licensed Operator Environmental Management who cares?
4 Environmental Management who cares? BS 8903: 2010 Sustainable Procurement SP provides value for money on a whole life basis Do procurement models really take a long term view? To what extent can purchase decisions be influenced by sustainability credentials? Is a price premium achievable for superior environmental performance? Is it just about carbon? How can we ensure that decisions are based on accurate and comparable data?
5 CPSA Embodied Carbon Study: background & scope Increasing enquiries for information on environmental performance of pipeline products Inconsistency of what is asked for Apparent lack of understanding of data collected Concern that comparisons not based on comparable data Conflicting claims and counter-claims by competing suppliers keen to position their offering as preferred solution.


6 CPSA Embodied Carbon Study: background & scope CPSA Sustainability Strategy Identified need to provide data on environmental performance CPSA members sign BPCF Sustainability Charter and RTB Charter Scheme membership Detailed internal audit of pipes and manholes through life cycle stages Comparisons with alternative materials and construction techniques.

 Use information to: Educate")
7 CPSA Embodied Carbon Study: background & scope Independently reviewed Results validated and accredited by industry experts to recognised methodology (PAS 2050) Use information to: Educate Differentiate Substantiate.
8 Debunking carbon foot printing misperceptions What is a carbon footprint? CO 2 and other GHG emissions associated with a product and activities along its supply chain contributing to climate change Sub-set of LCA which covers other burdens Uses indicators such as GWP to reflect relative effect of GHG compared with CO 2 Main unit of measure is kg of CO 2 equivalent (CO 2 e). Greenhouse gas Chemical formula GWP Conversion Factors (IPCC 2001 figures) GWP Conversion Factors (IPCC 2007 Figures) Carbon Dioxide CO Methane CH Nitrous Oxide N 2 O Sulphur Hexafluoride SF 6 11,700 14,800 HFC-23 CHF 3 23,900 22,800 Source: IPCC, 2007


9 What is a carbon footprint? Most industry databases currently CO 2 based; not all figures reported are CO 2 e Example: Bath University ICE Database V1.6a used for many default values for EA, HA, utility company and many other carbon calculators Some products / activities have higher % non-co 2 emissions. HDPE Pipes PVC Pipes As reported by ICE database V1.6a(CO 2 only) at time of CPSA study As reported by Plastics Europe study and ICE V2.0 published February ,000 Kg CO 2 /t 2,000 Kg CO 2 /t + 20 CH 4 /t + <1 N 2 O/t 2,500 Kg CO 2 /t 2,500 Kg CO 2 /t + 29 CH 4 /t + <1 N 2 O/t 2,520 Kg CO 2 e/t 3,200 Kg CO 2 e/t

10 Measuring carbon footprint - Standards 1. ISO 14040/44 2. PAS Coming: ISO EN15804

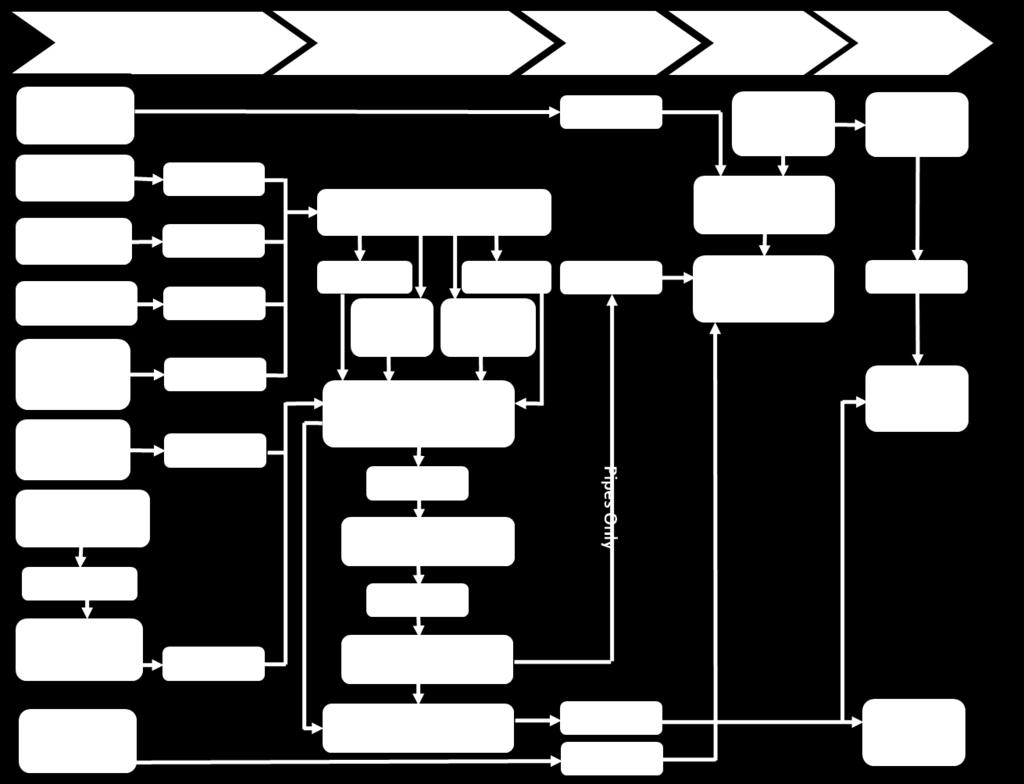
11 System Boundaries - concrete pipes
 High Density Polyethylene (HDPE) resin Crude Oil Extraction Basic Refinery Processes Cracking (Refinery) Ethylene Polymerization EDC")

12 Debunking carbon foot printing misperceptions Plastic pipes resin sourcing Raw materials High density polyethylene (HDPE) Polypropylene (PP) U-polyvinyl chloride (upvc) High Density Polyethylene (HDPE) resin Crude Oil Extraction Basic Refinery Processes Cracking (Refinery) Ethylene Polymerization EDC Production Polypropylene resin Natural Gas Basic Refinery Processes As by-product from cracking associated with gasoline Propylene Chlorine VCM Production/ Cracking of EDC Polymerization PVC Pipe Extrusion & Packaging UN reports reveal that CO 2 e from shipping underestimated by ~300%.
13 Resin sourcing Western Europe (Italy) Oil extracted, processed, cracked and thermoplastics developed at Rosignano, Italy Exported from La Spezia Port, Italy (132 km from cracker/plant) by a 20,000t vessel 4,054 km by ship to the UK 230km by land to the HDPE pipe manufacturer. UK electricity CO 2 conversion factor: kg CO 2 e/kwh Italy electricity CO 2 conversion factor: kg CO 2 e/kwh Production of pipe and resin overall impact + transport: 3,021 kg CO 2 e/ tonne of pipe (including 90 kg CO 2 e/t associated with different transport stages)
14 Resin sourcing Eastern Europe (Hungary) Oil extracted, processed, cracked and thermoplastic resin developed near Budapest (at a plant owned by Hungary s leading polymer producer TVL) Taken by land to Loughborough, UK in a 2,150 km trip UK electricity CO 2 conversion factor: kg CO 2 e/kwh Hungary electricity CO 2 conversion factor: kg CO 2 e/kwh Production of pipe and resin overall impact + transport: around 2,940 kg CO 2 e/tonne of pipe (including over 180 kg CO 2 e /t associated with transport)
15 Resin sourcing Middle East (Saudi Arabia) Resin will be transported from the Gulf port of Ras Tanura 11,500 km away to a UK port by a 20,000 tonnes large container vessel 300 km trip by road to the Midlands. UK electricity CO 2 conversion factor: kg CO 2 e/kwh Saudi Arabia electricity CO 2 conversion factor: kg CO 2 e/kwh The overall impact is 3,985 kg CO 2 e/t and transport alone will cause around 202 kg CO 2 e/t impact.

16 Resin sourcing Asia (India) Resin produced at a plant near Delhi and transported to a Port at Western coast of India Shipped by a large container vessel 13,843 km to Dover port, UK Transported by land to the Midlands. UK electricity CO 2 conversion factor: kg CO 2 e/kwh India electricity CO 2 conversion factor: kg CO 2 e/kwh Overall transport impacts exceed 240 kg CO 2 e/t. Overall impact is 5,176 kg CO 2 e/t.
17 Total carbon footprint of HDPE pipe = 2926 kg CO 2 e/t Resin sourcing Houston, Texas Oil extracted, processed, cracked and developed at Total Bayport HDPE plant, Texas Resin transported to Halifax by sea (4215 km) by large container vessel and onward to KWH Pipes HQ and plant near Montreal (1233 km by road) by 33t truck US electricity CO 2 conversion factor: kg CO 2 e/kwh Canada electricity CO 2 conversion factor: kg CO 2 e/kwh Production of pipe and resin overall impact: 2696 kg CO 2 e/ tonne of pipe + Transport of resin to Canada: 222 kg CO 2 e/tonne of resin = 230 kg CO 2 e/tonne of pipe
18 Resin sourcing Comparing Pipes DN 2100 (84 inch) UK Weholite (India Sourced resin) UK Weholite (Saudi Sourced resin) UK Weholite (Italy Sourced resin) UK Weholite (Hungary sourced resin) Canada Weholite (Gulf of Mexico resin) UK Concrete pipe (Class B) UK Concrete pipe (Class S)
19 Beyond the factory gate... Transport Vehicles can often carry a greater total length of plastic pipe than equivalent size concrete or clay Assuming like-for-like haulage distance, this can reduce total vehicle movements and lower transport emissions for pipe deliveries direct to site Bedding design and installation Flexible (plastic) pipes require full granular surround Rigid (concrete, clay) pipes may use other bedding designs This reduces transport for granular imports Also reduces transport for disposal of excavated material Mechanical lifting should be used for all pipes > DN300 irrespective of material.

20 Beyond the factory gate... Transport Vehicles can often carry a greater total length of plastic pipe than equivalent size concrete or clay Assuming like-for-like haulage distance, this can reduce total vehicle movements and lower transport emissions for pipe deliveries direct to site Bedding design and installation Flexible (plastic) pipes require full granular surround Rigid (concrete, clay) pipes may use other bedding designs This reduces transport for granular imports Also reduces transport for disposal of excavated material Mechanical lifting should be used for all pipes > DN300 irrespective of material.
21 Gate to Site: Transport & Installation Example of Gate to Site transport emissions (inc fill material) 23 kg CO 2 e/m Excavated material removed from site 30km 11 kg CO 2 e/m Transport of pipes 100km 23 kg CO 2 e/m Transport of granular 30km DN2100 HDPE pipe per m 143 kg CO 2 e/m Granular for bedding (4.9 m 3 ) 86 kg CO 2 e/m
22 Gate to Site: Transport & Installation Example of Gate to Site transport emissions (inc fill material) 4 to 10 kg CO 2 e/m Excavated material removed from site 30km 24 kg CO 2 e/m Transport of pipes 100km 4 to 10 kg CO 2 e/m Transport of granular 30km DN2100 concrete pipe per m 48 to 84 kg CO 2 e/m Granular for bedding (0.9 to 2.2 m 3 ) 16 to 40 kg CO 2 e/m 23 kg CO 2 e/m Excavated material removed from site 30km 11 kg CO 2 e/m Transport of pipes 100km 23 kg CO 2 e/m Transport of granular 30km DN2100 HDPE pipe per m 143 kg CO 2 e/m Granular for bedding (4.9 m 3 ) 86 kg CO 2 e/m

 Plastic pipes Reusable end of design")
23 End of Life Concrete pipes Many examples of pipes over 50 yrs re-used Concrete can be recycled, broken up as rubble and used as aggregate or fill material Carbon negative! 15 to 35 kg CO 2 e can be absorbed by 1m 3 of crushed concrete by carbonation taking the entire cycle into consideration a figure for overall CO 2 e uptake can be between 25 and 45 kg/m 3 DN450 pipe -3 to -5kg CO 2 e/m (-10% C-G ) Plastic pipes Reusable end of design life? Potential for recycling? Able to quantify aged properties? Acceptable consistency as pipe raw material?

24 CPSA results Vs Industry Database Total carbon footprint for concrete pipes kg CO 2 e/t Includes steel reinforcement, where applicable Examples: DN300 27kg CO 2 e per metre DN600 72kg CO 2 e per metre

25 CPSA results Vs Industry Database who do your customers believe? how can you convince them to use your results? University of Bath ICE V2.0


26 CPSA results Vs Industry Database who do your customers believe? how can you convince them to use your results?
27 Beyond carbon Environmental Impact Categories Category Abiotic depletion Global Warming (GWP100) Ozone layer depletion (ODP) Human toxicity Fresh water aquatic ecotoxicity Terrestrial ecotoxicity Photochemical oxidation Acidification Eutrophication Solid Waste Radioactivity Minerals Extraction Water Extraction Unit kg Sb eq. kg CO 2 eq. (100yr) kg CFC-11 eq. kg 1,4-DB eq. kg 1,4-DB eq. kg 1,4-DB eq. kg C 2 H 4 eq. kg SO 2 eq. kg PO 4 eq. tonne solid waste mm 3 high level waste tonne of minerals extracted m 3 water extracted

28 Beyond carbon embodied energy 1 linear metre of concrete pipe has lower embodied energy than equivalent plastic pipe Source: Professor K Serivener, EPFL Lausanne. Lecture at Concrete Ambassador Event.
29 Beyond carbon water foot print Water foot printing is the next carbon DN (Polysewer) PVC Pipe HDPE Pipe PP Pipe 1 Concrete Pipe (Ultra Fortis) DN600-1,102 to 1,508 (Weholite) DN900-2,088 to 2,784 (Weholite) 1,021.4 (Ridgidrain) 3,185.8 (Ridgidrain) DN1200-3,886 to 5,220 (Weholite) Table 2. Cradle-to-Gate Water Footprint (in litres) per 1 metre of plastic and concrete pipes. - 1,072
30 Conclusions Benchmarking only valid if using consistent methodology, boundary conditions and data Reliable data is key acknowledged sources can be flawed Accurate, up to date data produced to recognised methodology and backed-up by third party accreditation should be preferred over other data sources Alternative installation designs can have significant effect on environmental impacts Avoid snapshots which can be misleading (e.g. transport) Pipes will have different impacts depending where they are made and the materials that go into them Concrete pipes are about equal to HDPE pipes in CO 2 e terms (better >DN1200) up to site. We need to take the case to the operation/end of life stages to positively differentiate...
31 Challenge Is it possible to collect reliable whole life data for different pipeline materials TODAY? How do we encourage procurement on a whole life basis?