Using Information from Data Rich Sites to Improve Prediction at Data Limited Sites
|
|
|
- Hope Walker
- 5 years ago
- Views:
Transcription
1 Using Information from Data Rich Sites to Improve Prediction at Data Limited Sites A Challenge for Hydrologic Prediction from Mountain Basins: DANNY MARKS Northwest Watershed Research Center USDA-Agricultural Research Service Boise, Idaho USA
2 The Problem with Hydrologic Prediction in Western North America: Nearly all Mountain Hydrology is ungauged Mountain Hydrology is complicated The Climate is Unstable Statistical Relationships (rainfall/runoff) are unreliable We have spent 50 years perfecting the technique of hydrologic forecasting;
3 It is time for us to address hydrology and hydrologic prediction as a science. Prediction based on understanding of, and interaction between meteorological, land surface and hydrologic processes Re-evaluate our measurement strategy: capture landscape gradients and end-members Understand and Model distributions of hydro-climatic parameters across complex landscapes Re-invest in basic hydrologic and hydro-climatic process research
4 Outdoor Laboratories: High quality, long time-series data record Processes and distribution characterized Uncertainty analysis (system is over-measured ) Only a few locations in the world where this can be achieved

 perennial, surface water dominated, annual precipitation 750-1000mm Johnston Draw (1.")
5 RCEW (239 km 2 ): 32 climate stations 36 precipitation stations 5 EC systems 14 weirs (nested) 6 soil microclimate stations 4 hill-slope hydrology sites 4 instrumented catchments 3 instrumented headwater basins: USC (0.25 km 2, 186m relief) ephemeral, groundwater dominated, annual precipitation mm RME (0.38 km 2, 116m relief) perennial, surface water dominated, annual precipitation mm Johnston Draw (1.8 km 2, 380m relief) ephemeral, rain-snow boundary, annual precipitation mm

6 Predicting Hydrologic State & Storage: Snow SWE Depth Soil Moisture Ground Water Fluxes: Evaporation, Transpiration, Sublimation Streamflow

7 Critical Forcing Parameters: Precipitation Volume Distribution Phase (rain/snow) Wind Turbulent transfer Snow redistribution Temperature & Humidity Hydrology is sensitive to humidity Snow is VERY sensitive to humidity Land Cover Characteristics: Soils & Groundwater Vegetation
8 An Unstable Climate: Changing Climate Hydrology Relationship Precipitation Volume Phase Evaporation Water Stress

9

10
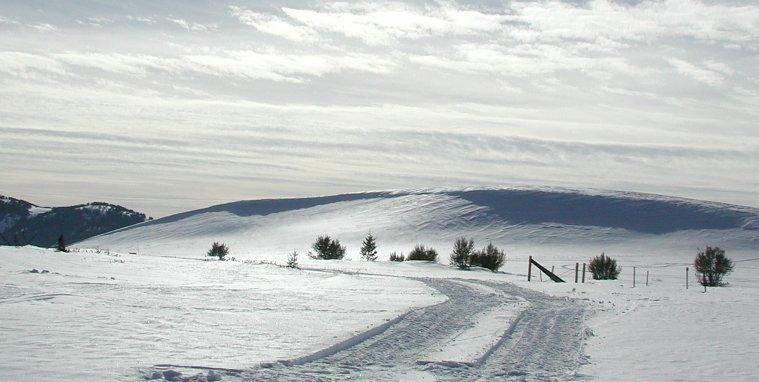
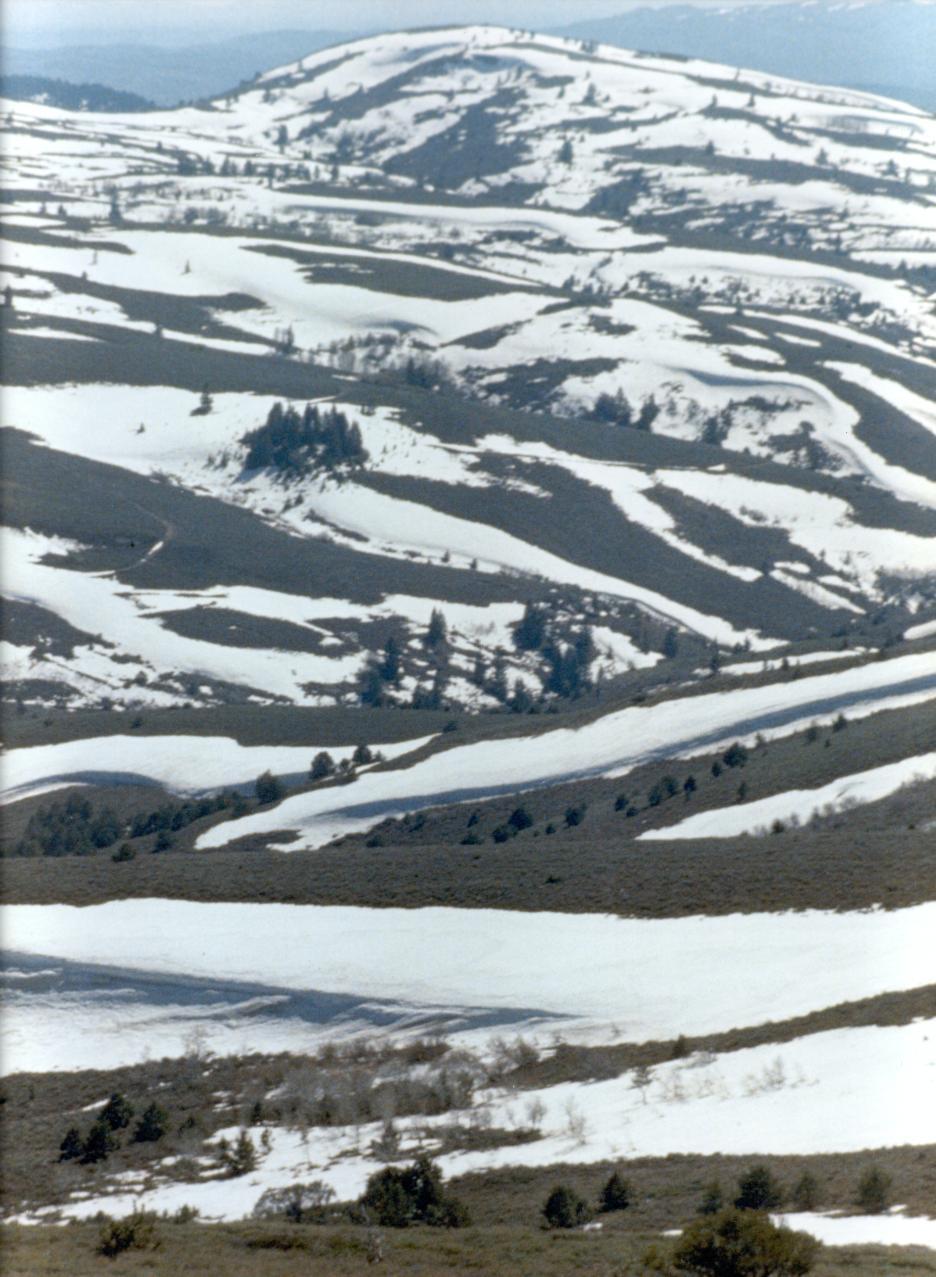
11 Precipitation Distribution: Persistent Patterns Snow Distribution: Wind Topography Canopy Structure

12


13 Validation Site: Upper Sheep Creek Development Site: Reynolds Mountain East
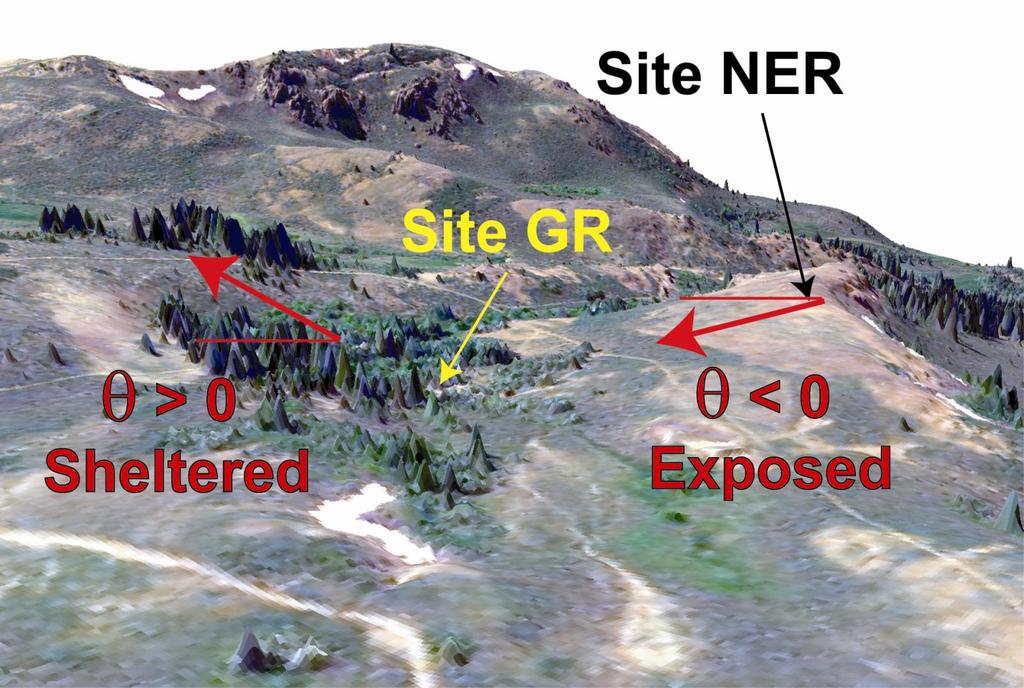


14 LiDAR-Derived Terrain & Canopy Sx: a measure of upwind exposure

15 Development Site: Reynolds Mountain East
16


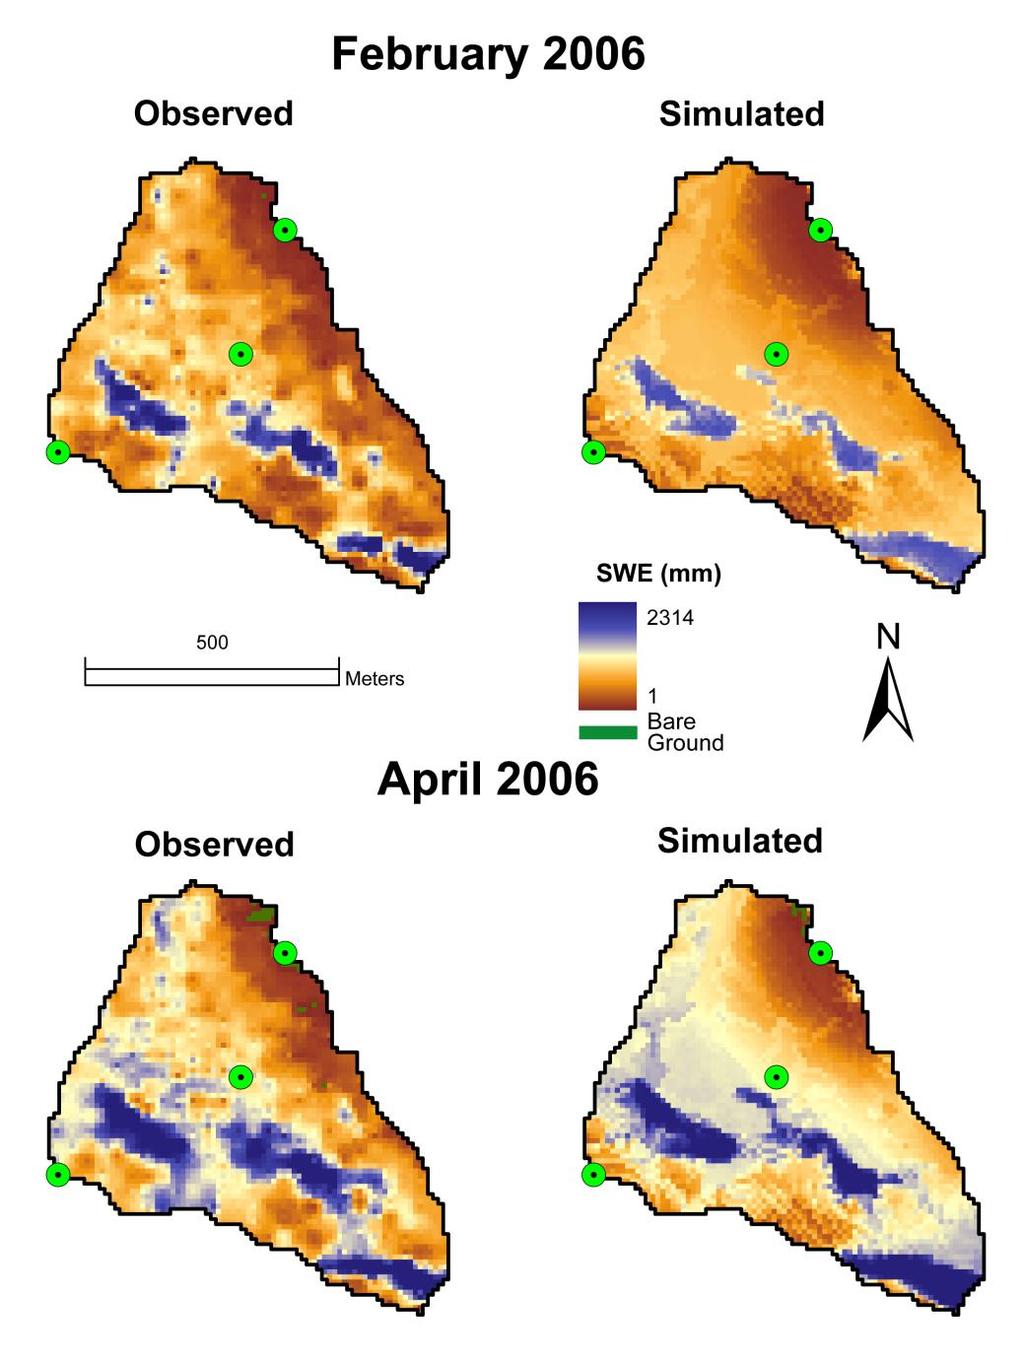
17 Upper Sheep Creek: Testing the precipitation distribution model

18 Upper Sheep Creek: Measured and Modeled SWE WY2007

19 Upper Sheep Creek: Measured and Modeled SWE WY2008 Meters
20 Can we transfer this to a larger basin? Marble Fork Kaweah River 152 km 2 Elevation Range: m

21 Precipitation Distribution by Lapse Rate: Marble Fork Kaweah River 152 km 2 Elevation Range: m Annual Lapse Rate: 4 stations m 0.34 mm m -1

22 Marble Fork: Different Distributions: Sometimes it matters
23 Soil Temperature and Moisture: Spatially and Temporally variable Limited reference data RS spatially very coarse resolution
 031 15 Profile (5 250cm) 22 NP tubes (200cm) 057 098 127 138 144")
24 Continuous (hourly) Soil Moisture Measurement Sites, RCEW (2010) 35 sites: 20 Near-Surface (5cm) Profile (5 250cm) 22 NP tubes (200cm)
")

25 Near Surface Soil Moisture Dynamics Across 1000m of Elevation (CY2010) Site: Elev: 057: 1188m 145: 1591m 127: 1652m 031: 1794m 144: 1815m 138: 1902m 163: 2170m

 and Reynolds Mountain(Site 176,")

26 Soil Temperature Dynamics at two sites, WY1993 Site 057: 1410m Comparison of soil temperature dynamics at Nancy Gulch (Site 057, 1410m) and Reynolds Mountain(Site 176, 2097m) during Site: 176: 2097m snow Snowcover Duration: Site 057: 31 days Site 176: 183 days
27 31 years ( ) of Monthly NP Soil Moisture Measurements 30 Soil H 2 O increases with elevation; S R,107 (cm) Site 176: 2097m Reynolds Mt Monthly average +/- 1 std dev 3 month shift in peak soil H2O; Dominated by precipitation (snow vs. rain); S R,107 (cm) Site 127: 1652m Lower Sheep Creek Monthly average +/- 1 std dev S R,107 (cm) Site 098: 1410m e e e+6 Nancy Monthly average +/- 1 std dev S R,107 (cm) Site 057: 1188m Flats Monthly average +/- 1 std dev 5 0 O N D J F M A M J J A S


28 If we can do all this, then this is possible: Dobson Creek (14 km 2 ) 889m relief 2 Precipitation - climate sites, 10m DEM, LiDAR veg map Simulation Area: (67 km 2 )

29 Scaling up to Tollgate


30 Distributed Snow Accumulation: 2006WY Dobson Creek Watershed Simulation: 10m 2 Grid Cells 893 x 747 pixels (67 km 2 )


31 RCEW: Dobson Creek (14.0 km 2 ) m: 770 m relief 7-day Mixed Rain/Snow Event: 12/25 31/2005

32 Computationally Achievable: 10m DEM, 60 km 2 : 600,000 cells 30m DEM, 600 km 2 : 670,000 cells 100m DEM, 6,000 km 2 : 600,000 cells
33