Model-based analysis of the potential of macroinvertebrates as indicators for microbial pathogens in rivers
|
|
|
- Clifton Frederick Barton
- 5 years ago
- Views:
Transcription

1 DEPARTMENT OF APPLIED ECOLOGY AND ENVIRONMENTAL BIOLOGY RESEARCH GROUP AQUATIC ECOLOGY (AECO) Model-based analysis of the potential of macroinvertebrates as indicators for microbial pathogens in rivers Rubén Jerves-Cobo, I. Nopens, P. Goethals 13 February 2018
 Department of Applied Ecology and Environmental Biology, Research Group Aquatic Ecology (AECO) Ruben.")
2 OUTLINE Background and objective Materials and methods Results Conclusion Netherlands Annual Ecology Meeting 2018 (NAEM2018), Lunteren, The Netherlands, Date (13/02/2018) Department of Applied Ecology and Environmental Biology, Research Group Aquatic Ecology (AECO)
3 1-BACKGROUND AND OBJECTIVE (I) The quality of the water must accomplish standards. drinking water, recreational purpose, Irrigation The indicators used to verify microbial contamination of water are: total coliforms and fecal coliforms and/or Escherichia coli Netherlands Annual Ecology Meeting 2018 (NAEM2018), Lunteren, The Netherlands, Date (13/02/2018) Department of Applied Ecology and Environmental Biology, Research Group Aquatic Ecology (AECO)
4 1-BACKGROUND AND OBJECTIVE (II) Checking the fulfillment requires expensive and highly trained personnel in laboratories Biota works as a permanent monitor of water biological samples can : reflect an increase in pollution. predict average values of chemical parameters Netherlands Annual Ecology Meeting 2018 (NAEM2018), Lunteren, The Netherlands, Date (13/02/2018) Department of Applied Ecology and Environmental Biology, Research Group Aquatic Ecology (AECO) Ruben.JervesCobo@UGent.be
5 Objective - Introduce a quick way of checking the fulfillment of fecal coliforms standards using macrobenthos. Netherlands Annual Ecology Meeting 2018 (NAEM2018), Lunteren, The Netherlands, Date (13/02/2018) Department of Applied Ecology and Environmental Biology, Research Group Aquatic Ecology (AECO) Ruben.JervesCobo@UGent.be

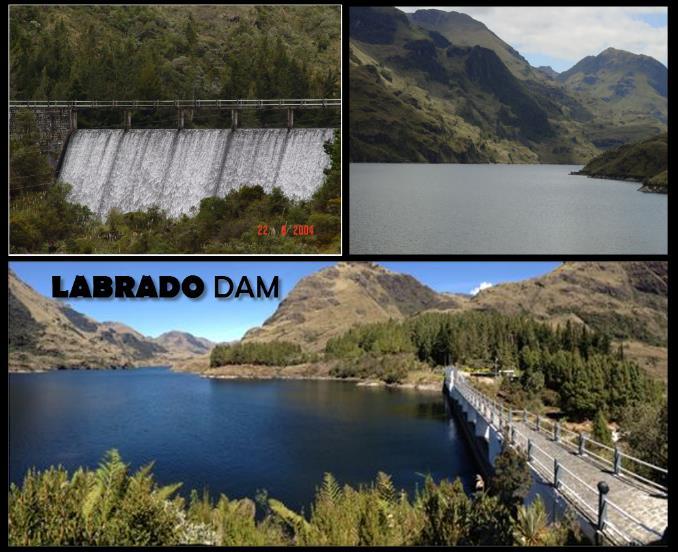
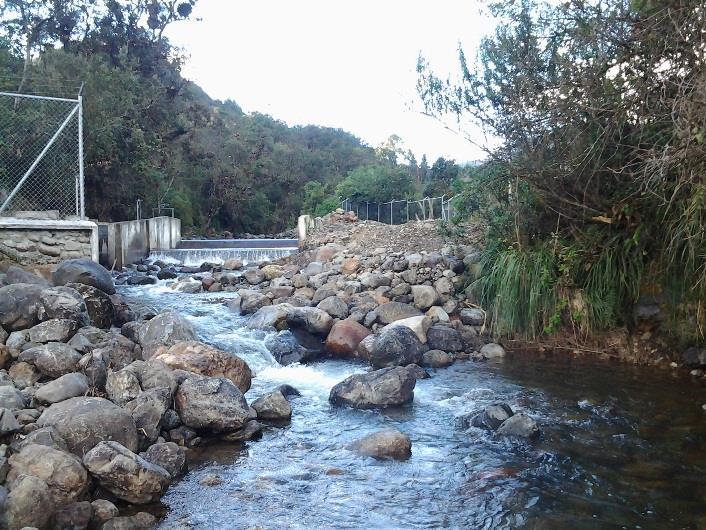
6 2- MATERIALS AND METHODS LOCATION
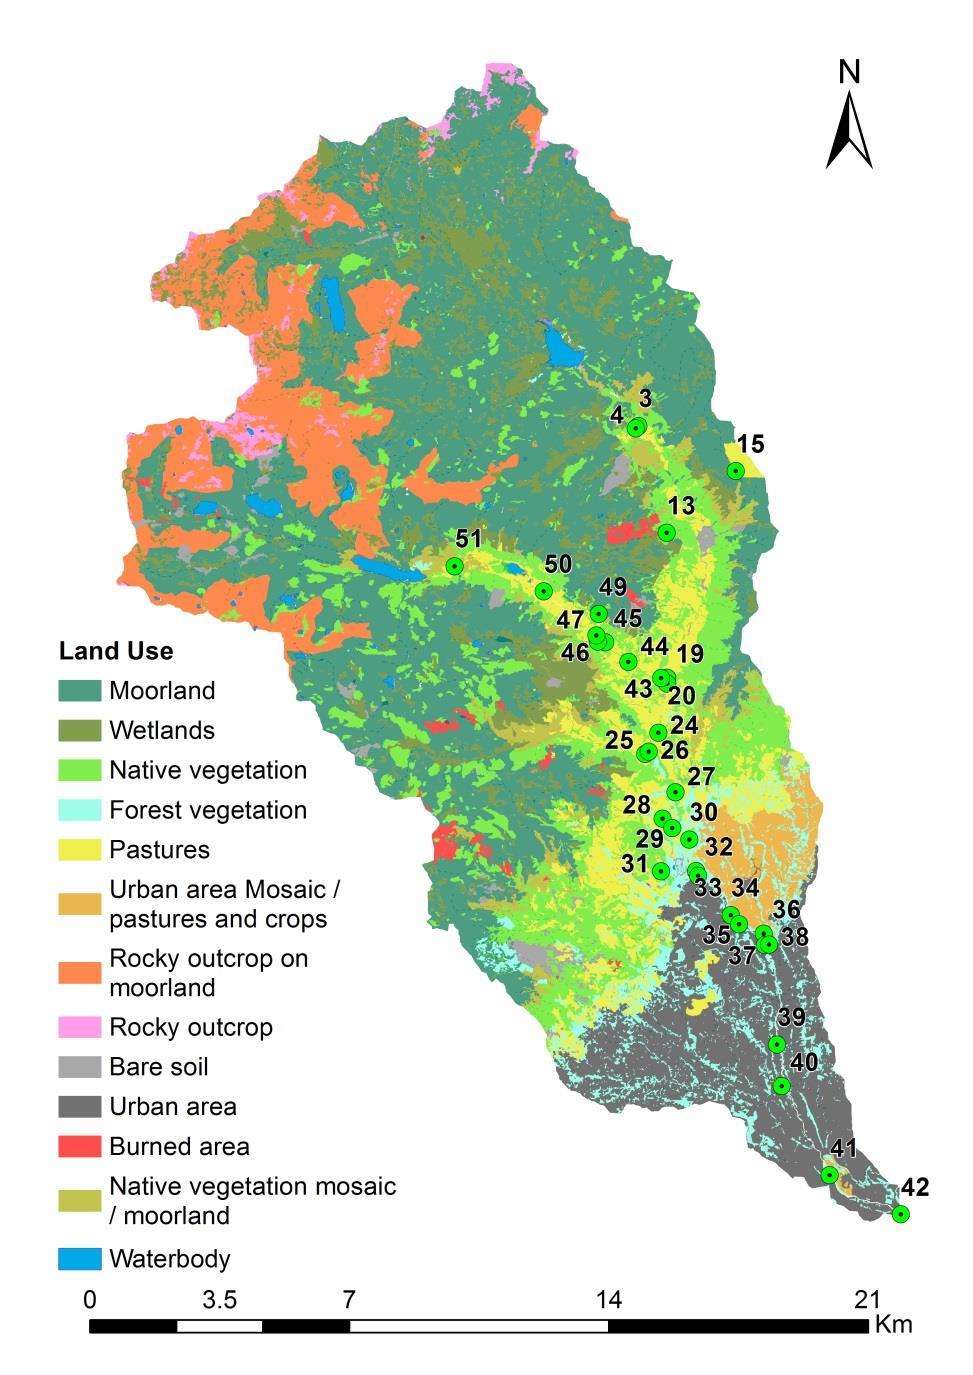


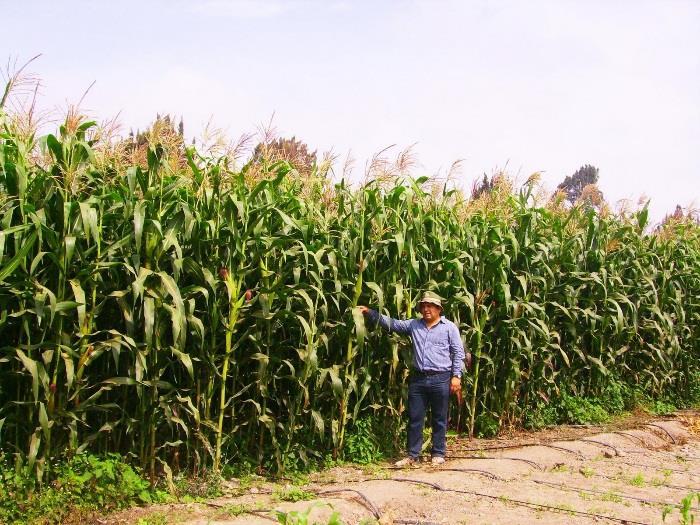
7 LAND USE


8 DATA COLLECTION: - Completed information on 33 locations Physicochemical, hydraulic, microbiological Laboratory BOD 5, COD, Nitrate + Nitrite, Ammonia, Organic Nitrogen, Phosphates, Total Phosphorus, Fecal and Total Coliforms, Real Color, Turbidity, Total Solids Field: Flow Velocity, Ph, Conductivity, Temperature, Dissolved Oxygen Macrobenthos 39 families (taxa) found


9 Variables Variation
10 - Ecuadorian Water Quality Regulation for Fecal Coliforms Regulations Water used to Fecal Coliforms Limited Value MPN/100 ml Recreational Recreational with primary contact 200 Agriculture Agriculture and Livestock 1,000 Raw water raw water previous to non-conventional treatment* 2,000 * Conventional treatment refers to chemical addition, rapid mixing, flocculation and sedimentation Netherlands Annual Ecology Meeting 2018 (NAEM2018), Lunteren, The Netherlands, Date (13/02/2018) Department of Applied Ecology and Environmental Biology, Research Group Aquatic Ecology (AECO) Ruben.JervesCobo@UGent.be
11 BIOLOGICAL WATER QUALITY Biological Monitoring Working Party Index - Col BMWP-Col = f(sensitivity of Macrobenthos) Sensitivity -> 1-10 (Low High Sensitivity) Class Quality BMWP Color I Very Good > 100 II Good III Moderate IV Deficient V Bad 15 Netherlands Annual Ecology Meeting 2018 (NAEM2018), Lunteren, The Netherlands, Date (13/02/2018) Department of Applied Ecology and Environmental Biology, Research Group Aquatic Ecology (AECO) Ruben.JervesCobo@UGent.be
12 Model development Ecosystem Training dataset Validation dataset 1 Measurement set 2
13 Methodology Pruned Multi-target Clustering Trees (PMCT) Classification trees: searching for if-then rules (threshold values): 100% reliable and safe models O a c b O>=c O<c Absence Presence O>b O<=b B<a B>=a B
14 Model Performance - Models must be evaluated based on statistical and ecological criteria. - Models must be as clear and simple as possible. Settings - Machine learning software: Waikato Environment for Knowledge Analysis (WEKA) - Three, five, ten-fold cross validation (k fcv) - Pruning process Pruning confidence factors (PCF): 0.25, 0.10 Netherlands Annual Ecology Meeting 2018 (NAEM2018), Lunteren, The Netherlands, Date (13/02/2018) Department of Applied Ecology and Environmental Biology, Research Group Aquatic Ecology (AECO) Ruben.JervesCobo@UGent.be
15 Model Performance - Confusion matrix from Decision Tree Models: Observed Class Predicted Class Yes No Yes TP FN No FP TN - Correctly Classified Instances (CCI):> Cohen s Kappa Statistic: > False positive (FP = 0) Netherlands Annual Ecology Meeting 2018 (NAEM2018), Lunteren, The Netherlands, Date (13/02/2018) Department of Applied Ecology and Environmental Biology, Research Group Aquatic Ecology (AECO) Ruben.JervesCobo@UGent.be
16 Model Optimization: - Cost sensitive classifier (CSC): gives new weights in training instances FN, FP - Overall confusion entropy of a confusion matrix (CEN): evaluates the confusion level of the class distribution of misclassified samples: CEN = P 1 + P 2 CEN j P 1 = TP + FN 2 TP + FN + FP + TN and P 2 = FP + TN 2 TP + FN + FP + TN Netherlands Annual Ecology Meeting 2018 (NAEM2018), Lunteren, The Netherlands, Date (13/02/2018) Department of Applied Ecology and Environmental Biology, Research Group Aquatic Ecology (AECO) Ruben.JervesCobo@UGent.be
17 Model Optimization: CEN j = P FN log 2 P FN P FP log 2 P FP P j : confusion probability of class j CEN j : confusion entropy of class j. P FP = FP FN + FP + 2TP and P FN = FN FN + FP + 2TN - P FP and P FN are the misclassification probability of classifying the samples of class i to class j subject to class j - Higher accuracy corresponds to lower confusion entropy Netherlands Annual Ecology Meeting 2018 (NAEM2018), Lunteren, The Netherlands, Date (13/02/2018) Department of Applied Ecology and Environmental Biology, Research Group Aquatic Ecology (AECO) Ruben.JervesCobo@UGent.be
18 3- RESULTS BIOLOGICAL WATER QUALITY BMWP-Col: - 9 good - 15 moderate - 6 poor - 3 bad
19 Fulfillment of Fecal Coliforms limits in relationship to water use (a) Recreational with primary contact (b) Agricultural - Livestock use and (c) raw water
20 Model Performance First Model: Recreational water use with Primary Contact Fecal Coliforms Regulation. CCI = 77% Kappa = 0.56 FP = 0 CEN = 0.64
21 Model Optimization (1) Second Model: Recreational water use with Primary Contact Fecal Coliforms Regulation. CCI = 79% Kappa = 0.58 FP = 0 CEN = 0.61
22 Model Optimization (2) Third model: Irrigation use and raw water previous to non-conventional treatment use - Fecal Coliforms Regulation. CCI = 87% Kappa = 0.69 FP = 0 CEN = 0.53
23 4- CONCLUSION - Three models were selected. Two Models: fecal coliforms threshold in recreational with primary contact water use. One Model: fecal coliforms limits in agricultural - livestock water use, or raw water for drinking water treated with non-conventional processes. - The cost-sensitive classifier (CSC) in the Weka can reduce false positives (FP) in the confusion matrix, improving the reliability of the resulting models.
24 Acknowledgement - VLIR-UOS IUC Programme - University of Cuenca - VLIR Ecuador Biodiversity Network Project - Council of the Machangara River Basin Netherlands Annual Ecology Meeting 2018 (NAEM2018), Lunteren, The Netherlands, Date (13/02/2018) Department of Applied Ecology and Environmental Biology, Research Group Aquatic Ecology (AECO) Ruben.JervesCobo@UGent.be
25 Thank you? Netherlands Annual Ecology Meeting 2018 (NAEM2018), Lunteren, The Netherlands, Date (13/02/2018) Department of Applied Ecology and Environmental Biology, Research Group Aquatic Ecology (AECO)