Influence of purging the surrounding monitoring wells for groundwater sampling during a hydraulic conductivity test in a monitoring well.
|
|
|
- Shona Robinson
- 5 years ago
- Views:
Transcription


1 Influence of purging the surrounding monitoring wells for groundwater sampling during a hydraulic conductivity test in a monitoring well. Hafeez Chishti, Ph.D., P.Geol. PHH ARC Environmental 1
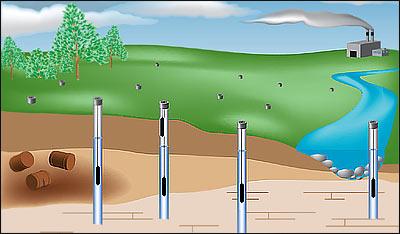
2 SLUG TEST is a common and reliable way of determining the lateral hydraulic conductivity of local and distinct geologic horizons under in-situ conditions. Slug tests are often used at hazardous waste sites, since large volume of contaminated water do not have to be dispersed, as in a pump test. 2
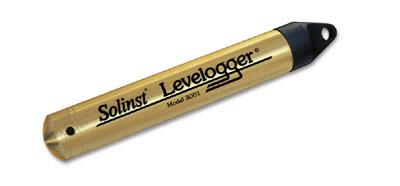
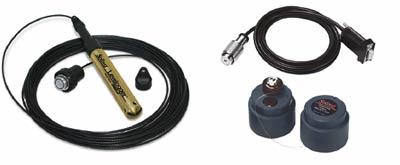
3 Technique SWL Bailer An instantaneous drop or rise of water level is created in a monitoring well and the recovery of water levels back to normal is recorded with respect to time. The time it takes for getting back to original static water level actually represents the ease of flow of groundwater through the soil pores measured as Hydraulic Conductivity (K). The numerical value of K is calculated using certain formulae. t 0 Logger The technique used to create a sudden drop in water level and measuring its rise back with time is known as Rising Head Method, and the technique used to create a sudden rise in water level and measuring its fall back with time is known as Falling Head Method. 3
4 The simplest interpretation of piezometer recovery is that of Hvorslev (1951). The analysis assumes a homogenous, isotropic medium in which soil and water are incompressible. Hvorslev's expression for hydraulic conductivity (K) is: K r = 2 Le ln R 2L T e o where: K = Hydraulic Conductivity (m/s) r = Radius of the well casing (m) R = Radius of the borehole (well casing plus sand pack) (m) L e = Length of well screen (m) T 0 = Time for the water level to rise or fall 37% of the initial change (s). 4
5 PREFERRED PRACTICES for conducting a slug test 1) Selection of the monitoring well with soil profile that best represents the site If soil around the well is not representative of the site, value of K will not be the representative of the site. 2) Preference of using rising head rather than the falling head method Falling head method employ rise of water in the well which entails: a) Water going into unsaturated zone relatively quickly compared to saturated zone b) Risk of spreading of contamination in the unsaturated zone above water table. 3) Creating instant draw down rather than using methods of continuous pumping Creating instant draw down using a bailer allow the measurement of Time Zero (t 0 ) reading, compared to using a pump which pumps water out but at the same time letting formation water into the well. 4) Recording monitoring well dimensions Omitting to record radius of well standpipe, borehole annulus, and the height of well standpipe above grade may pose problems in slug test analyses. 5

6 Borehole Log 6
7 Recommended Time Intervals (Minutes) For manual measurements of drawdown 7

8 8
9 A Typical Drawdown Curve Recovery (Meters) Time (Minutes) SWL t 0 Bailer Logger 9

10 Site:

11 Borehole Log 11
12 Time Drawdown with Purging Drawdown (m) Test: 424-B

13 Time-Drawdown without purging Test: 424-B
14 Test: 424-B Drawdown (m) During purging K = 1.45x10⁻⁷ m/s
15 Test: 424-B K = 9.7x10⁻⁸ m/s Test: 424-B Drawdown (m) K = 1.4x10⁻⁷ m/s
16 Hvorslev Analyses Non-purging K = 9.7x10⁻⁶ Purging Time (Minutes) K = 1.4x Recovery (Meters)
17 2nd Set of Similar Data from a Different Site Purging was in progress when test started Test 296-D Test 296-D
18 Purging was in progress when test started Test: 296-D K = 3.42 x10⁻⁷ Without Purging Recovery after 25 minutes: 64% Recovery after 240 minutes: 97% With Purging Recovery after 25 minutes: 14% Recovery after 240 minutes: 91% Test completed without purging Test: 296-D K = 1.23 x

19 3rd Set of Data From a Different Site Purging started when test started Purging started while test was in progress Test: 470-D K = 3.56x Test completed without purging Test: 470-D K = 1.67x

20 Hvorslev Analyses Non-purging Purging K = 1.67 x10⁻⁷ K = 3.56 x10⁻⁷ These two are comparable K = 3.41x
21 Site:
22 Recovery (Meters) Time (Minutes) Test: 472-A Recovery (m) Test: 472-A Test: 472-A Without Purging During Purging Without Purging Recovery after 25 minutes: 34% Recovery after 120 minutes: 89% With Purging Recovery at 25 minutes: 13% Recovery at 120 minutes: 65% 22
23 Hvorslev Analyses K = 1.32x10⁻⁷ K = 8.13x
24 Coarse grained soils especially gravel and very coarse to coarse sand, do not appear to have any significant effect of purging (for water sampling) in the vicinity on the test run. 24
25 CONCLUSIONS Purging of water for groundwater sampling or for any other reason, must be avoided in the vicinity of a monitoring well at which a slug test is in progress. This is because purging creates drawdown which may interfere with drawdown levels being recoded at the test well. Such an effect of purging is significant in soils with fine to medium grain, and is minimum in coarse grained soils. Preferably, slug test should be performed as a standalone activity. 25
26 Thank You 26