Vancouver: Zero Waste by 2040
|
|
|
- Scot Gardner
- 5 years ago
- Views:
Transcription


1 Vancouver: Zero Waste by 2040 WasteMINZ Conference Nov Hamilton, New Zealand Chris Underwood, P.Eng

2 Presentation Overview 1. Background 2. Zero Waste Policy & Progress 3. Zero Waste 2040 Strategy Development 2
3 Background

4 Some stats worth considering

5 Only 1% of materials in North American end up in and are still be used within products six months after their sale.

6 11.8 million tonnes of textiles get landfilled in North America every year.
.")
7 In the Vancouver region 50% of food wasted at home is avoidable (from over purchasing, not consuming prior to expiry, discarded left overs).

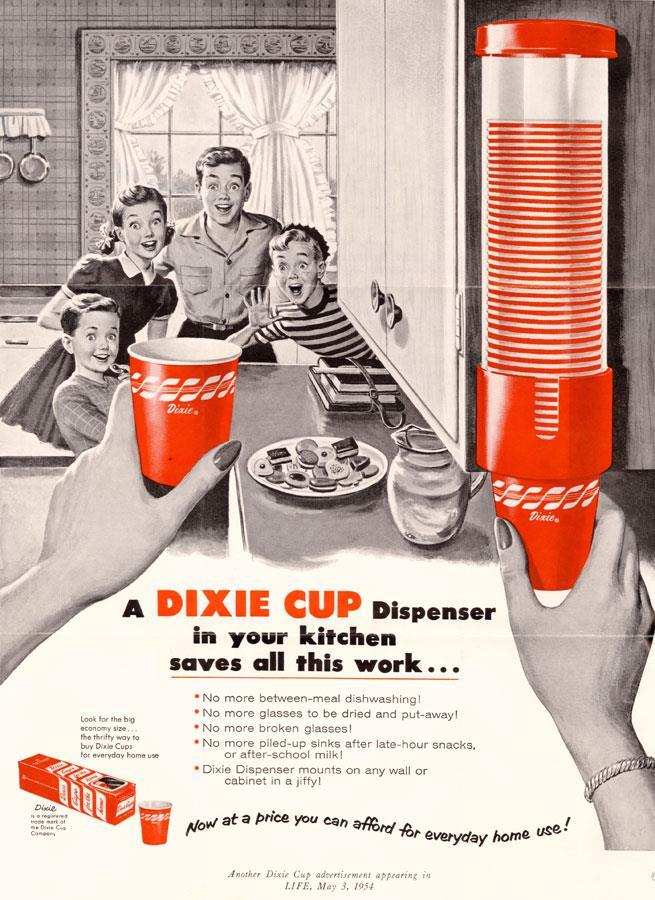
8 Each week in Vancouver 2.6 million disposable coffee cups are thrown away as garbage.

9 It costs the City of Vancouver $2.5 million annually to collect single use items from public waste bins and clean up as litter.

10 Over 2 million plastic shopping bags are thrown in the garbage each week in Vancouver (63% are reused as garbage bags).

11 City of Vancouver One of 21 cities in the Metro Vancouver Region 2016 Population: Metro Vancouver 2.4 million City of Vancouver 631,486


12 City of Vancouver Solid Waste Services Garbage & Organics Collections Transfer Station & Depot Landfill & Recovery Center Public Realm Cleaning Program Design & Development Education, Outreach & Engagement Policy Development, Bylaws & Enforcement 12
13 Province of British Columbia Disposal and recycling regulation (Extended Producer Responsibility - EPR) Metro Vancouver Regional District Long range regional planning Regional transfer & disposal Private facility licensing Governance & Stakeholders 13
 and Multi Unit Residential properties Recycling")
14 Province of British Columbia Disposal and recycling regulation (Extended Producer Responsibility - EPR) Governance & Stakeholders Metro Vancouver Regional District Long range regional planning Regional transfer & disposal Private facility licensing Private Sector For Profit Collection from Industrial, Commercial and Institutional (ICI) and Multi Unit Residential properties Recycling material processing, brokerage and shipping Some disposal capacity Private Sector Not for Profit EPR stewardship organizations 14 Social enterprise organizations
 Plan was based on new WTE capacity Required control of commercial waste flow - rejected by Provincial government Development of new WTE capacity is on")
15 2010 Regional Solid Waste Plan Highest goal of plan is Minimize Waste Generation Primary focus has been on disposal and diversion (targets: 70% 2015, 80% 2020) Plan was based on new WTE capacity Required control of commercial waste flow - rejected by Provincial government Development of new WTE capacity is on hold 15
16 Regional Waste Disposal System 16
17 Regional Waste Disposal System 6 Transfer Stations 17
18 Regional Waste Disposal System 6 Transfer Stations 1 Landfill 18
19 Regional Waste Disposal System 6 Transfer Stations 1 Landfill 1 Waste to Energy Incinerator 19
 ~20% ~60% ~20%")
20 Total Regional Waste Disposed 1.22 million tonnes (2015 all sectors) ~20% ~60% ~20% Private Sector LFs 20
 Tonnes Truckloads Sector")
21 Total Vancouver Waste Disposed 351,000 tonnes (2015 all sectors) Tonnes Truckloads Sector 21

22 Total Vancouver Waste Diverted Recycled & Composted 62% 573,000 Tonnes Disposed 38% 351,000 Tonnes 2015 all sectors 22
23 Per Capita Stats Total Generation, Disposal & Recycling Per Capita 1,280 kg 790 kg Canadian Average Disposed per Capita 160 kg/capita more than Vancouver 490 kg 23

24 Zero Waste Policy & Progress 24


25 Supporting City Policy 2011 Established Goal Areas Set 2020 Targets 2015 Measured Progress Updated Priority Actions 25
26 Greenest City Action Plan ZERO CARBON ZERO WASTE Green Buildings Green Transportation Zero Waste Access to Nature HEALTHY ECOSYSTEMS Clean Water Local Food Clean Air 3 high-level objectives 10 goal areas 26


27 Greenest City Action Plan ZERO CARBON Green Buildings Green Transportation ZERO WASTE Zero Waste 2020 Target: 50% less waste disposed compared to 2008 Access to Nature HEALTHY ECOSYSTEMS Clean Water Local Food Clean Air 3 high-level objectives 10 goal areas 27

28 What is Zero Waste? As both a philosophy and goal, zero waste aims to reduce and ultimately eliminate garbage. 28
29 Progress Annual Tonnes 600, , ,000 27% (130,000 tonne reduction, 2015) 300, ,000 Target 50% 100,
 Organics disposal ban and mandatory food scraps programs covering all properties")
30 Major Initiatives Partial food scraps residential collection biweekly (2010) Change collection frequencies - full food scraps weekly + garbage biweekly (2013) Organics disposal ban and mandatory food scraps programs covering all properties (2015) 30
31 Jan Feb Mar Apr May Jun Jul Aug Sep Oct Nov Dec Jan Feb Mar Apr May Jun Jul Aug Sep Oct Nov Dec Jan Feb Mar Apr May Jun Jul Aug Sep Oct Nov Dec Jan Feb Mar Apr May Jun Jul Aug Sep Tonnes of Garbage Garbage Reduction after Switch to Biweekly Garbage and Weekly Green Bin Collection June 2013 = start of every other week garbage collection 44% drop
32 Transformation of City s Garbage & Green Bin Collection Operations 32

 33")
33 Major Initiatives Green Demolition Waste Bylaw (2014) 75% reuse/recycle rate of demolition waste from pre-1940 homes 90% diversion from pre-1940 character homes Transitioned residential recycling collection to provincial stewardship agency and added more materials to curbside and depot programs ( ) 33
34 Composition of Waste Disposed All Sectors 2015 Paper 13% Other Waste 34% Construction 23% Plastics 12% Food Scraps 18% Source: Metro Vancouver 2015 Solid Waste Composition Report & DLC Waste Composition Monitoring Report

35 Zero Waste 2040 May 31, 2016: Vancouver Council directed staff to develop a long-term plan for transforming Vancouver into a zero waste community by
 300,000 200,000 TARGET 100,000 ZW 2040 GOAL 0 2008 2015 2020 2030")
36 2020 Target and 2040 Goal Annual Tonnes 600, , ,000 27% (2015) 300, ,000 TARGET 100,000 ZW 2040 GOAL

37 Zero Waste Strategy Development 37

 WASTE")

38 Situation Analysis BUILT ENVIRONMENT FOOD PRODUCTS 112,00 tonnes (2015) 96,000 tonnes (2015) 143,000 tonnes (2015) WASTE MANAGEMENT 351,000 tonnes (2015) Note: 2015 Vancouver tonnes extrapolated from Regional data 38
39 Barriers Societal Consumption = economic growth Individual ownership = convenient & status Low priced goods = replace instead of repair Speed of technology = replace early & often Single use disposable = quick, clean & safe 39
40 40
41 Strategic Framework VISION What does a zero waste future look like? 41
42 Strategic Framework VISION What does a zero waste future look like? DIRECTION How do we get there? 42
43 Strategic Framework VISION What does a zero waste future look like? DIRECTION How do we get there? ENGAGE Who needs to be involved? 43
44 Strategic Framework VISION What does a zero waste future look like? DIRECTION How do we get there? ENGAGE Who needs to be involved? ACTION What is the City s role? 44
45 Strategic Framework VISION What does a zero waste future look like? DIRECTION How do we get there? ENGAGE Who needs to be involved? ACTION What is the City s role? ASSESS How do we measure success? 45
46 Strategic Framework VISION What does a zero waste future look like? DIRECTION How do we get there? ENGAGE Current stage of plan development Who needs to be involved? ACTION What is the City s role? ASSESS How do we measure success? 46
47 Zero Waste Vision Vancouver aspires to be a zero waste community by 2040, with no solid waste disposed to landfills and incinerators. Residents, businesses and visitors will think differently about everything currently disposed. Zero waste will be achieved by avoiding and reducing waste, keeping materials in circulation as long as possible, and then recycling, composting and producing renewable energy with what remains. (draft) VISION 47


48 Zero Waste Vision Protect the Environment Build Prosperity Connect People VISION 48

49 Backcast from a Zero Waste Future DIRECTION 49
50 Consultation & Collaboration Government First Nations Industry Zero Waste Community Residents Not-For- Profit Academics ENGAGE 50

51 Themes: What we ve heard so far 1. Take a collaborative systems-wide approach 2. Pursue integrative opportunities: environmental + social + economic 3. Foster a zero waste culture 4. Transition to a strong circular economy 5. Support zero waste innovation, infrastructure, technology & services 6. Develop enabling zero waste policy & regulation 7. Improve data collection, research & accessibility 8. Lead by example 9. Collaborate & influence globally 10. Adapt ENGAGE 51
52 What is evident 1. We can t recycle our way to Zero Waste 2. Priority focus needs to be on waste prevention and reduction 3. There is opportunity to grow the reuse/sharing economy 4. Need to support local demand for recyclable materials 5. Many systems and technologies needed don t yet exist 6. An individual municipality can t do it on their own 7. The City s solid waste business operations need to align with zero waste hierarchy ACTION 52
53 Operational Realignment Avoid Historical Focus Reduce Reuse Recycle Recover Residuals Mgmt Zero Waste Focus Future City Resource Allocation Current City Resource Allocation 53
54 Operational Realignment Avoid Reduce Reuse Recycle Recover Residuals Mgmt 54
55 What has become evident 1. We can t recycle our way to Zero Waste 2. Priority focus needs to be on waste prevention and reduction 3. There is opportunity to grow the reuse/sharing economy 4. Need to support local demand for recyclable materials 5. Many systems and technologies needed don t yet exist 6. An individual municipality can t do it on their own 7. The City s solid waste business operations need to align with zero waste hierarchy 8. Need to recognize and leverage our span of influence/control as a municipal government ACTION 55


56 Span of Influence/Control Influence Control Educate Research Challenge Advocate Incentivize Build Partner Invest Regulate Service Procure ACTION 56
57 Measuring Success Municipal metrics need to evolve Tonnes or % diverted is less relevant Wasted food rather than food waste Need a combination of measures and performance indicators Tonnes reduced and materials recovered/reused/repurposed is more important Need complimentary measures to reflect broader environmental, economic and social benefits ASSESS 57

58 Closing Thought IT S TIME TO SHIFT OUR THINKING ABOUT WASTE.