Grounding Water: An Exploration of the Unseen World Beneath Our Feet
|
|
|
- Hollie Bishop
- 5 years ago
- Views:
Transcription

1 1 Grounding Water: An Exploration of the Unseen World Beneath Our Feet Kerry Schwartz, Director, Arizona Project WET Protect Your Groundwater Day: Tuesday, September 9, 2014
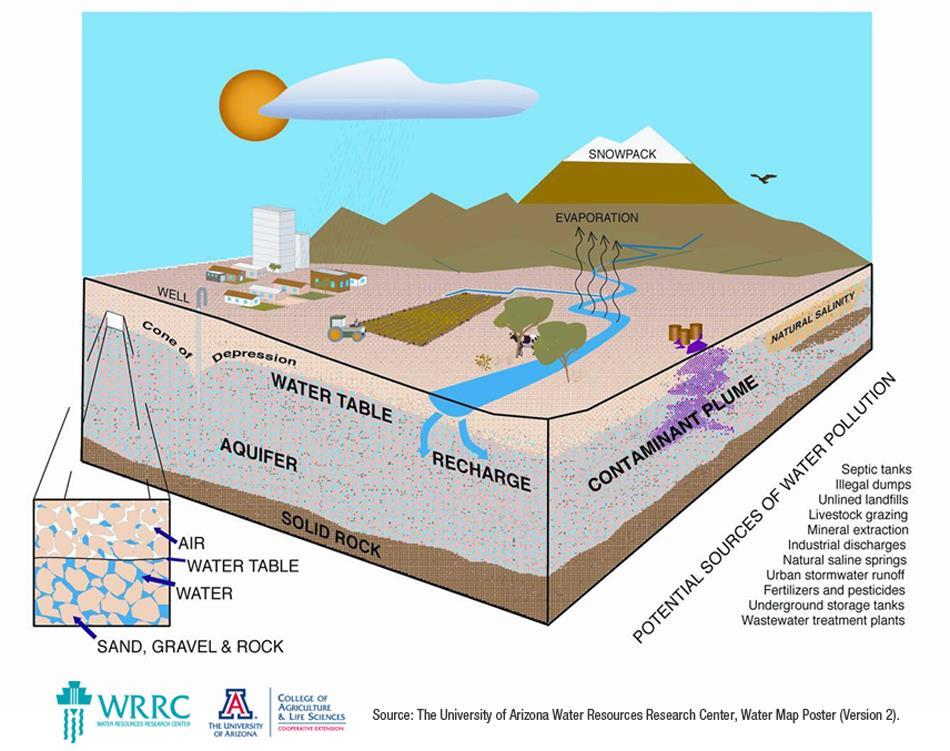
2 What I Hope to Convey Groundwater is important. The sources of peoples misconceptions about groundwater need to be addressed in our instructional tools. The use of models can greatly assist in building conceptual understanding. People need to understand the groundwater system in order to protect it.
3 Worldwide Groundwater is the most abundant source of fresh water on earth, (97% of non-frozen fresh water). Approximately 44 % of the world s population regularly depends on GW. (NGWA, 2014) Globally GW provides 25% to 40% of the world s drinking water. ( Over the past century, groundwater withdrawal has grown to exceed natural renewable groundwater storage (or safe yield) in many areas of the globe. (Narasimhan, 2010)
4


5 Groundwater Use in the Arid West Water Availability for the Western United States Key Scientific Challenges By Mark T. Anderson and Lloyd H. Woosley, Jr., USGS Circular 1261, 2005
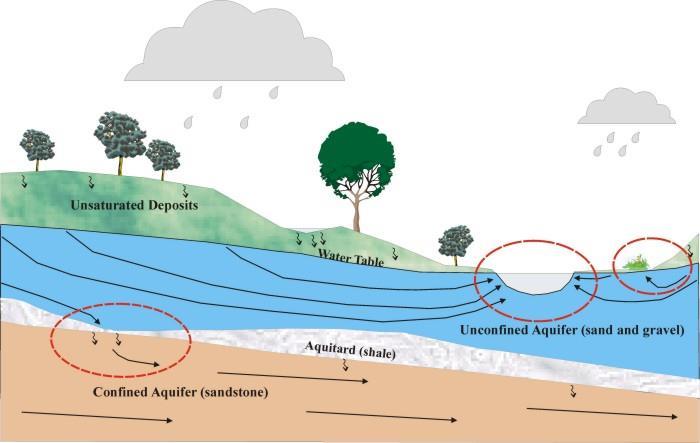
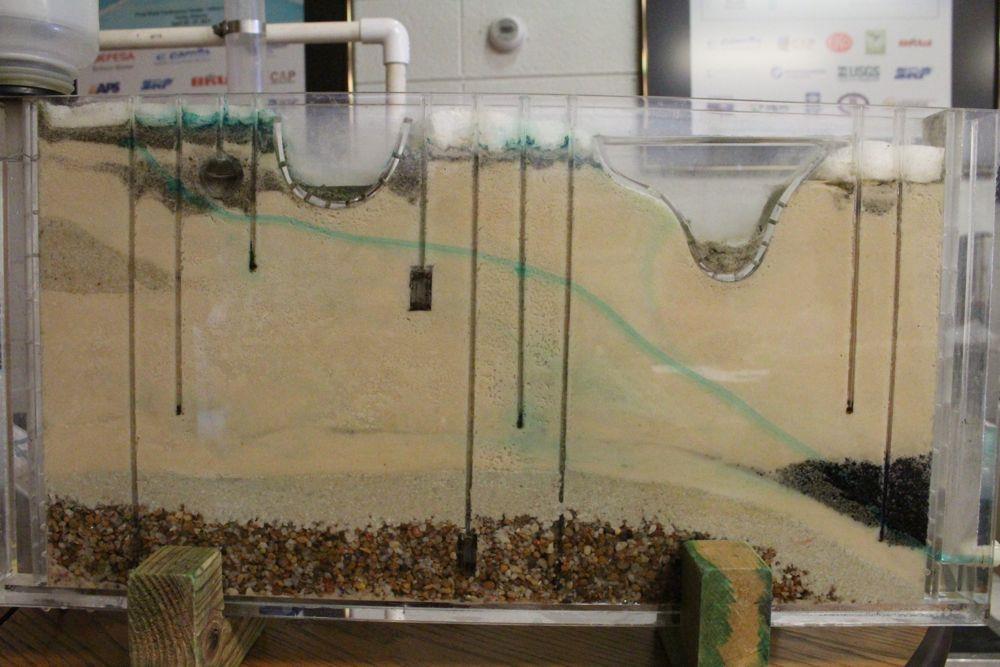
6 Aquifer Cross-Section Courtesy of Fernando Molina and Tucson Water Rincon Mountains Tucson Mountains Aquifer Boundary Santa Cruz River Aquifer Boundary Pantano River Well Aquifer Alluvial Aquifer Vadose zone Water table Saturated zone (aquifer) Air Water Sand, gravel & rock
7 Basin Full of Groundwater Amount of groundwater in storage : At 500 below the 1966 water table ~ 30.5 million acre-feet At 1,000 below the water table ~ 52 million acrefeet Geohydrology and Water Resources of the Tucson Basin, Arizona, 1973 By E. S. DAVIDSON WATER RESOURCES OF THE TUCSON BASIN, GEOLOGICAL SURVEY WATER-SUPPLY PAPER 1939-E Tucson Basin is ~10,000 feet deep in the middle of the Basin!


8 Major aquifers in the contiguous Western United States and select hydrographs showing changes in depth to water below land surface. Water Availability for the Western United States Key Scientific Challenges By Mark T. Anderson and Lloyd H. Woosley, Jr., USGS Circular 1261, 2005
 has a goal of Safe Yield Goal: To achieve and thereafter maintain a long-term balance between the annual amount of")

9 In Arizona: The Groundwater Management Act (GMA) of 1980 Established required groundwater management in Active Management Areas. Tucson Active Management Area (TAMA) has a goal of Safe Yield Goal: To achieve and thereafter maintain a long-term balance between the annual amount of groundwater withdrawn and the annual amount of natural and artificial recharge in the active management area. Required the adoption of Assured Water Supply Rules, which require growth to depend on renewable supplies. Conservation programs for each water using sector and management plans are developed by the Arizona Department of Water Resources every 10 years.
 -Wells, Reservoirs, Booster Stations,")

10 Recharging Colorado River Water - CAP water recharged through surface spreading basins (543 acres) -Wells, Reservoirs, Booster Stations, and Transmission Lines 1 Million Acre Feet (AF) Recharged April 2013 Banking 44,000 AF per year Courtesy of Fernando Molina and Tucson Water


11 Courtesy of Fernando Molina and Tucson Water

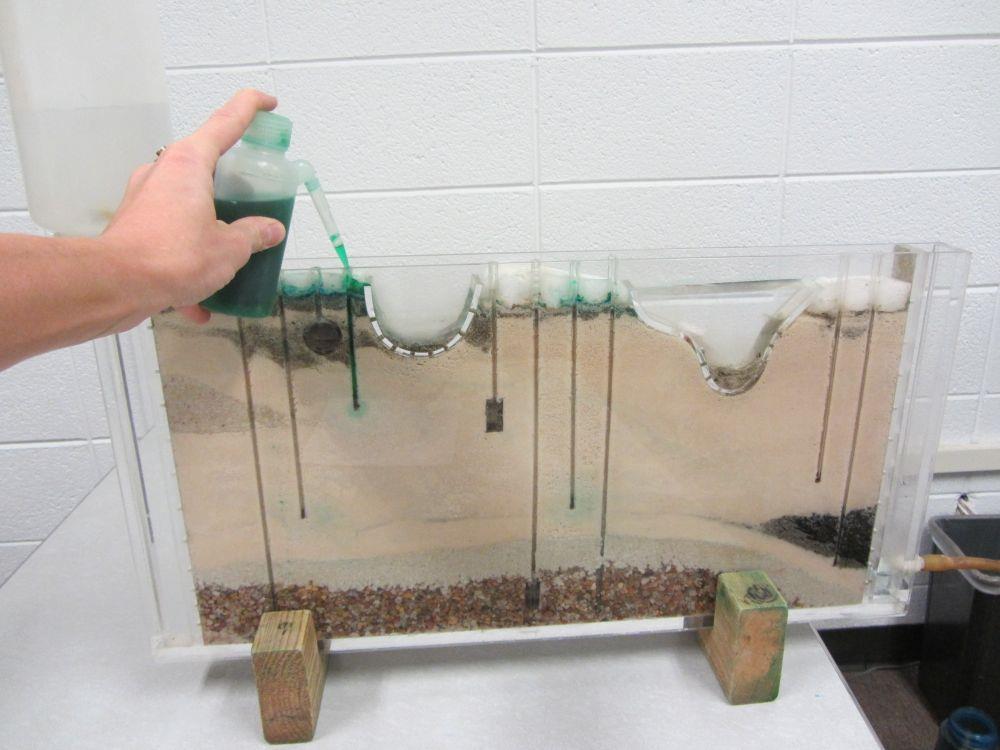
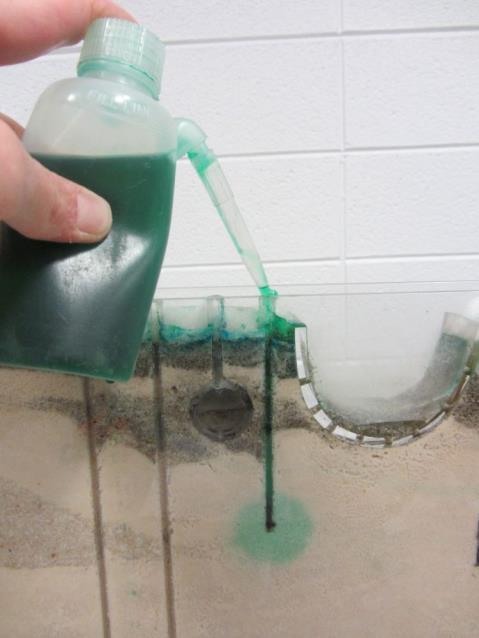
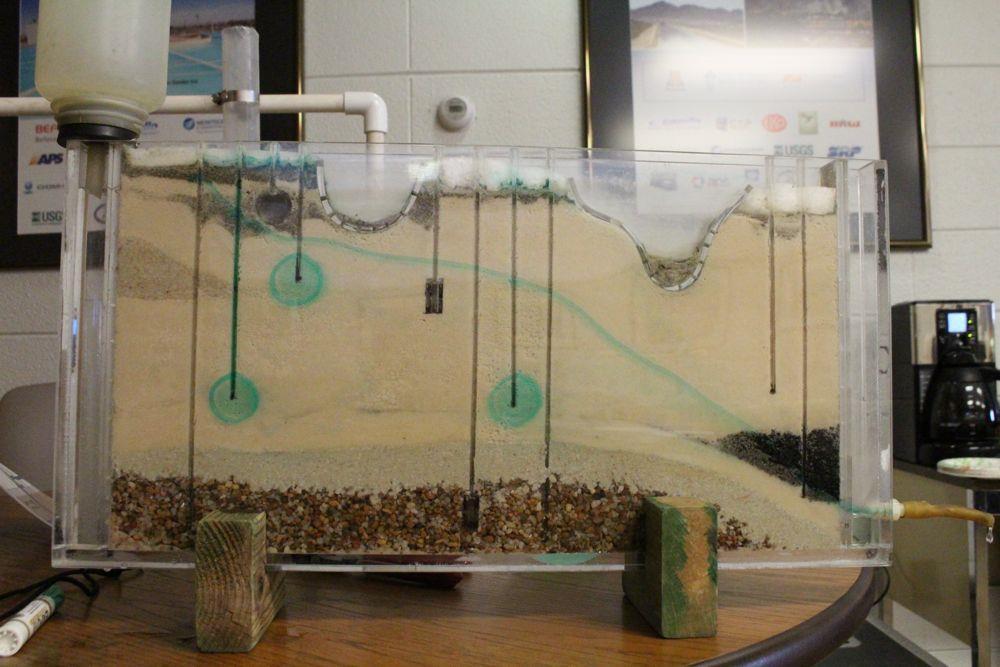
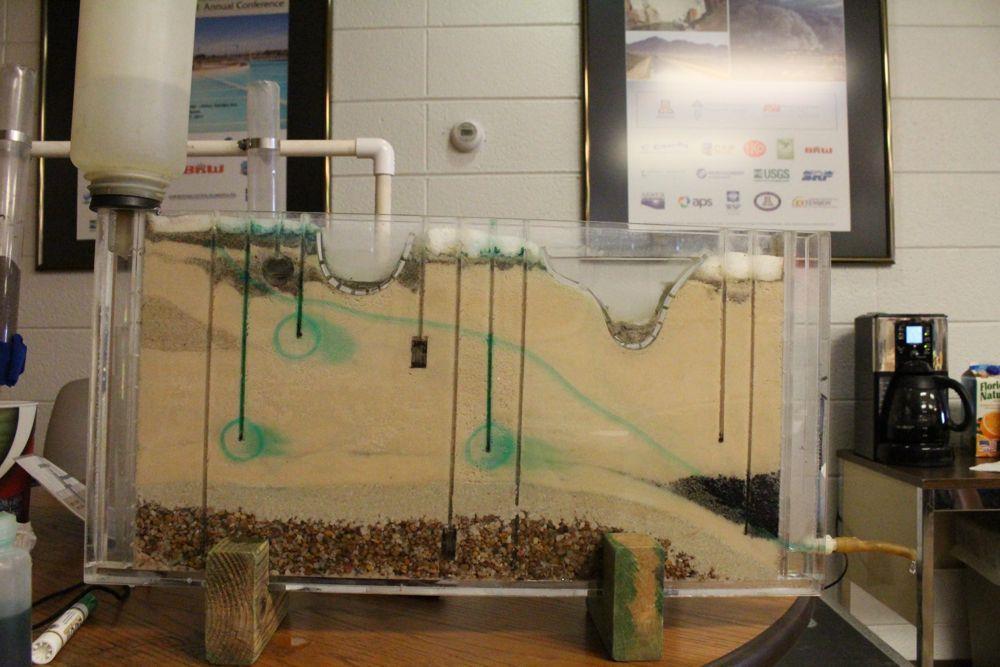
12 How do you teach about a complex system that you can t even see? A common pre assessment drawing when we were asking 4 th graders to draw that they think the groundwater system looks like
13 Table 2. Principal types of data and data compilations required for analysis of ground-water systems Physical Framework Topographic maps showing the stream drainage network, surface-water bodies, landforms, cultural features, and locations of structures and activities related to water Geologic maps of surficial deposits and bedrock Hydrogeologic maps showing extent and boundaries of aquifers and confining units Maps of tops and bottoms of aquifers and confining units Saturated-thickness maps of unconfined (water-table) and confined aquifers Average hydraulic conductivity maps for aquifers and confining units and transmissivity maps for aquifers Maps showing variations in storage coefficient for aquifers Estimates of age of ground water at selected locations in aquifers Hydrologic Budgets and Stresses Precipitation data Evaporation data Streamflow data, including measurements of gain and loss of streamflow between gaging stations Maps of the stream drainage network showing extent of normally perennial flow, normally dry channels, and normally seasonal flow Estimates of total ground-water discharge to streams Measurements of spring discharge Measurements of surface-water diversions and return flows Quantities and locations of interbasin diversions History and spatial distribution of pumping rates in aquifers Amount of ground water consumed for each type of use and spatial distribution of return flows Well hydrographs and historical head (water-level) maps for aquifers Location of recharge areas (areal recharge from precipitation, losing streams, irrigated areas, recharge basins, and recharge wells), and estimates of recharge Chemical Framework Geochemical characteristics of earth materials and naturally occurring ground water in aquifers and confining units Spatial distribution of water quality in aquifers, both areally and with depth Temporal changes in water quality, particularly for contaminated or potentially vulnerable unconfined aquifers Sources and types of potential contaminants Chemical characteristics of artificially introduced waters or waste liquids Maps of land cover/land use at different scales, depending on study needs Streamflow quality (water-quality sampling in space and time), particularly during periods of low flow From: Sustainability of Ground-Water Resources --USGS Circular 1186

14 Grounding Water: Building Conceptual Understanding through Multimodal Assessment Pre-Test Post-Test

15 Groundwater Post- Tests

16 Misconceptions Caused by Instructional Diagrams: Groundwater is blue and looks like a lake underground.

17 Groundwater Illustrations Can Lead to Misconceptions
18
19
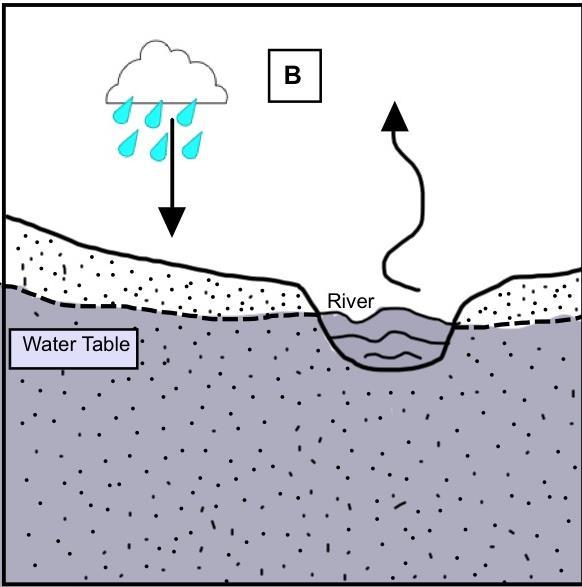
20

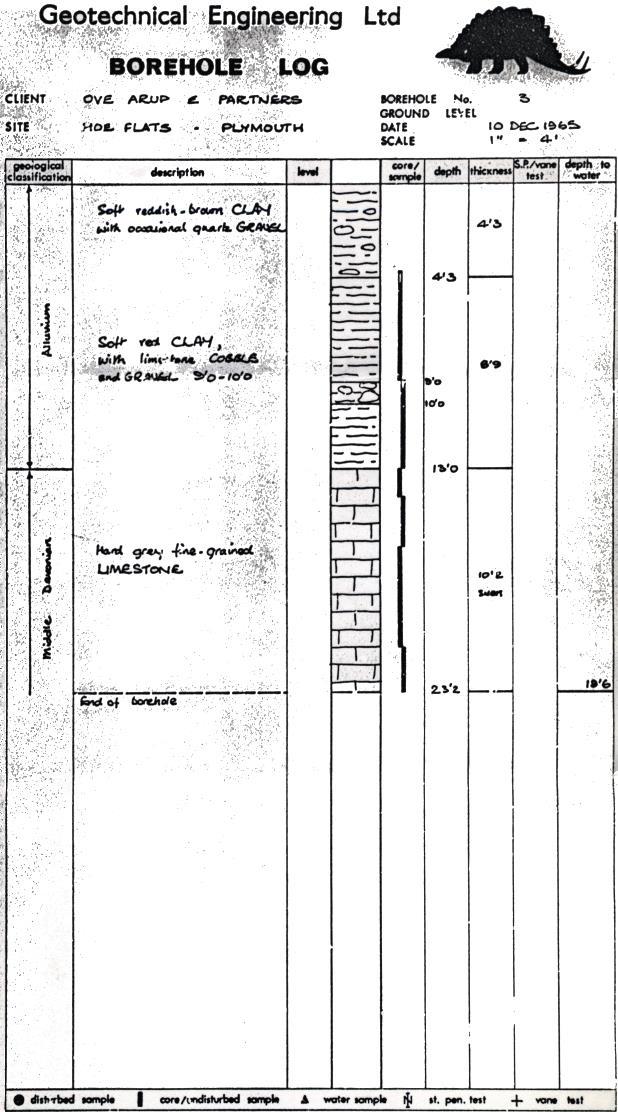
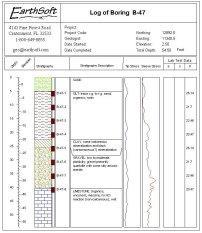
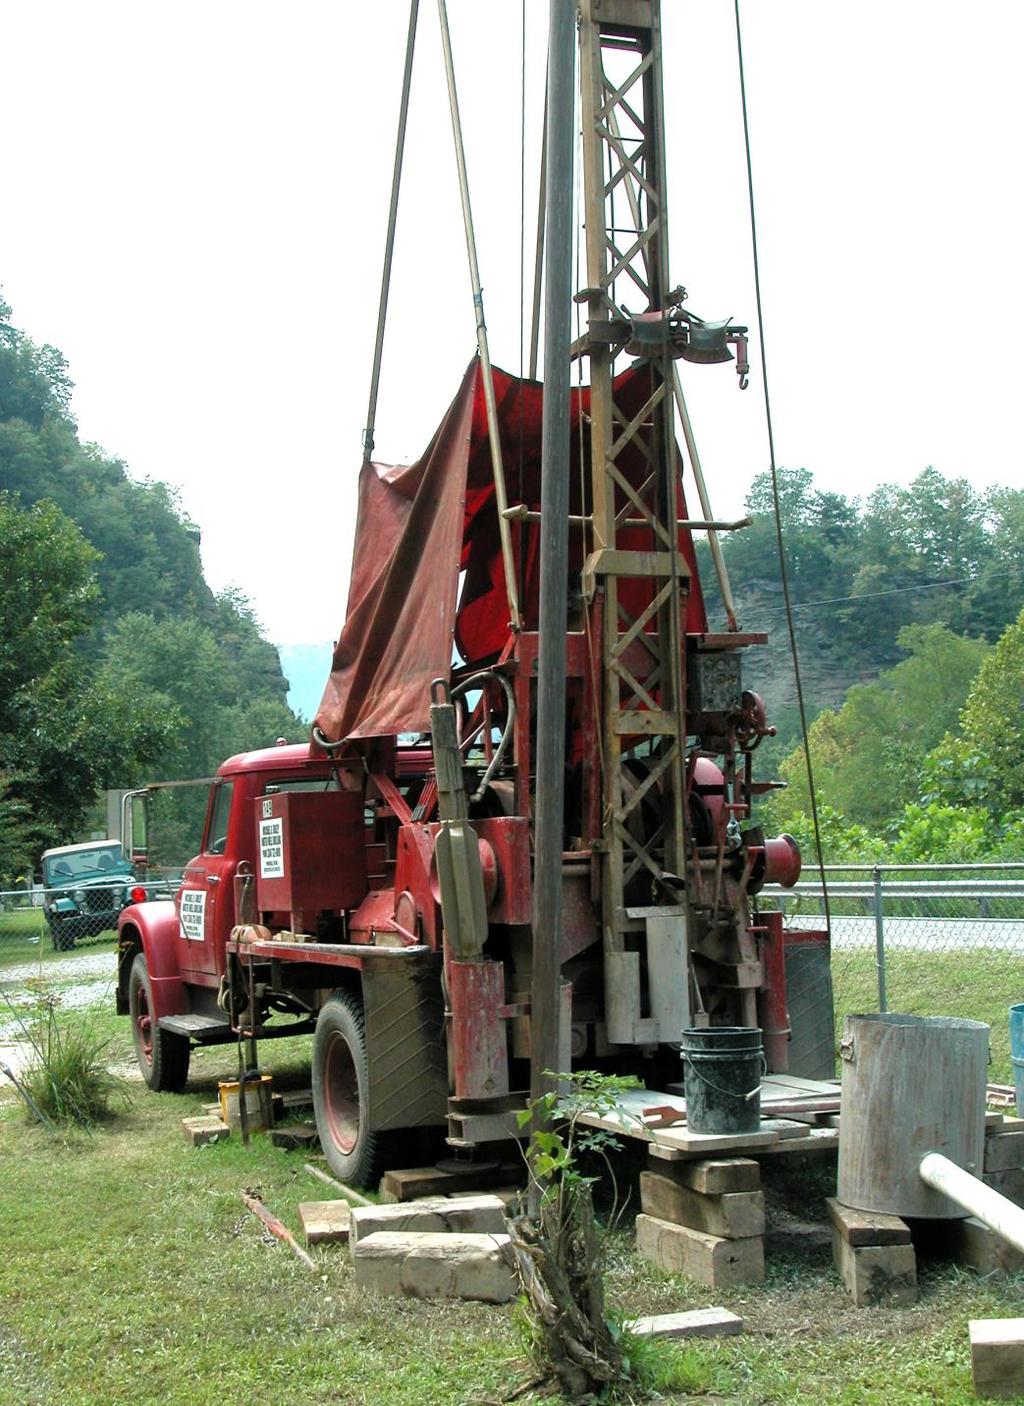
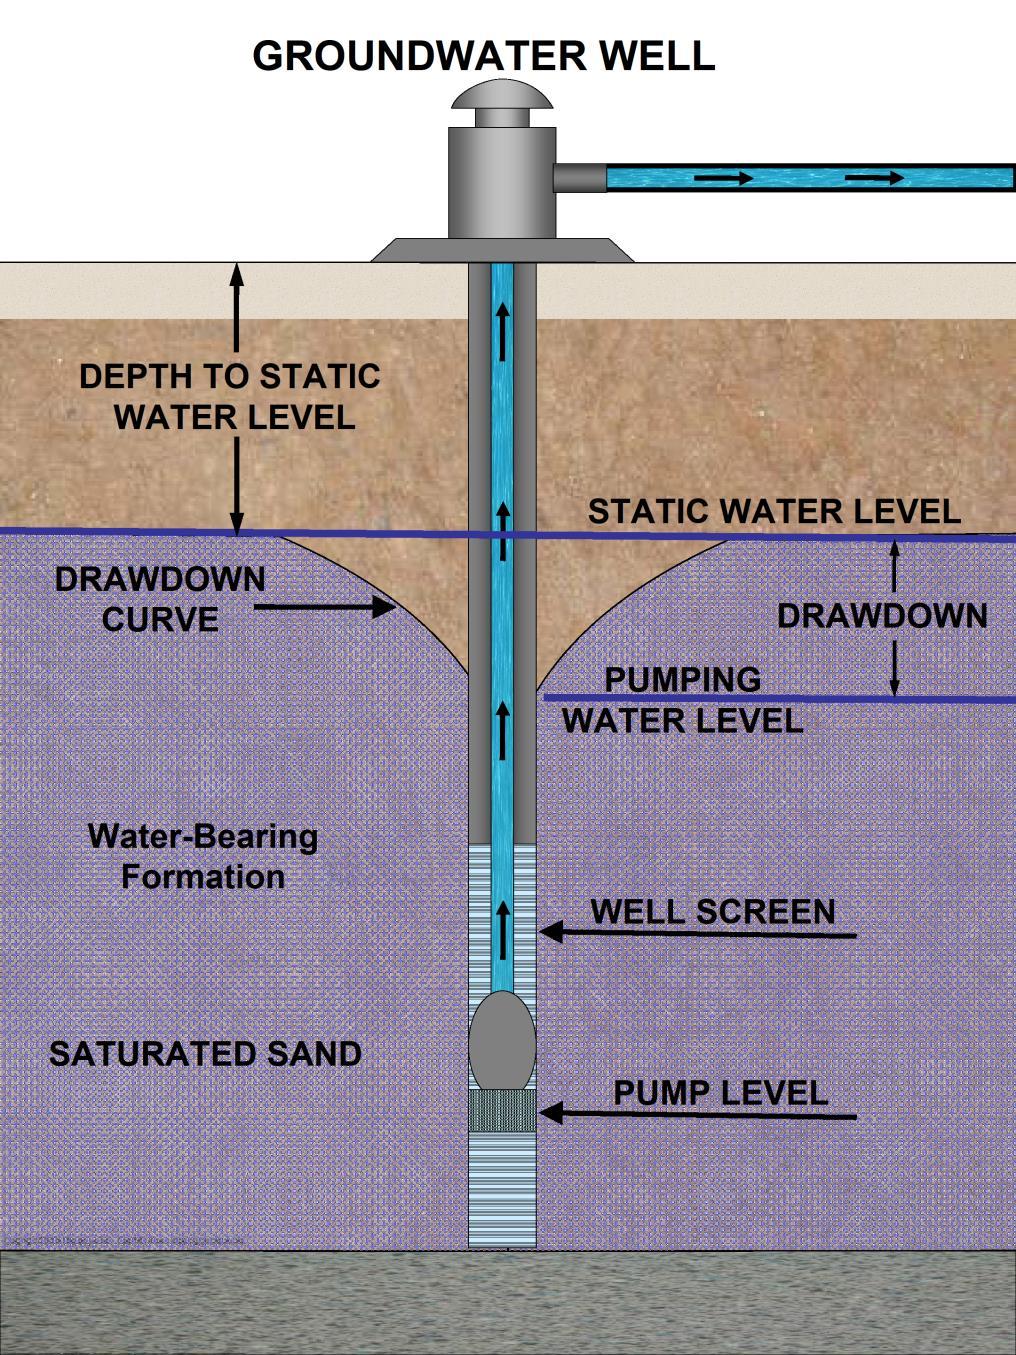
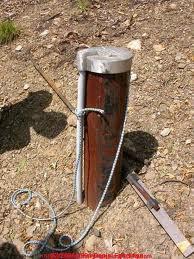
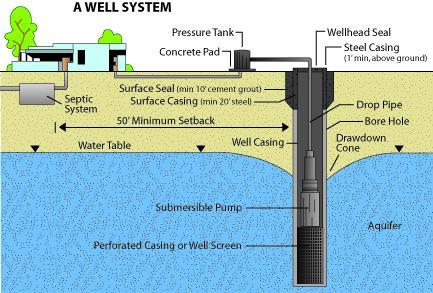
21 Borehole and Well Logs

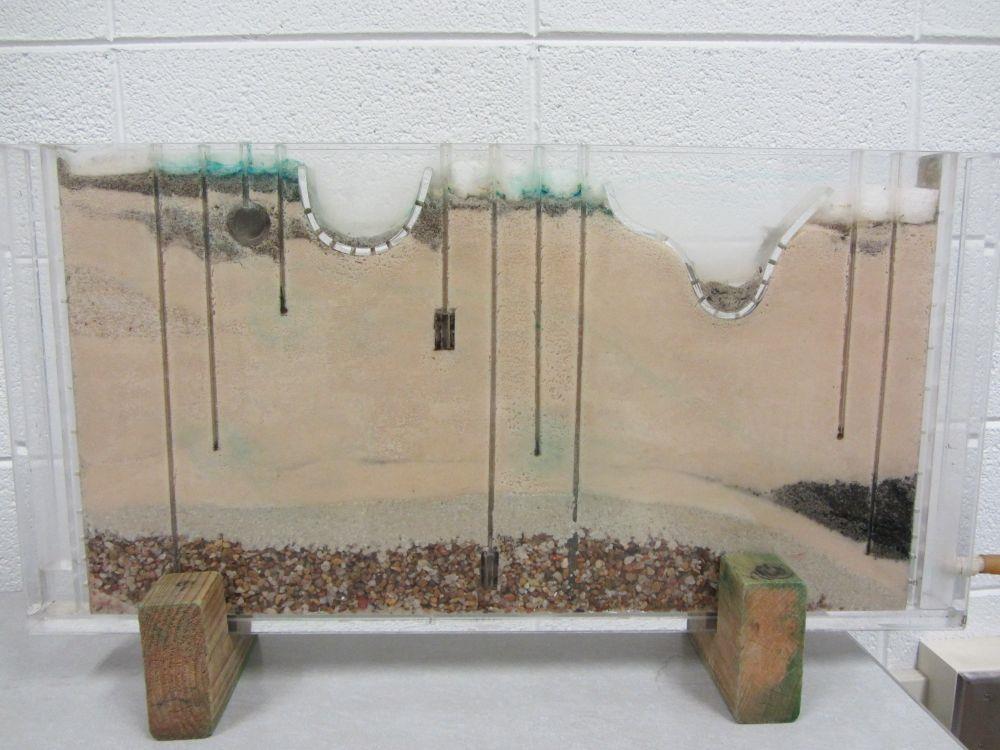
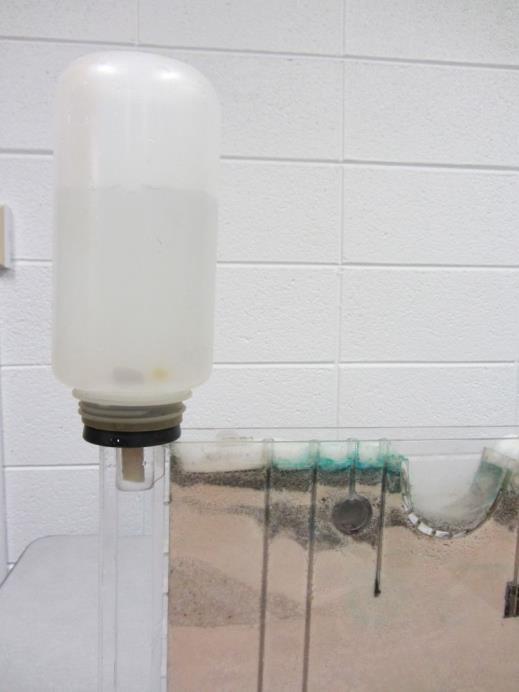
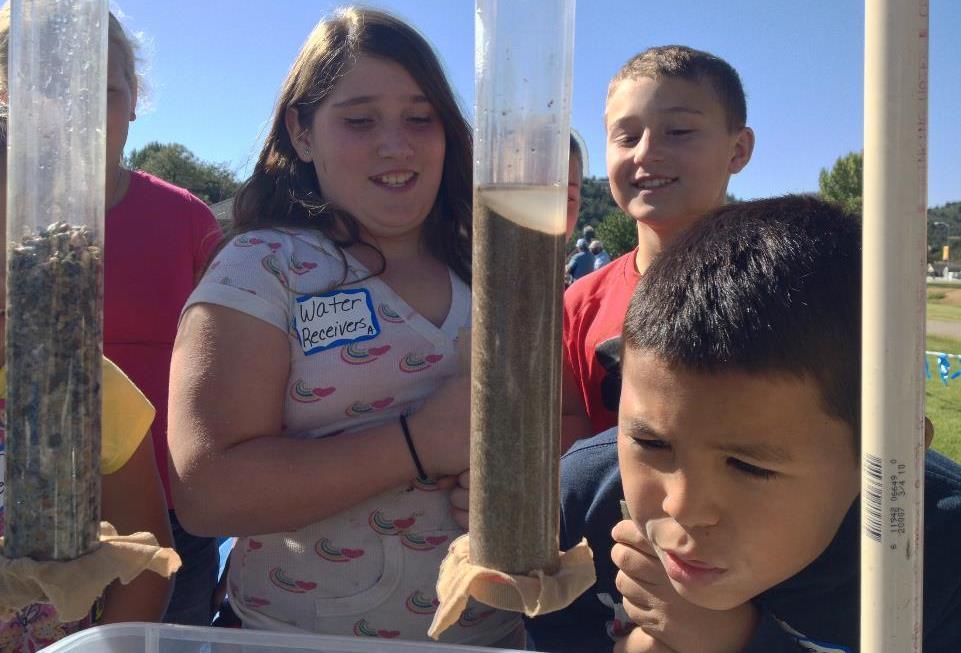
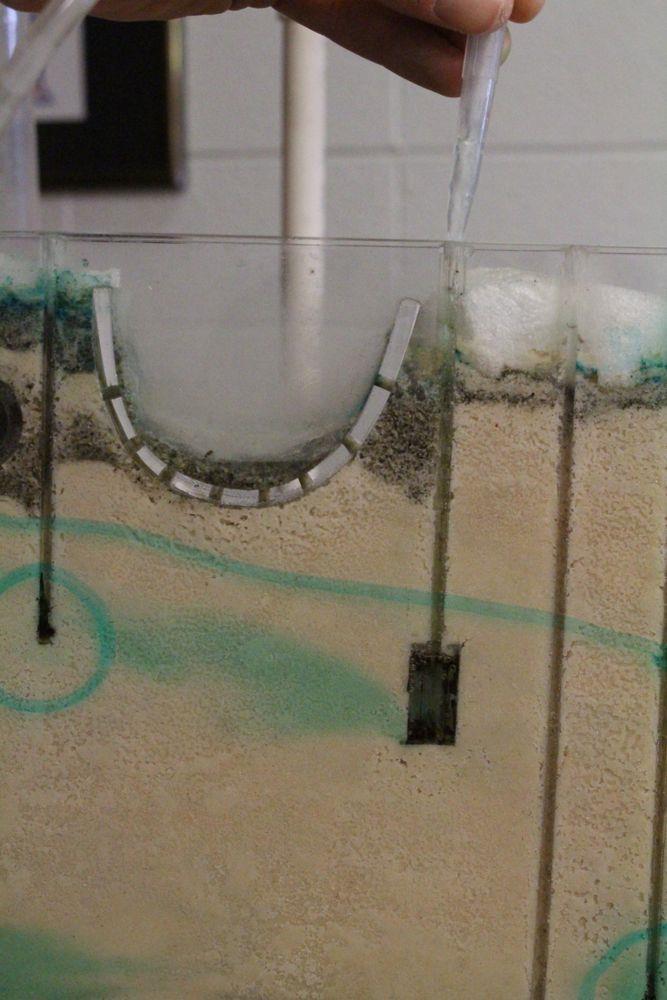
22 Get the Groundwater Picture
23
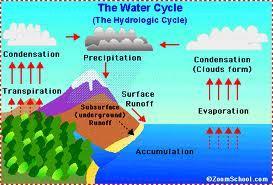
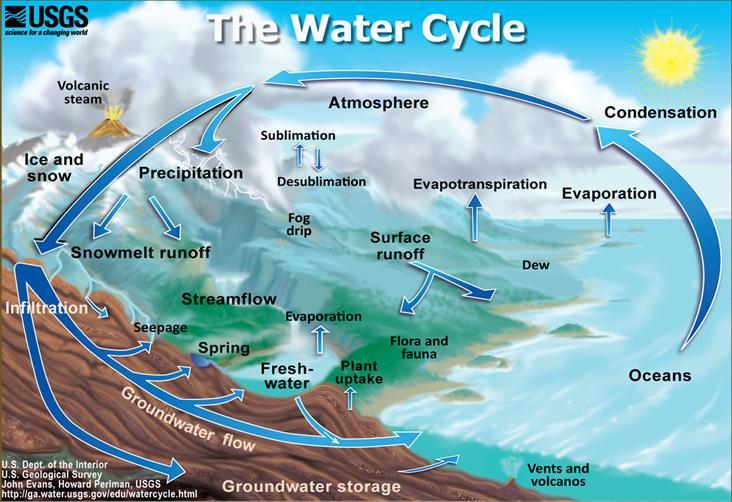
24

25 Close-up of Wells Where is the Groundwater?
26 Misconceptions Caused by Instructional Diagrams: Is Groundwater part of the Water Cycle?
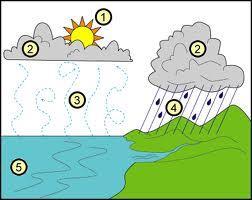
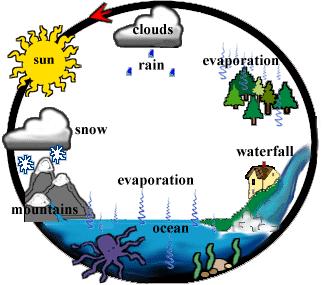
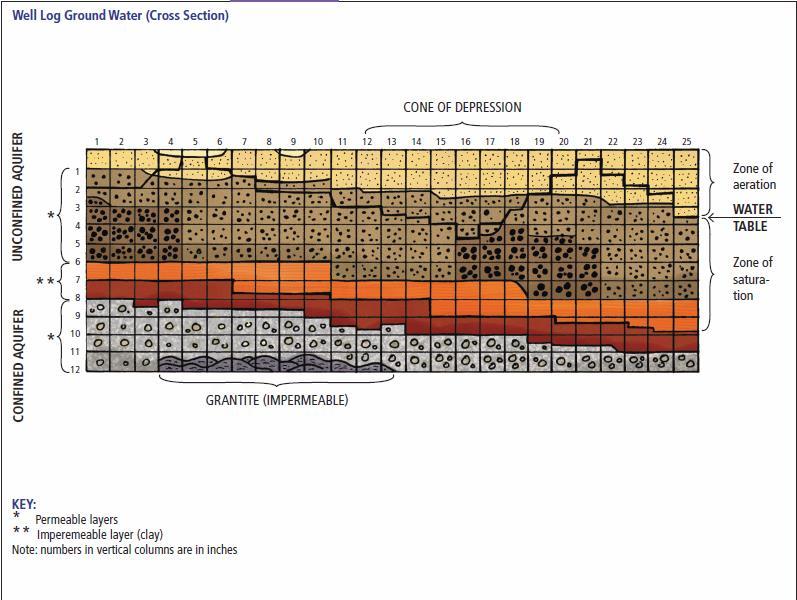
27 Traditional Water Cycle Models Don t Go Underground


28 A System Recharge Area Discharge Area

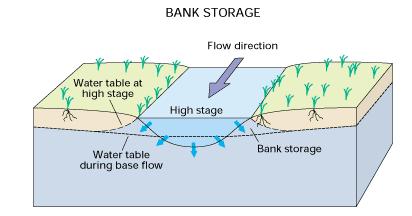
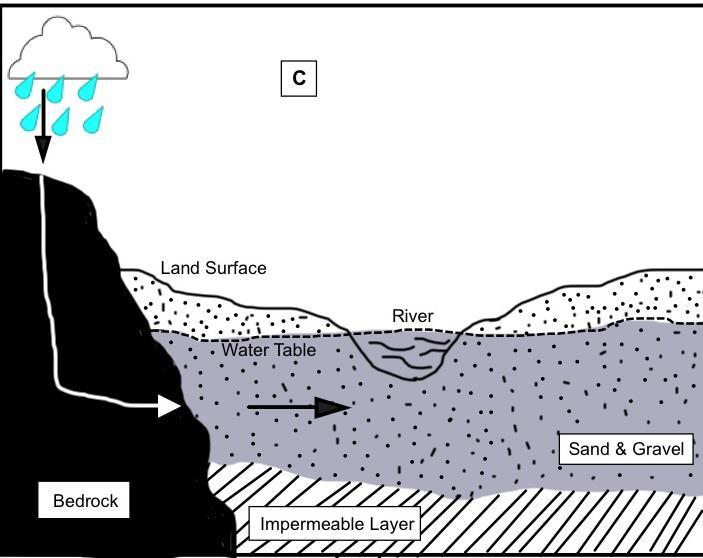
29 Recharge and Discharge Where the water table crosses the land surface, there is surface water. From: Ground Water and Surface Water A Single Resource--USGS Circular 1139
30 Where is the Water Table? Water Table
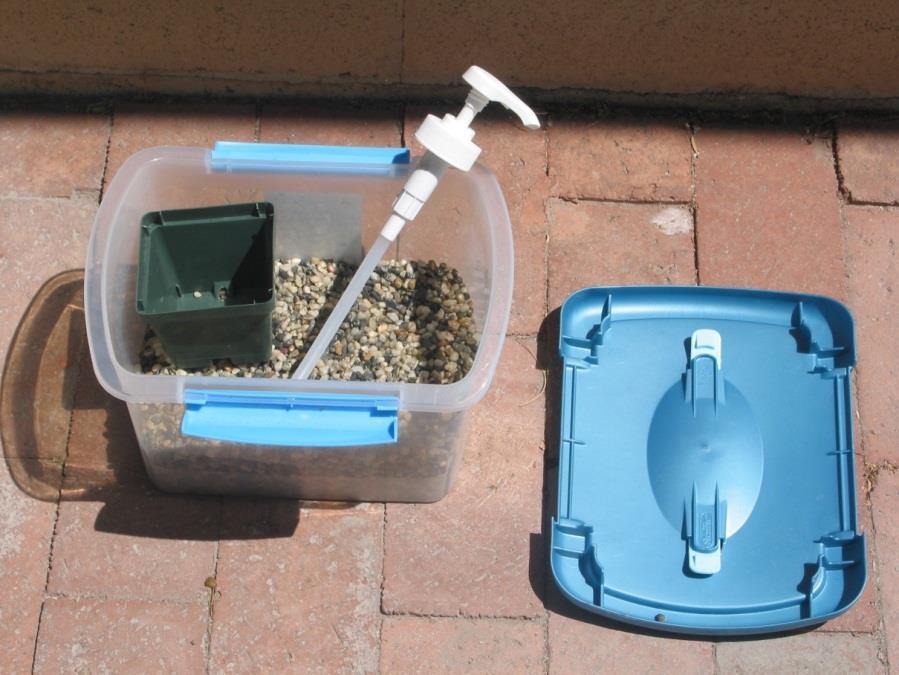
31 Smaller hands-on models for students


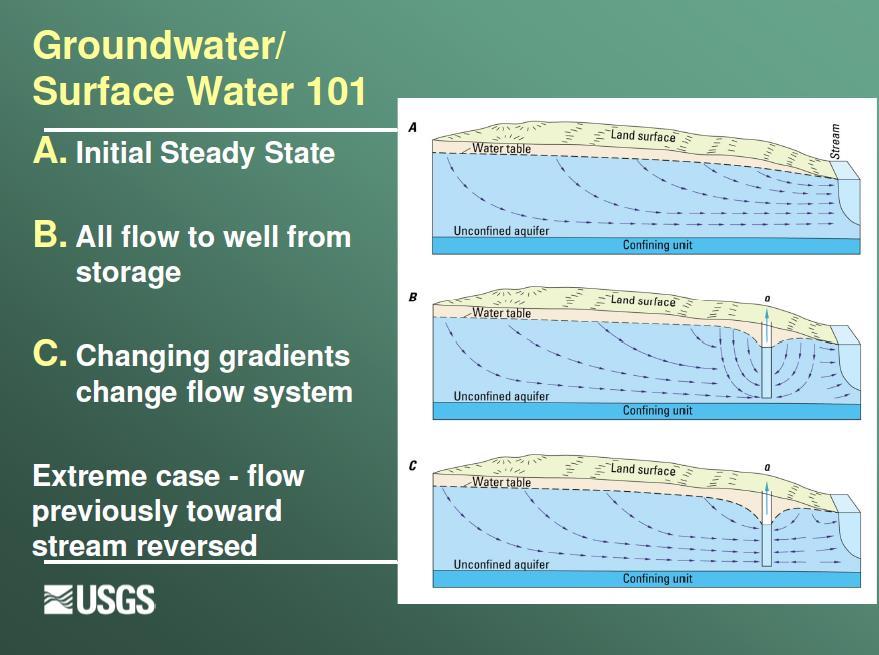
32 What happens when we pump water out of the groundwater system?
33 The Groundwater System has to be part of the Hydrologic Cycle!
34

35 The Water Cycle
36

37 Misconceptions Caused by our Analogies: Groundwater is like a big underground river.
38 Water Moves Through Earth Materials
39
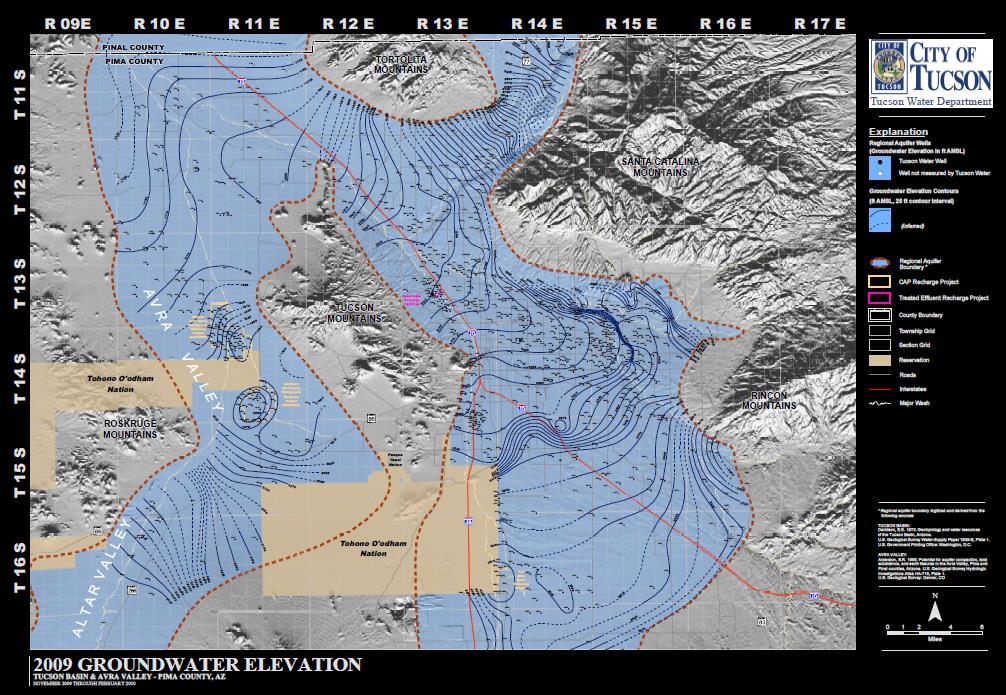
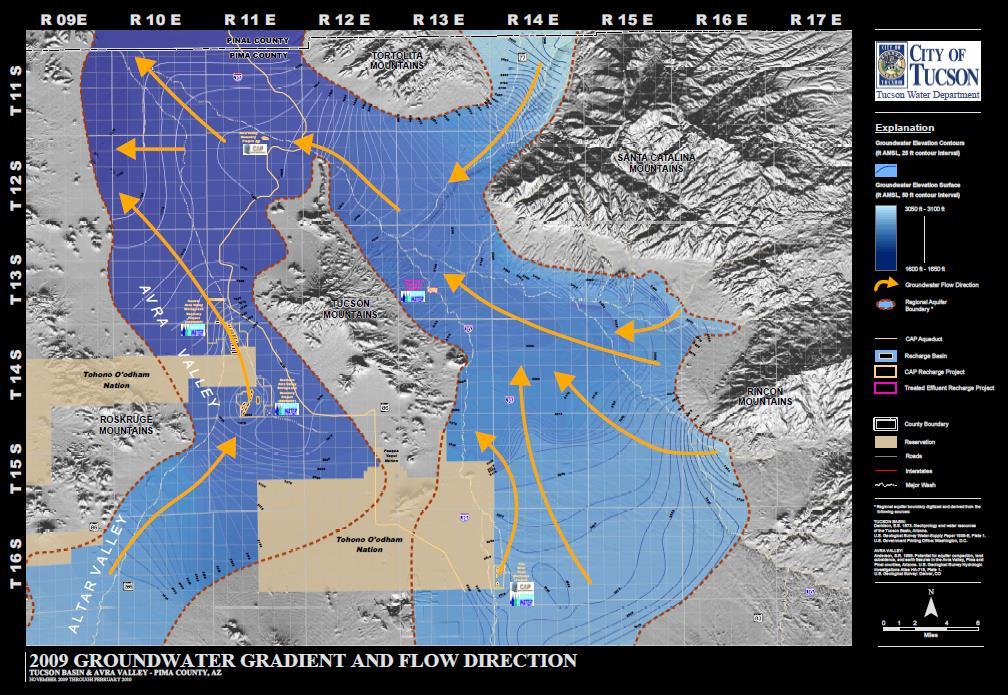
40
41
42


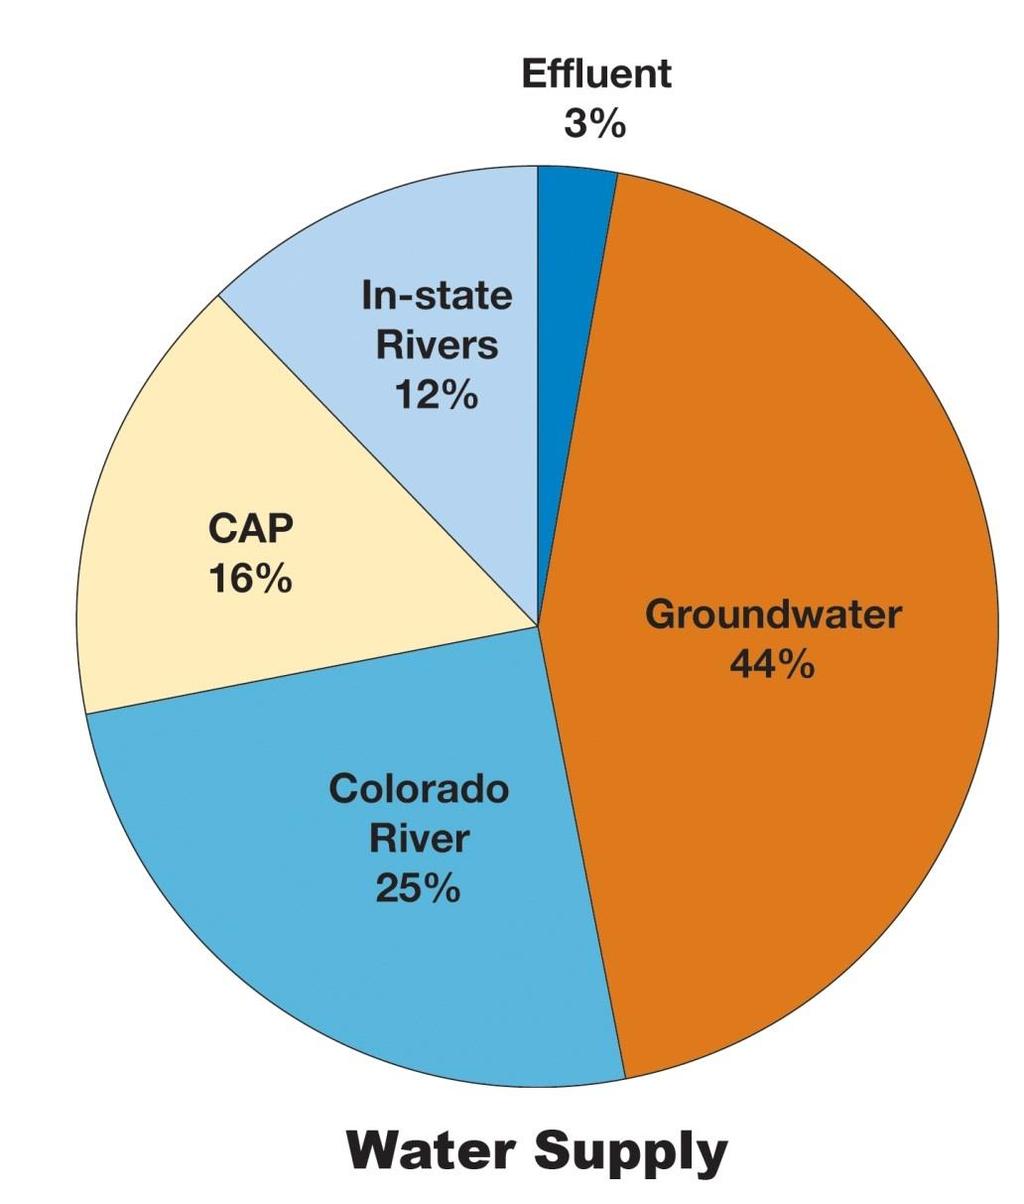
43 Groundwater is between the grains of sand and gravel not in a lake or river. Groundwater is moving because gravity works underground too. Groundwater is connected to surface water and part of the hydrologic cycle.
44 Persistency in Holding on to Beliefs
45
46 Aquifer Cross-Section Courtesy of Fernando Molina and Tucson Water Rincon Mountains Tucson Mountains Aquifer Boundary Santa Cruz River Aquifer Boundary Pantano River Well Aquifer Alluvial Aquifer Vadose zone Water table Saturated zone (aquifer) Air Water Sand, gravel & rock


47 Land subsidence in the Eloy area, central Arizona. Photograph provided by the U.S. Geological Survey. Water Availability for the Western United States Key Scientific Challenges By Mark T. Anderson and Lloyd H. Woosley, Jr., USGS Circular 1261, 2005
48 Where is the Water Table? Water Table

49 Groundwater Gradient STEM Academies teach about the water table elevation and flow direction
50
51
52 Groundwater is an important part of our water supply!
53
54
55
56

57
.")
.")
58 From: Howe, E. & Schwartz, K. (2007). Arizona Conserve Water Educators Guide (1 st ed.). Bozeman: Project WET International Foundation.
59
60 Take Action Water conservation: Acknowledge the issue There are hazardous substances in common use in households Most household water use occurs in a few areas around the home Consider how it applies to you What specific hazardous substances are in and around your home?" Where do you and your family use the most water? Modify your water use (more water saving tips) Install a water saving devices Hazardous household substances: Store them properly in a secure place Use according to the manufacturer's recommendations Dispose of them safely
61 Acknowledge the issue Wellheads should be a safe distance from potential contamination Septic system malfunctions can pollute groundwater Poorly constructed or maintained wells can facilitate contamination Improperly abandoned wells can lead to groundwater contamination Consider how it applies to you Is your wellhead a safe distance from possible contamination? Is your well/septic system due for an inspection? Are there any abandoned wells on your property? Take Action Move possible contamination sources a safe distance from the wellhead Get current on your septic system inspection and cleaning Get an annual water well system inspection Properly decommission any abandoned wells

62 The Groundwater System is part of the Hydrologic Cycle!

63 Water Moves Through Earth Materials
64 Groundwater is hidden from sight, therefore hard to visualize.
65 Groundwater and Surface Water Are Connected

66 Groundwater is an important part of our water supply!


67 From: Ground Water and Surface Water A Single Resource--USGS Circular 1139


68 Riparian Areas From: Ground Water and Surface Water A Single Resource--USGS Circular 1139
69

70 a. c. Land Surface Land Surface River River Bedrock Bedrock Sand and Gravel Clay Clay b. d. Land Surface Land Surface River River Sand and Gravel Bedrock Clay Bedrock Clay
71

72 a. c. River River Water Table Water Table b. d. River River Water Table Water Table
73


 621-9591 http://cals.")
74 Contact Information Kerry Schwartz Director, Arizona Project WET Associate Specialist, Extension The University of Arizona Water Resources Research Center 350 N. Campbell Ave. Tucson, AZ (520)
75 Arguably, there is no volume of ground-water use that can be truly free of any adverse consequence, especially when time is considered. The direct hydrologic effects will be equal to the volume of water removed, but those effects may require decades to centuries to be manifest. Because aquifer recharge and ground-water withdrawals can vary substantially over time, these changing rates can be critical information for improving management strategies. Water Availability for the Western United States Key Scientific Challenges By Mark T. Anderson and Lloyd H. Woosley, Jr., USGS Circular 1261, 2005
76 In the Headlines GW Depletion During Drought Threatens Future Water Security of the Colorado River Basin Article Claims: GW accounted for 50.1 km 3 of total 64.8 km 3 FW loss; which means that the rate of depletion of GW storage far exceeded the rate of depletion of Lakes Powell and Mead. Gravity Recovery and Climate Experiment (GRACE) Using Gravity to Measure a Change in Mass. Using Equation for Total Water Storage: Soil Moisture (from GLDAS) Snow Water Equivalent (from SNODAS) Surface Water (Powell & Mead dam releases, Precipitation from PRISM and evapotranspiration from MODIS all compared to GRACE) Solve for Groundwater Quantity