Lake Levels: Where has all the water gone February 7, 2013
|
|
|
- Ann Webster
- 5 years ago
- Views:
Transcription

1 Lake Levels: Where has all the water gone? February 7, 2013

2 Photo by Jeff J. Cashman

3 n this Nov. 16, 2012 photo, the white streaks on a steel breakwall show the normal water level n Portage Lake at Onekama, Mich., which is connected by a channel to Lake Michigan. (John lesher / Associated Press)

4
5 Great Lakes Water Levels Superior -13 inches below LTA -1 inch below a year ago - precipitation 91% Michigan-Huron -new records for months of December and January -29 inches below LTA -17 inches below last year -precipitation 87% Erie -7 inches below LTA -22 inches below last year precipitation 87% Ontario -7 inches below LTA -17 inches below last year -Precipitation 86%
 Recorded levels Lowest monthly levels (1918-2007) Range of projected levels (1 to 6")
6 Highest monthly levels ( ) Long term average levels ( ) Most likely water level forecast (1 to 6 months) Recorded levels Lowest monthly levels ( ) Range of projected levels (1 to 6 months)
7 Current Water Levels Lake Michigan - Huron Record lows for months of December and January Mean water level for December feet ( in 1964) All time record low reached in January ( in March 1964) 17 inches below its January 2012 level 29 inches below the long-term average (578.4) Forecast is to drop 1 inch next month

8
9 Projections Lake Michigan-Huron could set record lows in February and remain at or slightly above record lows March through June All the Great Lakes and Lake St. Clair are expected to remain below their long term averages for at least the next 6 months. Conditions to make gains on LTA are prolonged wet conditions during winter and spring
10 What Affects Great Lakes Water Levels? Natural Influences Hydrology/Net Basin Supply (precipitation, runoff, evaporation, inflow/outflow) Short-term weather fluctuations Long-term climate variability, climate change Glacial isostatic rebound Human Influences Dredging/deepening of navigation channels Diversions of water outside/inside basin Consumptive uses Regulation

11 Hydrologic Cycle Image: USACE

12

13 Short-term Changes

14 Seasonal Changes Image: USACE

15 Long-term Changes Period of record of Great Lakes water levels ( ) Times of above average levels, times of below average levels, times of near average levels. Still currently in the recorded range on all the Great Lakes. No clear climate change signal.

16


17 Other Low Lake Level Factors: 1. Glacial or isostatic rebound 2. Climate Change 3. Regulation 4. Diversions 5. Dredging 6. Withdrawals

18


19 Glacial Rebound

.")
20 Climate Change MODIS satellite photos showing Lake Erie ice cover on March 4, 2009 (left) and March 10, 2012 (right). Credit: GLERL
21 Impacts of Climate Change to Great Lakes Region Ice levels continue to decline Lower lake levels Air temperature increase of F by 2050 Increase in droughts, severe storms, and flooding events Coldwater fisheries will decline many species may need to migrate to adapt to rising temperatures

22


23 Regulation Moses Saunders Dam (above) Lake Superior Compensating Works, St. Mary s River (right)

24 Great Lakes Diversions
 Diversions into Basin = 5,400 cubic feet per second More water is diverted into lakes than")
25 Chicago Diversion Water diverted since 1848 New canals constructed in 1900 increased diversion 3,200 cubic feet per second per day (set by US Supreme Court) Diversions into Basin = 5,400 cubic feet per second More water is diverted into lakes than out

26 Dredging in the St. Clair Approximate total effect of drop in Lake Michigan- Huron level Compensation was authorized, but never finalized, funded or constructed Only maintenance performed since no deepening Episodic erosion occurred between 1962 and 2000 No ongoing erosion since 2000
27 Water Withdrawals Water Withdrawals in the Great Lakes Basin by category as percentage of total, Thermoelectric 72.3% Public Supply 13.7% Industrial 10.4% Domestic 1.1% Irrigation 1.1% Other 1.1% Livestock 0.3%
28 Consumptive Use Water withdrawn from the Great Lakes system and not returned 5% of all withdrawals 2.10 billion gallons per day in 2009 Amount consumed depends on use of water irrigation consumes 70% of water withdrawn whereas public supply and industrial use consume 10%
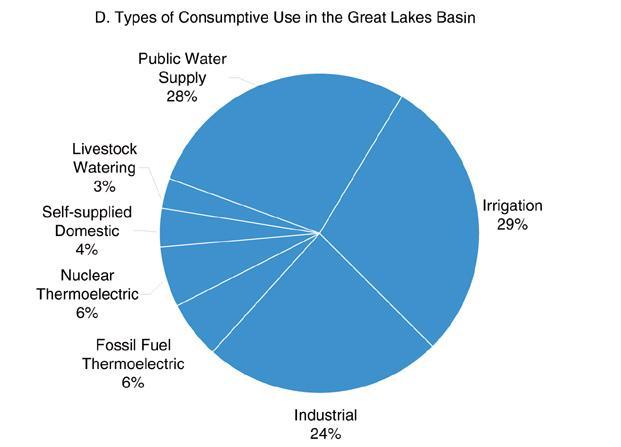
29 Consumptive Use
30 Relative Magnitude of Changes Long Lac-Ogoki Diversions (inflows) 11 cm (4.3 in) Chicago Diversion (outflow) -6 cm (-2.4 in) Welland Canal -6 cm (-2.4 in) Detroit/St. Clair channel modifications -40 cm (-15.7 in) Niagara River outlet 3 cm (1.2 in ) Existing consumptive uses (1993) -5 cm (-1.97 in) Seasonal variability ±1.3 ft (15.6 in) Climate variability (recorded) ±6 ft (72 in) Climate variability (last 2,000 years) ±7 ft (84 in)


31 Michigan Sea Grant
 Support and opposition depending on location and interest (shoreline property owner, navigation, environment")
32 St. Clair River Compensation Many types technically possible Potential adverse impacts (environmental, high water, etc.) Support and opposition depending on location and interest (shoreline property owner, navigation, environment
33 International Upper Great Lakes Study Understanding the St. Clair-Detroit River System - Investigate the factors affecting Great Lakes levels and flows, including physical changes in the St. Clair River Improving Lake Superior Outflow Regulation - Investigate whether the current Lake Superior outflow management procedures could be improved considering evolving upper Great Lakes interests and climate change. Make recommendations to the IJC on changes and actions that may be necessary.
34 IUGLS Study Recommendations The IJC should approve Lake Superior Regulation Plan 2012 as the new plan for regulating Lake Superior outflow; The IJC should seek to improve scientific understanding of hydroclimatic processes and impacts on future Great Lakes water levels Apply an adaptive management strategy to address future extreme water levels Establish a Great Lakes-St. Lawrence River Levels Advisory Board Further study of multi-lake regulation and remedial measures in St. Clair River should not be pursued at this time.


35 Next Steps Public comment period ended Sept Will carefully consider the Study Board s report and all comments before making any decisions Will decide whether or not to implement a new regulation plan Can make recommendations to governments regarding adaptive management, restoration of water levels, multi-lake regulation, etc. The IJC intends to conclude its deliberations and make recommendations in early 2013.

36 Thank You For more information: