URBAN FOREST ADAPTATION PLANNING AND PRACTICES
|
|
|
- Cecil Norman
- 5 years ago
- Views:
Transcription


1 URBAN FOREST ADAPTATION PLANNING AND PRACTICES ~ ONLINE COURSE ~ Session 2: Understanding and Evaluating Climate Change Vulnerabilities Tuesday, November 21, 2017
2 WELCOME BACK! Please turn off your computer speakers. Please turn on your webcams if you have them. Use phone for audio.
3 Where are we now? I understand the potential local impacts of climate change on the lands that I manage. I can explain how climate change may affect my ability to achieve management objectives. I can identify viable climate change adaptation strategies that can be applied to my local area. I can translate broad adaptation strategies to actionable adaptation tactics in my local area. I can identify monitoring metrics to assess the effectiveness of my management tactics.
4 Topics you are interested in: Topic When we ll cover it How climate change will impact our local vegetation.- Step 2 Adaptable trees to plant Steps 2, 4 How to set goals for climate change adaptation Step 4 Translating adaptation strategies to actionable tactics Step 4 Adaptive management strategies Steps 4, 5 Identifying monitoring metrics to assess effectiveness STEP 5 how to apply this process to many locations Aspects to include in our planning documents for others to easily understand Learning how to apply the climate change tactics, assessment tools Benefits of urban tree canopy in climate change adaptation, mitigation Sharing your story Sharing your story Throughout course Touched on, extra reading

5 Getting to know your classmates

6 Introduce your project Name Organization Project location What are your key goals and objectives?

7 Project Locations
8 Step 1 Review What questions do you have for us about step 1? What additional tools or resources would have helped you complete this step? Are there any issues you had with the online tool that we can address?
9 LECTURE IS AT 11 EASTERN/10 CENTRAL PLEASE CALL AND LOG BACK IN THEN!

10 Hello again! Today s Agenda Step 2 introduction and demonstration Overview of key resources and concepts This week s assignment!

11 Adaptation Workbook Process Resource: Climate Change Assessments
12 Step 2: ASSESS site-specific climate change impacts and vulnerabilities. Key Question: How might the area be uniquely affected by climatic change and subsequent impacts? How might regional impacts be different in the project area?
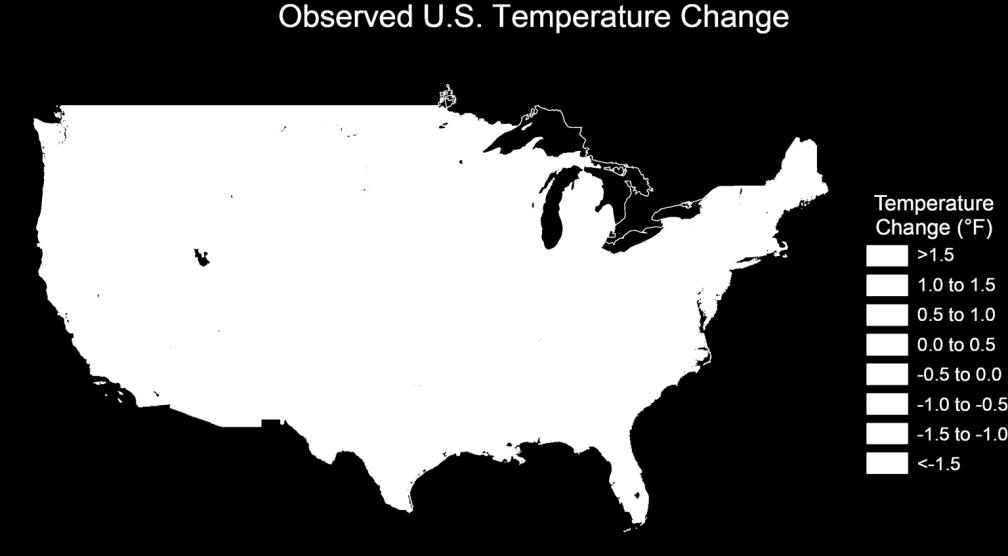
13 Step 2.1: Climate impacts Regional Impacts: Warmer temperatures Altered precipitation Longer growing seasons Rising sea levels More extreme events Altered forest habitat How will my site be uniquely affected???


14 Considering Climate Change
15 Step 2.1: ASSESS site-specific climate change impacts and vulnerabilities. Regional Climate Impacts Site-specific Impacts Based on regional info Based on your expertise

16 Before you begin this step 1. Watch the video Impacts of Climate Change on Urban Forests (about ½ hour) 2. Assemble information about your project location, such as: 1. Tree species lists/inventories. 2. Flood maps 3. Soil maps 4. Digital elevation maps. 3. Review information specific to your project area as listed in the course materials.
17 Step 2 landing page
18 Chicago Wilderness Region Vulnerability Assessment
19 Step 2 landing page

20 NOAA State Summaries

21 Step 2 landing page

22 Location-specific Vulnerability Information
23 Vulnerability=Impacts +Adaptive Capacity

24 Impacts: Native Species
25 Climate Change Atlas Projections are made based on species IMPORTANCE VALUE High importance value=very suitable habitat Low importance value=less suitable habitat Projections are for last 30 years of this century compared to Future:current ratios above 1.2= increase Future:current ratios below 0.8=decrease Negative difference=decrease Positive difference=increase
26 Models and Emissions Scenarios PCM Low emissions (B1 or RCP 4.5 ) GFDL or HAD High emissions (A1FI or RCP 8.5) Least Projected Change Most Projected Change
27 Using Tree Atlas Information Projects changes in habitat suitability, not migration Coarse spatial scale (20km grid) Good for getting a general regional picture Does not account for microclimates, lake effect, or urban heat island DOES account for soils, precipitation, topography


28 Low emissions Honeylocust Current High emissions
29 Tree Atlas Results Latin Common PcmLoDi Gcm3Avg Gcm3Avg Change name name ClimIndx ModRely ModCur HadHiDif f HiDif LoDif Class Acer negundo boxelder Increase Acer No nigrum black maple Change Acer rubrum red maple No 0.02Change Acer saccharin um silver maple Increase Acer saccharu m sugar maple Mixed 0.2results Aesculus glabra Ohio buckeye No -0.04Change Asimina Mixed triloba pawpaw Results Betula nigra river birch Increase Carya cordifor mis bitternut hickory Mixed 0.45results Carya glabra pignut hickory Increase
30 Questions?

31 Impacts: Non-natives, cultivars, rare natives Compare species heat and hardiness zone range tolerance to future, projected heat and hardiness zones.
32 Heat Zone Maps

33 Hardiness Zone Maps


34 Example: Black Hills Spruce

35 Vulnerability Components Adaptive Capacity $$

36 Vulnerability Components Adaptive Capacity
37 Adaptive Capacity Ratings Based on Matthews et al Disturbance Factors Pest, disease, fire, drought, flood, pollution, heat, herbivory, invasive species, salt resistance Biological Factors Shade tolerance, edaphic specificity, propagation, pruning needed, establishment, rooting conditions LOW Intolerant, Narrow growth requirements HIGH Tolerant, adaptable
38 Making a climate informed species list: Native species with Tree Atlas Information Species Name Model Projectionslow emissions Model Projectionshigh emissions Adaptive Capacity Red maple No change No change High Low Vulnerability Red oak No change No Change Medium Medium Sugar maple Decrease Decrease Medium Medium--high Paper birch Decrease Decrease Low High
39 Making a climate informed species list: Species with no Tree Atlas information Species Name Effect from zone shift-low emissions Effect from zone shift-low emissions Adaptive Capacity Gingko No change No change High Low Vulnerability Korean Fir No change No Change Medium Medium Norway maple Medium Decrease HIgh Medium Gray birch Decrease Decrease Low High
40 Example: Vulnerability of Trees in Chicago Region % of Trees Sampled 10% 6% 50% 16% high moderate-high moderate low-moderate low 18%
41 Chicago Wilderness Region Vulnerability Assessment
")
42 4-page summaries (some locations)
43 Questions?

44 Starting Step 2.1

45 Step 2.1

46 Step 2.1 supporting documentation

47 Step 2.1

48 Step 2.1: Add local information
49 Questions?
50 1 5 Step 2.2: DETERMINE the vulnerability level of the project area or land use

51 Step 2.2: Vulnerability Determination
52 Step 2.2: Vulnerability Determination

53 Step 2.2: Vulnerability Determination

54 Step 2 Homework!
55 To-do list: Look at climate change impacts and vulnerability resources for your state and/or area Watch the video presentation Impacts of Climate Change on Urban Forests Complete Step 2: Assessing Impacts & Vulnerability Complete the Homework section following Step 2 Come to Session 3 (Tuesday, December 5) ready to talk about your project area s top vulnerabilities
56 Recommended Reading Not required, but helpful! Chapter 2 in Forest Adaptation Resources, second edition Chapters 3 and 4 in Chicago Wilderness Region Assessment Ordóñez, C. and Duinker, P.N., Assessing the vulnerability of urban forests to climate change. Environmental Reviews, 22(3), pp

57 Questions?