LONG-TERM ACCRETION OF PHOSPHORUS IN THE EVERGLADES STORMWATER TREATMENT AREAS
|
|
|
- Christal Hancock
- 5 years ago
- Views:
Transcription
1 LONG-TERM ACCRETION OF PHOSPHORUS IN THE EVERGLADES STORMWATER TREATMENT AREAS March 15, 2013 Rupesh Bhomia Wetland Biogeochemistry Laboratory University of Florida
2 ABSTRACT
 inputs Trophic")
 constructed ~18,000 ha of Stormwater Treatment Areas (STAs)")

3 WATER QUALITY THE EVERGLADES The Everglades ecosystem Historically oligotrophic system Excess nutrient (phosphorus) inputs Trophic structure changes The South Florida Water Management District (SFWMD) constructed ~18,000 ha of Stormwater Treatment Areas (STAs) First STA came online 1994, total six STAs till date STAs removed ~ 1,500 metric tons of phosphorus Long-term sustainability of STAs is very important
 Everglades STAs Phosphorus load (g m -2 yr -1 ) Kadlec and Wallace, 2009; p.")
4 NORTH AMERICAN CONSTRUCTED WETLANDS Outflow phosphorus concentration (mg P L -1 ) Everglades STAs Phosphorus load (g m -2 yr -1 ) Kadlec and Wallace, 2009; p. 376


5 Two aspects of P removal processes in STAs Retention sedimentation, coprecipitation and biological uptake Accretion steady accumulation organic matter Recently Accreted Soil Management goals Short term Long term WETLAND PROCESSES Meet operational envelope targets
6 WETLAND PROCESSES ABOVE-GROUND BELOW-GROUND Inflow Water Soil U Live U T Live Standing Dead L Dead Litter D Outflow New Soil U = Uptake T =Transfer D = Decomposition L = Leaching A = Accretion D A A


7 EVERGLADES STORMWATER TREATMENT AREAS N Source: South Florida Water Management District

8 STAs CONFIGURATION AND TREATMENT CELLS 2700 ha 2073 ha 3334 ha 6695 ha Schematics not to scale 2466 ha 913 ha Source: South Florida Water Management District
9 STA VEGETATION
 primarily stored in soil Nutrient concentration in soils play a big role in")
10 WHY SOILS? Soils are integrators of long-term water chemistry conditions Nutrient inputs to wetlands (specifically phosphorus) primarily stored in soil Nutrient concentration in soils play a big role in outflow water quality Spatio - temporal gradients of soil nutrients are used to assess long-term nutrient impacts Soil biogeochemical properties are indicators of ecosystem conditions
11 OVERALL OBJECTIVE Understand wetland biogeochemical processes that regulate P removal efficiency and dictate long-term stabilization of removed P Hypothesis Hydraulic loading, nutrient inputs, and wetland vegetation regulate P removal efficiency and control long-term sustainability of STAs
12 BACKGROUND Available datasets on STAs (soil, water quality) were reviewed Phosphorus retained from water column (P wc ) caused enrichment of surface soil No clear relationship between P wc and P stored in floc and soil Preliminary P mass balance was developed to understand P distribution in soil profile Inverse relationship between STA age and P stored in floc and soil
13 OBJECTIVE- 1 Determine soil accretion rates in wetlands and explore influence of STA age on accretion rates Utilize stratigraphic characteristics of soil profile to identify depth of recently accreted soil (RAS) Hypothesis Accumulating matter conserves the attributes of prevailing conditions (nutrient loading and vegetation) in wetlands - As STAs age, rate of soil and P accretion slow down, resulting in higher outflow concentration

14 SAMPLING SITES N 10 years 16 years STA-1W 2700 ha STA-3/4 6 years 6695 ha STA years ha 3334 ha 6695 ha Base map source: South Florida Water Management District
15 METHODS Intact soil cores (n=128) between cm depth collected using steel tube (10.2 cm internal diameter) and sectioned at 2 cm depth intervals Samples analyzed for physico-chemical properties (bulk-density, total P, total carbon, total nitrogen and isotopic ratios of N and C) Identification of change point depth using SegReg software and soil parameters Accretion rate determined using operational age of STAs

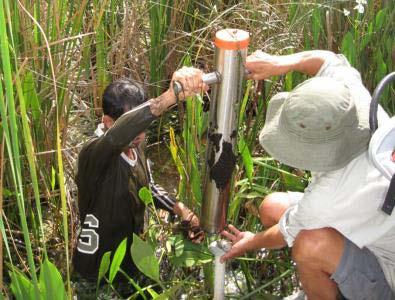
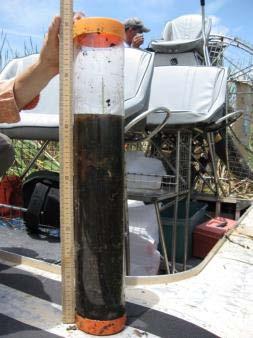

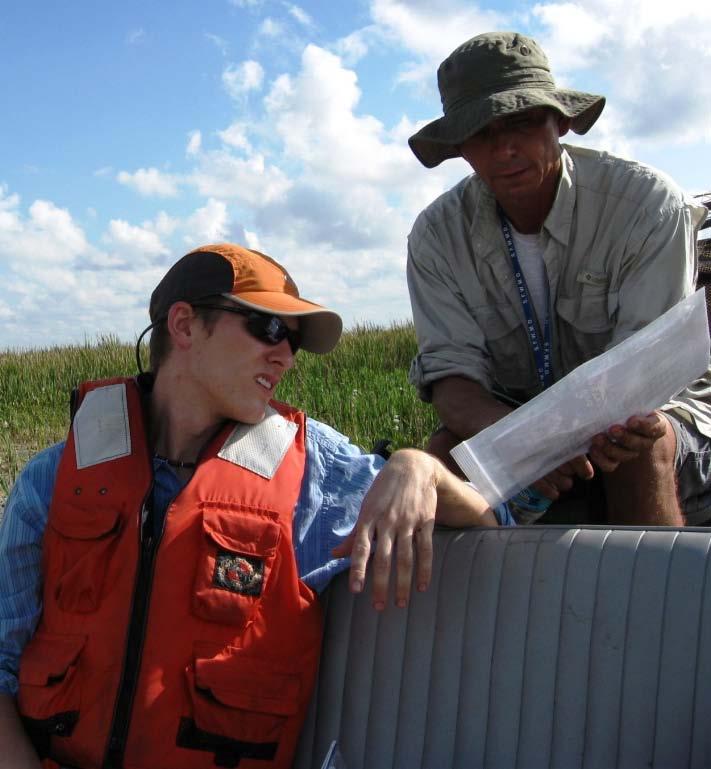
16 SAMPLING

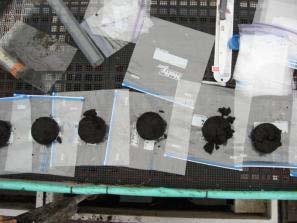

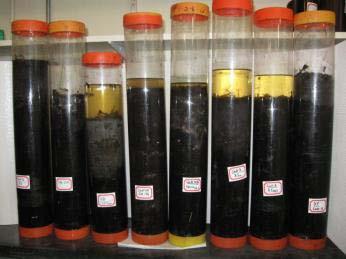

17 SAMPLE PROCESSING Total 1811 sections!


18 CHANGE POINT DETERMINATION Change point depth as boundary between recently accreted soil and pre-sta soil (native soil)

19 CHANGE POINT DETERMINATION Software program SegReg was used for identifying change points with 90% confidence interval Segmented linear regression using soil profile parameters y i = ax i + b + Є X i < Change point y j = cx j + d + Є X j > Change point


20 STA-2, EAV cell, site A-51 SegReg OUTPUT

21 RECENTLY ACCRETED SOIL DEPTH No significant difference between RAS depths in each STA when tested separately (Tukey-Kramer HSD test, p<0.05) (BD) (TP) STA-1W STA-2 STA-3/4 BD TP δ 13 C δ 15 N BD TP δ 13 C δ 15 N BD TP δ 15 N

 BD TP δ 13 C δ 15 N BD TP BD TP δ 13 C δ 15 N BD TP δ 13 C δ 15 N")
22 RECENTLY ACCRETED SOIL DEPTH No significant vegetation difference on RAS depths as determined by four key parameters in each STA (Tukey-Kramer HSD test, p<0.05) BD TP δ 13 C δ 15 N BD TP BD TP δ 13 C δ 15 N BD TP δ 13 C δ 15 N δ 13 C δ 15 N BD TP δ 13 C δ 15 N BD TP δ 13 C δ 15 N

 Avg.")

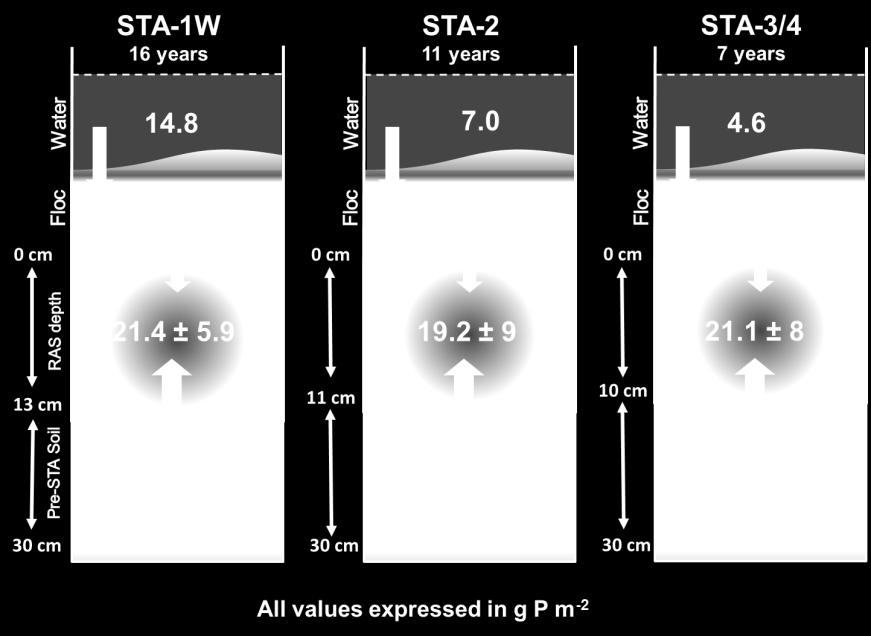
23 RECENTLY ACCRETED SOIL DEPTH Mean RAS depths in STA cells with variable vegetation (Tukey -Kramer HSD test, p<0.05) Avg. RAS depth for STA-1W, STA-2 and STA-3/4 was 15 ± 5, 11 ± 3 and 10 ± 4 cm


24 SOIL ACCRETION RATES AND STA AGE
25 PHOSPHORUS ACCRETION RATE AND STA AGE POR= Period of record FWMC= Annual flow weighted mean concentration
26 CONCLUSIONS AND IMPLICATIONS Mean RAS depth ranged cm Soil accretion rate in STAs cm yr -1 [within the range measured in other wetland system cm yr -1 ] Phosphorus accretion rate for these STAs ranged from g P m -2 yr -1 Soil and phosphorus accretion rates showed decline over time and impacted outflow water quality Hydraulic conditions of STAs play key role in continued accretion
27 OBJECTIVE- 2 Perform P mass balance in select STAs using soil P storages and water chemistry data Hypothesis Internal re-distribution of P within RAS and pre-sta soils is mediated by vegetation and potentially regulates surface water quality
28 METHODS Phosphorus storages (g P m -2 ) in floc, RAS and pre- STA soils were calculated for STAs -1W, 2 and 3/4 Mass of P for RAS and pre-sta portion was obtained for every 2 cm soil section and adding them up for whole portion Maximum soil depth considered for mass balance was 30 cm Soil sampling was conducted in WY2010, so P wc was obtained for POR
29 0 cm 30 cm STA P WC FPS P flux F RAS PS P flux PSS Pre-STA PS METHODS Phosphorus mass balance for select STAs All values expressed in g P m -2 P WC = P retained from water column [Inflow Outflow] FPS = Floc P storage [WY2010] P flux F = P flux (Floc and RAS) [P flux F = FPS Wc] RAS PS= Recently Accreted Soil P storage [WY2010] P flux PSS = P flux (RAS and Pre-STA soil) [P flux PSS = RAS PS P flux F ] Pre-STA PS = Pre-STA soil P storage
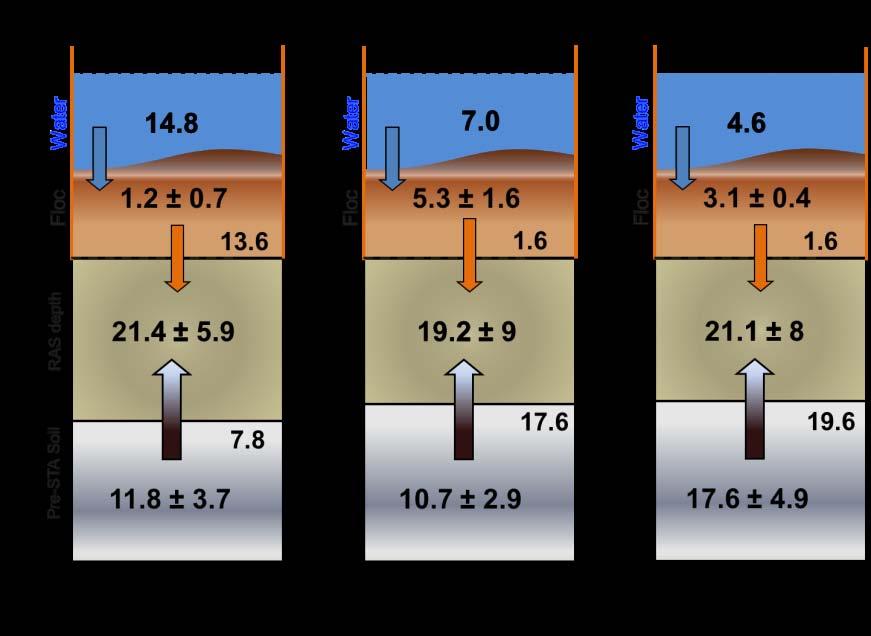
30 PHOSPHORUS MASS BALANCE
31 CONCLUSIONS AND IMPLICATIONS All three STAs showed P flux from pre-sta soils to RAS Highest P flux PSS in STA-3/4, in operation for 7 years and had low POR P WC High P flux PSS suggests role of vegetation in mining subsurface P and deposition on surface through detrital accumulation Redistribution of P within soil layers could have implications on long-term stability of P
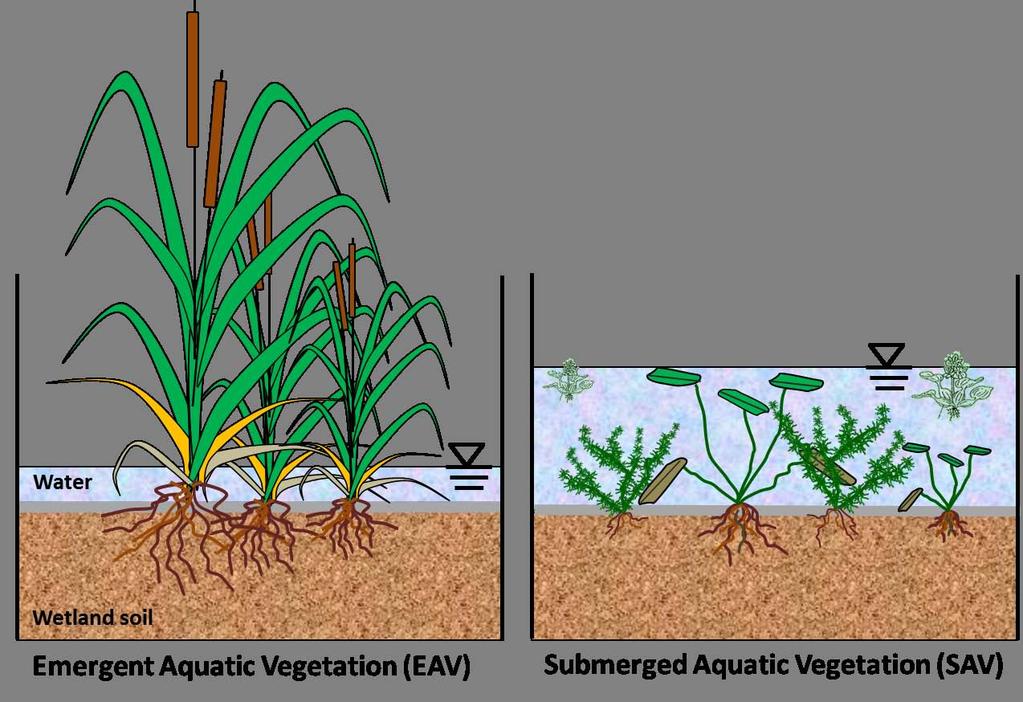
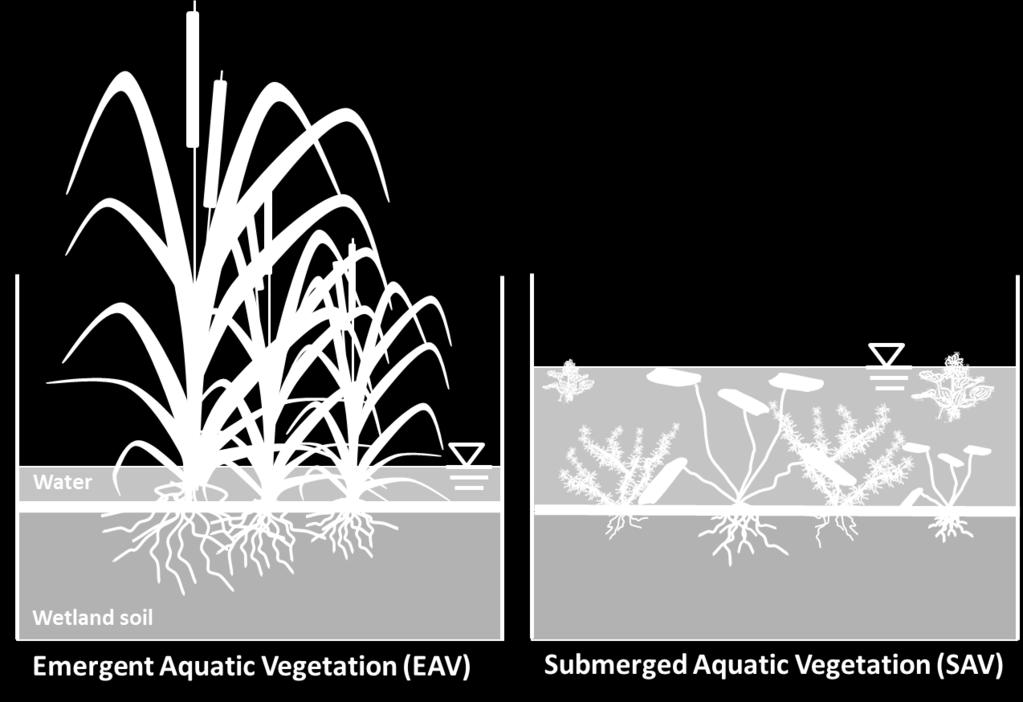
32 OBJECTIVE-3 Assess influence of wetland vegetation (EAV vs SAV) on stability of accreted P Determine proportion of reactive and stable P for two vegetation types (EAV and SAV) Examine long-term sustainability of STAs by exploring stability of accreted P in floc and RAS Hypothesis Different vegetation types influence P forms in RAS and potentially mobile forms could undermine long-term sustainability of STAs
33 WETLAND PROCESSES ABOVE-GROUND BELOW-GROUND Inflow Water Soil U Live U T Live Standing Dead L Dead Litter D U = Uptake T =Transfer L = Leaching A = Accretion D = Decomposition D A A Outflow New Soil (RAS) Phosphorus Reactive Non-Reactive Pool


34 SITE DESCRIPTION N STA-1W STA-2 27 intact cores All 4 cells 17 intact cores Cells 5A, 5B and 3 Base map source: South Florida Water Management District
35 METHODS Intact soil cores from STA-1W and STA-2 (n=44) Soil cores separated into floc, RAS and pre-sta Moisture content, bulk density, total nutrients (P, C and N) were determined Inorganic (Pi), Organic (Po), and residual P pools were measured Inorganic fraction analyzed for total metals (Ca, Mg, Fe and Al) All comparisons were carried out using student s t-test assuming equal variances (p<0.05)

36 Modified from- Ivanoff et al., 1998 FRACTIONATION SCHEME

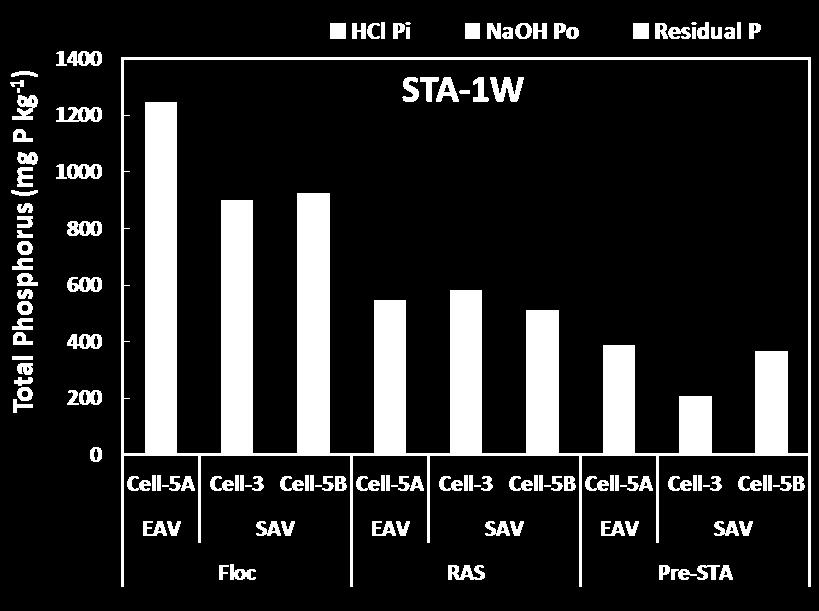
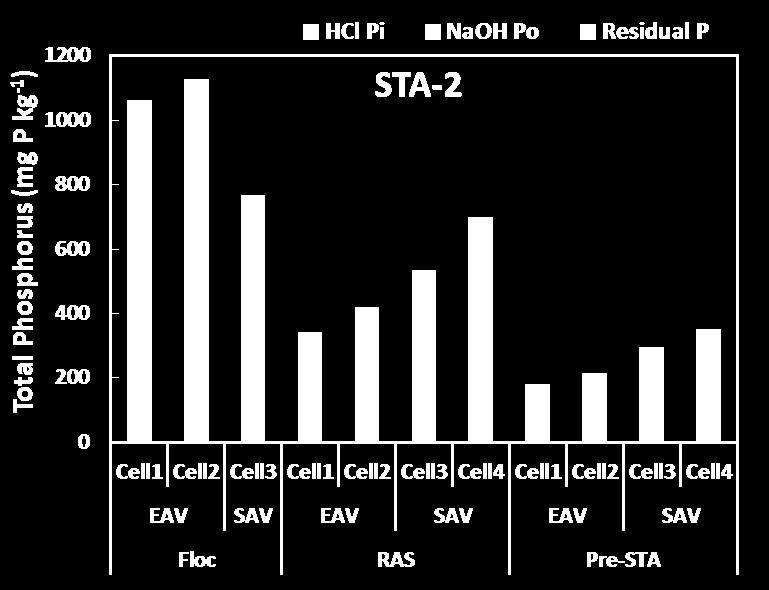
37 FRACTIONATION RESULTS Reactive Non-reactive Error bars represent standard error of the mean


38 FRACTIONATION RESULTS Inorganic P pools as a fraction of total P in EAV and SAV (Both STAs combined)


39 FRACTIONATION RESULTS Organic P pools as a fraction of total P in EAV and SAV (Both STAs combined)
40 FRACTIONATION RESULTS

41 FRACTIONATION RESULTS


42 FRACTIONATION RESULTS Fractions shown as percentage of total P Inorganic and organic phosphorus together makes reactive P pool Non-reactive Inorganic P (Pi) Reactive Organic P (Po)


")
43 TP (mg kg -1 ) FRACTIONATION RESULTS TP (mg kg -1 ) Soil Depth Non-reactive Reactive Inorganic P (Pi) Organic P (Po)


44 SOIL PHYSICO-CHEMICAL PARAMETERS


45 NON-REACTIVE PHOSPHORUS POOL Non-reactive phosphorus (mg P kg -1 ) Total phosphorus (mg P kg -1 )


46 PHOSPHORUS AND CALCIUM RELATIONSHIP Separation on the basis of Vegetation and sample type Total phosphorus (mg P kg -1 ) STA-2
47 CONCLUSIONS AND IMPLICATIONS Approximately % of TP present in non-reactive pools Reactive and non-reactive P pools did not differ significantly between SAV and EAV SAV could quickly remove P, but relative proportion of residual P is higher in EAV No difference between relative proportion of reactive and non-reactive P pools of floc, RAS, and pre-sta soil Organic P (Po) was higher in floc of EAV cells Accretion of Ca-rich layer in SAV cells suggest Ca-P coprecipitation contributing P uptake
48 STA-2 (10 years) Inflow 105 µg P L cm/d Water SYNTHESIS Emergent Aquatic Vegetation Non-reactive Reactive Outflow 21 µg P L -1 P WC = 1.4 g P m -2 yr -1 Floc RAS Pre STA Soil P accretion 1.4 g P m -2 yr -1 FPS = g P m -2 RAS PS = g P m -2 Pre-STA PS = g P m -2
49 SYNTHESIS STA-2 (10 years) Submerged Aquatic Vegetation Non-reactive Reactive Inflow 126 µg P L cm/d Water Floc Outflow 19 µg P L -1 P WC = 1.3 g P m -2 yr -1 FPS = g P m -2 RAS Pre STA Soil P accretion 2.6 g P m -2 yr -1 RAS PS = g P m -2 Pre-STA PS = g P m -2
50 SYNTHESIS Functional P retention pathways in STAs involve biotic and abiotic processes Considerable movement and redistribution of P stocks within soil profile Majority of accreted P distributed in reactive pool while wetlands continue to retain P Phosphorus treatment efficiency varies but STAs also sequester other nutrients (C and N) STAs provide an effective, biological option for P removal
51 MANAGEMENT IMPLICATIONS Some evidence suggest soil accretion rate slows down with time Scraping for rejuvenation?


52 MANAGEMENT IMPLICATIONS
53 MANAGEMENT IMPLICATIONS Some evidence suggest soil accretion rate slows down with time Scraping for rejuvenation? SAV systems accrete Ca, could this affect performance of PSTA cells downstream? The data did not suggest clear difference in the chemical stability of accreted P, however differences due to physical characteristics may be important SAV vs EAV particulate/ floc quality Assessment of STA s life span on the basis of soil accretion rates and interventions for maintaining hydraulic flow and volume
54 POTENTIAL NEXT STEPS Intensive soil analysis Spatial and temporal Quantification of soil accretion rates with respect to water quality effectiveness Stability of accreted P in other cells/stas Refined fractionation methodology and use of advance techniques (NMR, XANES) Ecosystem services valuation of STAs potential benefits other than P removal
55 ACKNOWLEDGEMENTS Financial support for this research SFWMD Everglades Foundation fellowship Society of Wetland Scientists research grant William K. Robertson scholarship UF office of research travel grant Davidson travel scholarship Florida Stormwater Association scholarship Graduate student council travel grants Soil and Water Science Department
56 ACKNOWLEDGEMENTS Advisor Dr. K. Ramesh Reddy Committee members - Dr. Mark Brenner, Dr. Patrick Inglett and Dr. Alan Wright (UF). Dr. Michael Chimney (SFWMD) Personnel from SFWMD Ms. Delia Ivanoff, Dr. Hongjun Chen, and Mr. Manuel Zamorano Wetland Biogeochemistry Lab Ms. Yu Wang, Dr. Kathy Curtis and Mr. Gavin Wilson


57 THANK YOU!