Session A1- Basinwide approaches to prioritizing stream connectivity projects
|
|
|
- Laurence Wood
- 5 years ago
- Views:
Transcription
1 University of Massachusetts - Amherst ScholarWorks@UMass Amherst International Conference on Engineering and Ecohydrology for Fish Passage International Conference on Engineering and Ecohydrology for Fish Passage 2011 Jun 27th, 10:40 AM - 11:00 AM Session A1- Basinwide approaches to prioritizing stream connectivity projects Jed Wright U.S. Fish and Wildlife Service, Gulf of Maine Coastal Program Alex Abbot U.S. Fish and Wildlife Service, Gulf of Maine Coastal Program Tarr Trinko Lake National Marine Fisheries Service Dan Kirchies National Marine and Fisheries Service Jesse O'Hanley Kent Business School, University of Kent Follow this and additional works at: Wright, Jed; Abbot, Alex; Lake, Tarr Trinko; Kirchies, Dan; and O'Hanley, Jesse, "Session A1- Basinwide approaches to prioritizing stream connectivity projects" (2011). International Conference on Engineering and Ecohydrology for Fish Passage This Event is brought to you for free and open access by the The Fish Passage Community at UMass Amherst at ScholarWorks@UMass Amherst. It has been accepted for inclusion in International Conference on Engineering and Ecohydrology for Fish Passage by an authorized administrator of ScholarWorks@UMass Amherst. For more information, please contact scholarworks@library.umass.edu.


2 Basinwide approaches to prioritizing stream connectivity projects Jed Wright & Alex Abbott - USFWS Tara Trinko Lake & Dan Kircheis NMFS Jesse O Hanley University of Kent
3 Background Barrier inventory approach Data summary Basinwide connectivity approaches Strengths and limitations Next steps


4 Background Where are they? What s their impact? How do we assess them? How do we fix them?


5 Maine Barrier Inventory Partners

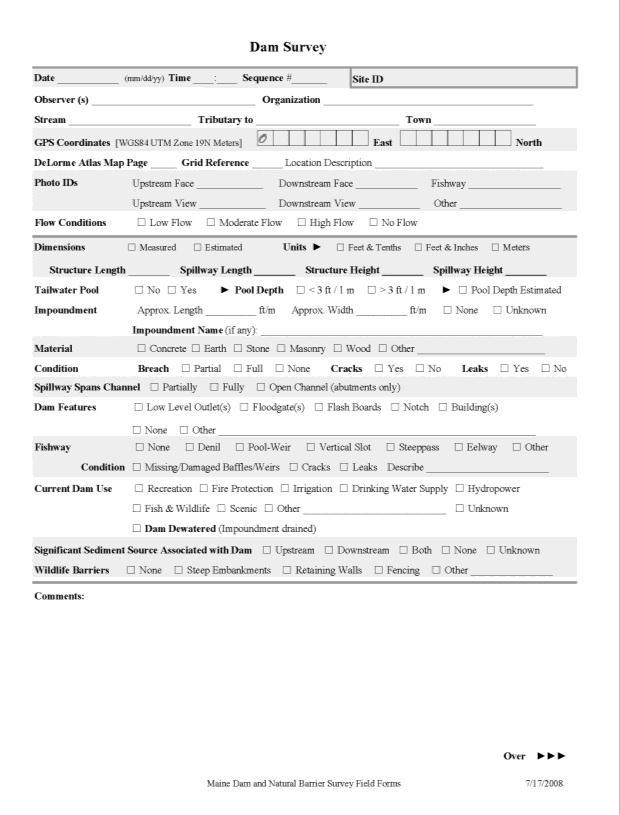
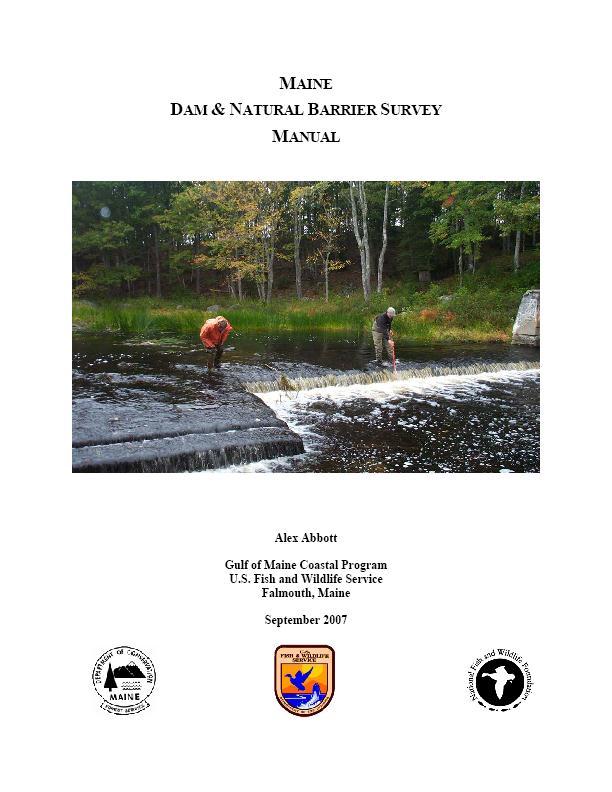
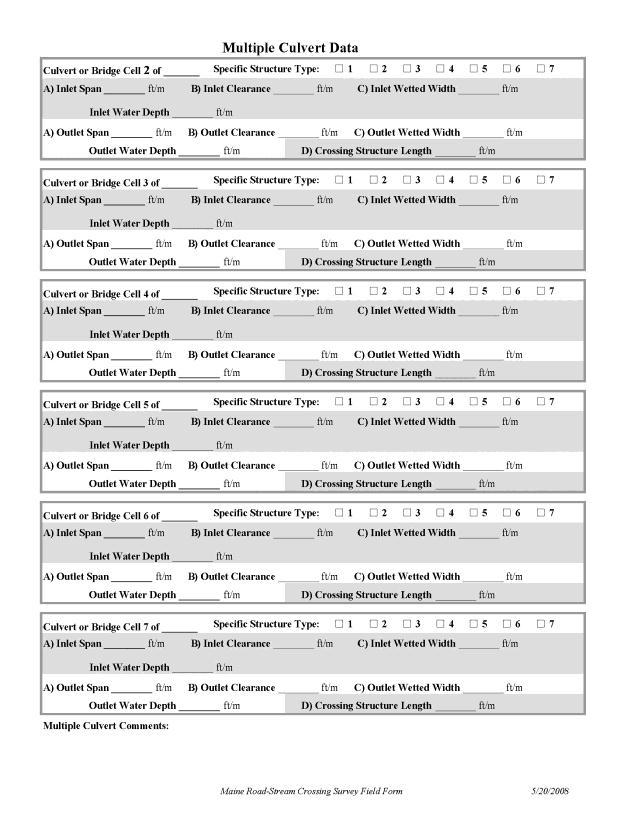
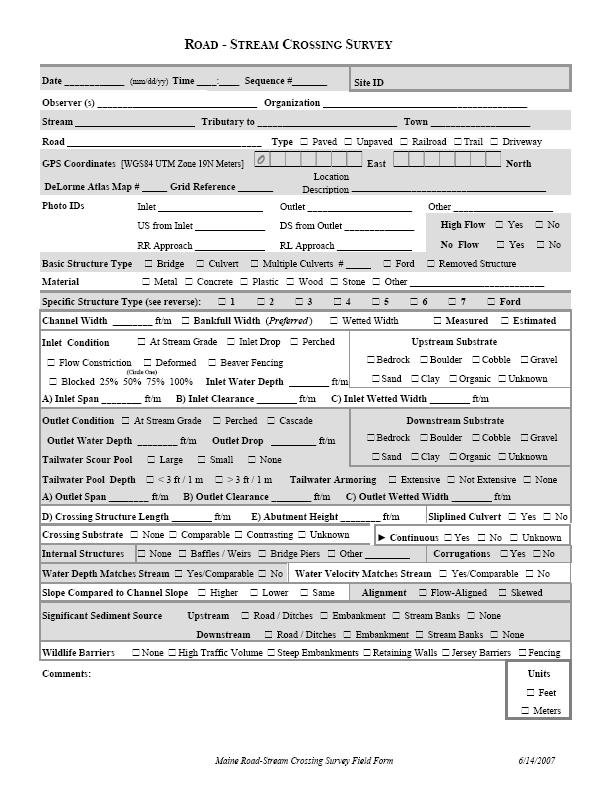
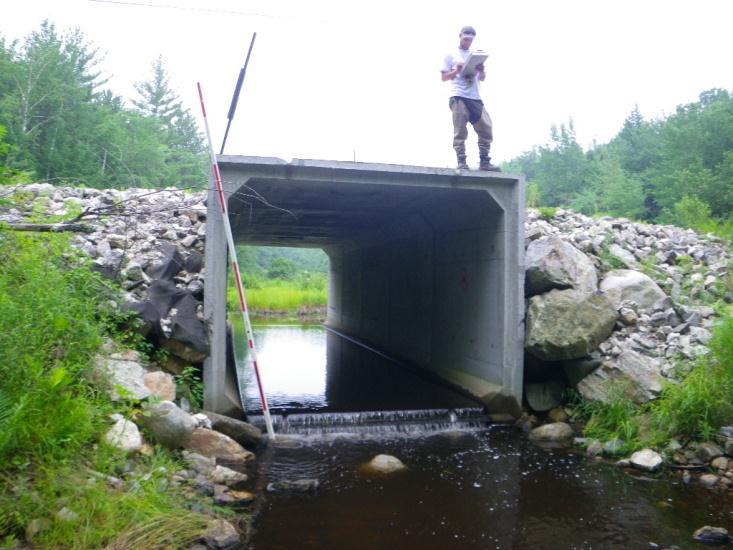
6 Barrier Inventories Maine Barrier Survey Manuals


7 Barrier Inventories Barrier Survey Atlas Equipment Kits GPS Receiver Digital Camera Measuring Tools Clipboard Forms & Manuals Essential for Navigation and Planning

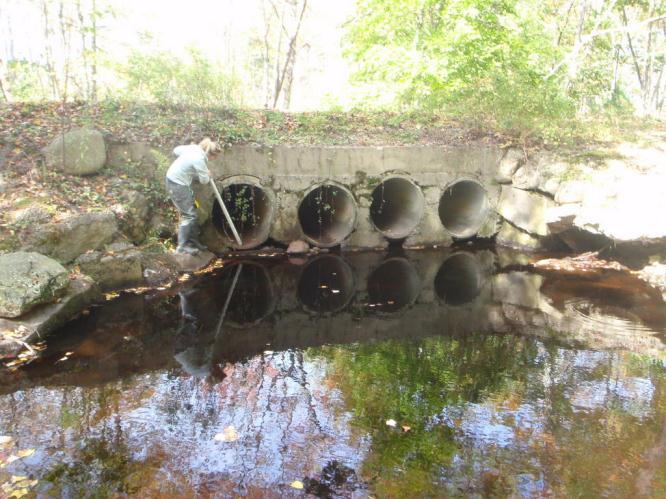
8 Barrier Inventories More than 25 % of Maine Road Crossings Surveyed


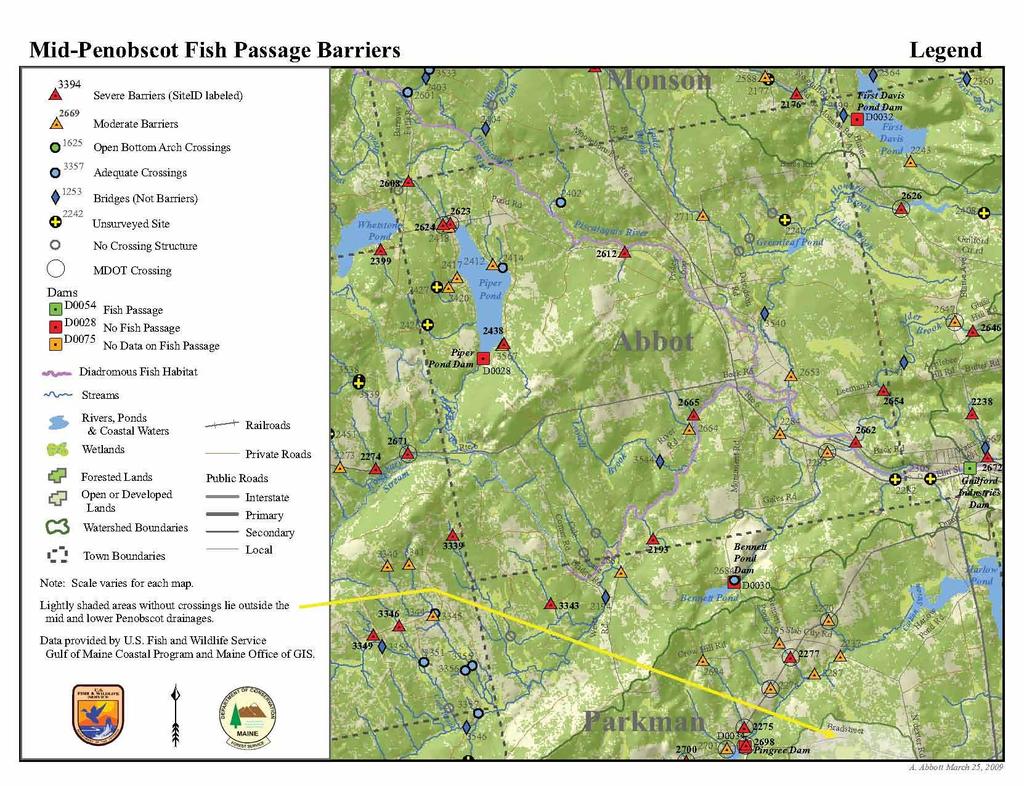
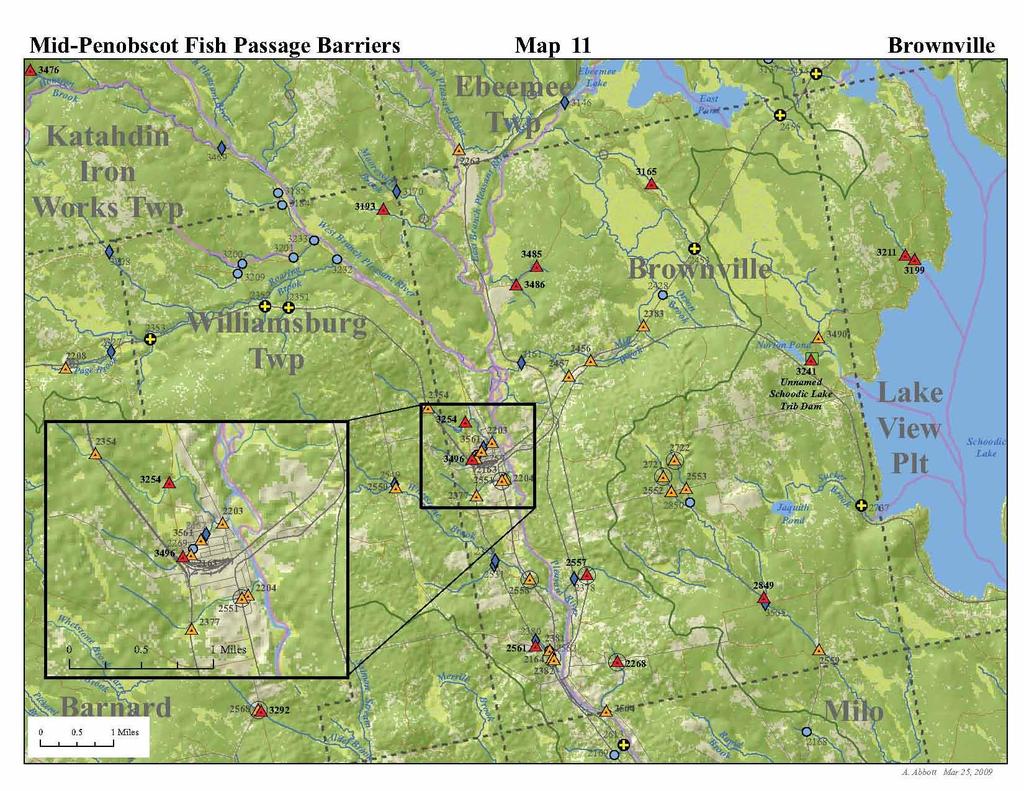
9 Lower Penobscot Barrier Surveys Severe Barriers (Blocked 50% or Perched) 268 Data Summary Data Summary
10 Penobscot Barrier Surveys Data Analysis & Priorities Functional Networks (BAT) Before Penobscot Project Network Accessible to Diadromous Fish = 374 miles Historical Network Accessible to Diadromous Fish = 5,500 miles Mean Blocked Functional Network = 4.8 miles

11
12 Basinwide multi-barrier prioritization $ $ $ $ $ $ $ $ $ $ $
13 Watershed connectivity assessment Objective: Maximize habitat connectivity (habitat units, quality, type, length) while minimizing cost Diadromous species: Upstream access Resident species: Bi-directional connectivity
14 Jesse Rush O Hanley and David Tomberlin (2005) Watershed connectivity assessment

15 Watershed connectivity assessment $150, km $26,316 / km
16 Watershed connectivity assessment Model Inputs Site ID Cost to fully repair or remove a barrier Current upstream passability of a barrier Habitat/stream length upstream Number of downstream barriers and IDs Number of upstream barriers and IDs


17 GIS Based Atlantic Salmon Habitat Model

18 Watershed connectivity assessment Population objectives Identify threats Habitat models Legault, C.M Salmon PVA: a population viability analysis model for Atlantic salmon in the Maine Distinct Population Segment. Ref. Doc Woods Hole, MA.
19 Penobscot River Watershed Current Fully Accessible and Suitable Habitat Penobscot River Watershed Based on dam and road-stream crossing inventories
20 Penobscot River Watershed Current Fully Accessible and Suitable Habitat 5,221 habitat units Based on dam and road-stream crossing inventories
21 Watershed connectivity assessment
22 Habitat Units Watershed connectivity assessment $0 $5,000,000 $10,000,000 $15,000,000 $20,000,000 $25,000,000 $30,000,000 $35,000,000
23 Watershed connectivity assessment
24 Watershed connectivity assessment
25 Acres Watershed connectivity assessment Portfolios P1 P2 P3 P4 0 $- $2,000,000 $4,000,000 $6,000,000 $8,000,000 $10,000,00 0 $12,000,00 0 $14,000,00 0 $16,000,00 0
26 Watershed connectivity assessment Portfolio 1 Budget: $2 million
27 Watershed connectivity assessment Portfolio 2 Budget: $2 million

28 Watershed connectivity assessment Portfolio 3 Budget: $2 million
29 Watershed connectivity assessment Portfolio 4 Budget: $2 million
30 Watershed connectivity assessment Bi-directional connectivity Connectivity status (Deibel et al. 2009) Measure of the access to and from the range of seasonal or developmental habitat types that a fish uses (baseline, 1 is a system with no barriers). Takes into account the quality, distance and level of connectivity to different stream habitat types. Connectivity weighted habitat status (O Hanley et al. 2010)
31 Watershed connectivity assessment Model Inputs Cost to fully repair or remove a barrier Current upstream passability of a barrier Current downstream passability of a barrier Strahler stream order Habitat quality Segment length Distance along the stream network between each beginning of a segment to the end of every other segment List of barriers that are found between the beginning of a segment to the end of every other segment Typical seasonal dispersal distance
32 Watershed connectivity assessment

33 Watershed connectivity Watershed assessment connectivity assessment C avg =.41
34 Watershed connectivity Watershed assessment connectivity assessment C avg =.58
35 Optimization vs. prioritization/ranking
36 Application
37
38
39
40
41
42 Budget - $10,000
43 Budget - $20,000

44 Budget - $30,000
45 Budget - $40,000
46 Cost data Sensitivity analysis Scenario testing Integrate optimization within GIS Data currency Institutionalize surveys and databases Prioritization within optimization
47 Watershed connectivity assessment Budget FIXIDS $200K 'S3072' 'SD0077' $400K 'S3072' 'SD0069' 'SD0085' $600K 'S3062' 'S3072' 'SD0069' 'SD0077' 'SD0085' $800K 'S1453' 'S1739' 'S1849' 'S1932' 'S2351' 'S2453' 'S2519' 'S2988' 'S3062' 'S3072' 'S3089' 'S3158' 'SD0069' 'SD0077' 'S3064' 'SD0085' 'SD0049' $1m 'S1739' 'S2351' 'S2453' 'S2988' 'S3062' 'S3072' 'S3158' 'SD0077' 'SD0080' 'S3257' 'S3299' 'S3300' Budget $200K $400K $600K $800K $1m

48 Criteria for Connectivity Spatial Decision Support Tools Dynamic Accessible/Interactive Expert input Transparent Multi-objective Scalable Common needs components exist Pool resources?

49 Thanks to the following individuals USFWS: John Sweka, Scott Craig, Charles Soucy NOAA-Fisheries: Rory Saunders Boston College: Noah Snyder Maine Department of Marine Resources: Joan Trial, Gail Whipplehauser Maine Forest Service: Keith Kanoti Project SHARE: Steve Koenig USFS: Keith Nislow, Mark Fedora, Matt Diebel Datanostics Inc.: Jim Wallace Colorado State University: John Norman GeoData Institute (UK): Duncan Hornby The Nature Conservancy: Josh Royte, Erik Martin