Cost-Benefit Analysis for Sea Level Rise Adaptation Scenarios
|
|
|
- Cassandra Garrison
- 5 years ago
- Views:
Transcription


1 ARCCA Learning Session Cost-Benefit Analysis for Sea Level Rise Adaptation Scenarios Wednesday, March 21 st 1:00 2:00 PM PST
2 Learning Session Agenda Webinar Logistics Brief overview of ARCCA Featured Presentation Participant Q&A Closing remarks


3 About ARCCA A network of leading regional collaboratives from across California that work together to advance adaptation statewide and increase local capacity to build community resilience. Peer-to-Peer Network Knowledge Exchange Emerging Collaboratives State Engagement


4 ARCCA Members Coordinator North Coast Resource Partnership State Liaison Bay Area Climate Adaptation Network Affiliates Central Coast Climate Collaborative Inland Empire Collaborative*


5 Presenters Laura Engeman Program Manager Center for Climate Change Impacts & Adaptation Scripps Institution of Oceanography Amanda Lee Principal Planner/Long Range Planning Manager Planning and Community Development City of Del Mar


6 Resilient Coastlines Project of Greater San Diego: Connecting local governments, regional science and communities Laura Engeman March 20,


7 26 Members 11 Cities 5 Regional Agencies 4 Universities 4 Non-Profits San Diego Gas & Electric The San Diego Foundation 2

8 NOAA Award $689,500 NOAA Regional Coastal Resilience Grant Program Directly support community-based coastal hazard planning 3

9 14+ Coastal Resilience Projects Across San Diego County 4

10 Regional Work Group State / Navy Engagement Local Science Regional Consistency & Coordination Regional Needs & Opportunities 5
11 6

12 The Approach: A Comparative Study 7
13 The Approach: A Comparative Study 1. Understand Your Baseline Risk 2. Assess What You Can Do Differently 3. Calculate Costs and Benefits 4. Make a Decision Task 1: Select Appropriate Local Sea Level Rise Scenarios Task 1: Select Adaptation Strategies to Form Action Scenarios Task 1: Identify Impacts Task 1: Calculate Total Benefits of Each Action Scenario Task 2: Develop High Water- Level Event Scenarios Task 2: Re- Assess Exposed Infrastructure for Each Action Scenario Task 2: Monetize Impacts Task 2: Compile Capital and Maintenance Costs Task 3: Assess Exposed Infrastructure for Your No- Action Scenario Task 3: Estimate Costs of Implementing Adaptation Strategies Task 3: Assess Each Action Scenario 8


14 Study Areas Del Mar & Carlsbad 9


15 Adaptation Strategies Beach Sand Nourishment Seawalls & Revetments Groins Elevate Structure Remove Structure Action Scenarios 10
16 Del Mar Action Scenarios 11
17 Del Mar Action Scenarios 12

18 Del Mar Action Scenarios 13
 3. Costs of adaptation strategies 4.")
19 Cost-Benefit Model 1. Monetized NO ACTION SCENARIO: baseline risk primary and secondary impacts, which represent the maximum damages prevented 2. Monetized LOSSES IN SCENARIOS: negative impacts resulting from action scenarios (i.e. property tax revenues) 3. Costs of adaptation strategies 4. Benefits of each action scenario 5. Capital and maintenance costs 14
20 The Model: Benefits Primary Impacts City property and structures City public infrastructure City transportation infrastructure Residential property (structure and tax revenue) Commercial and industrial property (structure and tax revenue) Beaches Secondary Impacts Loss of beach tourism revenue to businesses Loss of beach tourism city tax revenue due to chronic inundation City cleanup for flooding events Emergency response and/or traffic control for flooding events 15
 Benefit-to- Cost Ratio Scenario 1a $2,470.2 $335.4 $2,134.8 7.36 Scenario 1b $2,228.2 $363.2 $1,865.0 6.14 Scenario 2 $2,432.2 $567.3 $1,864.8 4.")
21 Net Benefits & Benefit-Cost Ratios Nourish, groin, elevate, remove Nourish, armor elevate, remove Nourish, remove NPV of Total Benefits ($million) NPV of Total Costs ($million) Net Benefits ($million) Benefit-to- Cost Ratio Scenario 1a $2,470.2 $335.4 $2, Scenario 1b $2,228.2 $363.2 $1, Scenario 2 $2,432.2 $567.3 $1, ** KEY MESSAGES Not just comparing Strategy A to Strategy B Ratio reflects benefits of all strategies to NO Action These are NET PRESENT VALUES 16
22 Sensitivity Analysis Varied Effectiveness Assumption North Beach Del Mar, CA Benefit-Cost Ratio % 50% 75% 100% Protection Factor (Effectiveness) Scenario 1a Scenario 1b Scenario 2 17
23 Sensitivity Analysis Varied Discount Rates North Beach Del Mar, CA Benefit-Cost Ratio % 2.0% 3.0% Discount Rate Scenario 1a Scenario 1b Scenario 2 18
24 Lessons Learned 1. The NOAA Framework: Adaptable, but assumes strategies applied in a linear fashion, not overlapping 2. Project and site-specific information is necessary to provide more detailed cost estimates. 3. Different methods for evaluating impacts: FEMA HAZUS = Broad, but high value in investing in GIS and parcel level information for more precise info 4. The value of ground-truthing and on-the-ground site inspection Don t depend on Desktop tools! 5. The value of collaboration with appropriate agencies 19
25 Or Dani Boudreau Laura Engeman
26 Amanda Lee, Principal Planner March 21, 2018


27 Del Mar, California Small beach city in San Diego County Less than 2 square miles; ~4,200 people Millions of visitors annually Walkable beach end-to-end San Dieguito Lagoon State Fairgrounds/Racetrack Beach-level neighborhood (North Beach) Development atop coastal bluffs Photos: Kenneth & Gabrielle Adelman; californiacoastline.org

28 Adaptation Planning- In Process Phased, long-term approach & strong technical basis Range of options/flexibility to address local hazards
 Del Mar is")
29 Background City awarded two State Grants 2014/2016 ($311,220) Technical reports and to amend Local Coastal Program Environmental Science Associates- technical consultant Established Technical Advisory Committee Public forum for recommendations to City Council Robust outreach- over 20 public meetings since July 2015 Prepared local Vulnerability & Risk Assessment (2016) Del Mar is vulnerable along ocean interface & Lagoon


30 What are City s Vulnerabilities? Projections through year 2100 (5.5 ft of SLR): Narrowing of beach Erosion of coastal bluffs Increased flooding frequency/damage Conversion & loss of Lagoon habitat Flooded roads, storm drains, utilities Service impacts: fire, public works, sewer, beach access


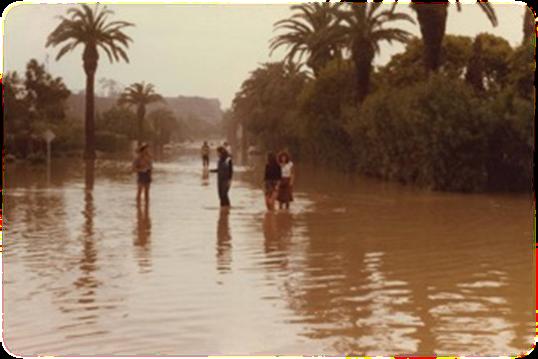
31 Extreme Floods like Del Mar-1980 Fairgrounds (1980)

32 Followed up with Adaptation Plan Resiliency planning for future of Del Mar To help property owners (public/private) prepare for projected flooding, erosion, and rising tides Align options with community goals & values Lindsey Sheehan, ESA
33 Why is Planning Needed? To help prepare and mitigate/avoid the worst effects Protect people from risk of harm Help owners plan/protect development per Coastal Act Maintain community s desired high quality of life Protect valued assets: beaches, parks, bluffs, Lagoon Ensure future of Del Mar will be viable Maintain public infrastructure and essential services

34 /1.6 ft /3.2 ft /4.9 ft /6.5 ft Worst Case Scenario (without adaptation)
35 Strong Technical/Scientific Basis Best available science- National Research Council (2012) Coastal Commission Guidance (2015) Local Vulnerability and Risk Assessment-(2016) Cost Benefit & Legal Risk Analyses (2017) Nexus Planning & Research- Cost Benefit Analysis Environmental Law Institute- Legal Risk Analysis
36 Cost to City of No Action Risk of harm to individuals (flood/erosion hazards) Risk of damage to public assets and infrastructure Risk of damage to private property/reduced tax base Risk of legal challenges over public trust lands Risk of penalties for default on commitment to grant funds Risk of reduced municipal bond rating
37 Nexus Research Study Findings Highest Cost to the City of Del Mar: No action Next Highest Cost: Planned retreat of North Beach neighborhood Highest Return on Investment: Combination of beach nourishment and sand retention


38 Artificial reefs Del Mar AP Strategies Beach nourishment Sand retention: reefs, groins, breakwater Dune restoration River channel dredging Living levees along river banks Elevate/improve sea walls per BPI Flood proof, elevate, setback structures Living levees Relocate highly vulnerable facilities & public infrastructure (essential services) Accommodate wetland habitat migration Min setbacks from erosion/flood hazards Nca2014globalchange.com


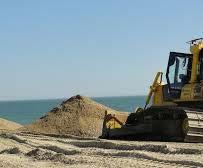
39 Sediment Management Plan Volumes of sand needed- 5 ft SLR - 900,000 cubic yards/10-11 yrs Sand nourishment cost estimate - $20-25 per cubic yard - $9 million every 10 yrs near term - $20 million/ 10 yrs long term Report also includes: - River channel dredging plan
40 Wetland Habitat Migration Plan Addresses migration/ loss of Lagoon habitat - SLAMM model: Sea level rise affecting marshes - Identifies habitat changes & conservation strategies Wetlands have carbon sequestration benefits - Atmospheric CO2 is held in biomass and soils - Degree of benefit changes when habitat type converts - Implications for City s greenhouse gas accounting
41 Challenges of Adaptation Evolving and uncertain nature of climate science Change in conditions must be monitored Beach width (sandy beach) Bluff edge (bluff edge to development) Frequency/extent of flood damage (repetitive loss) All options have extensive costs (no perfect solution) Untested area of law; limited examples Lack of long term funding source Planned retreat was the most controversial issue
42 Rationale for No Planned Retreat in Del Mar s North Beach Conflict w/ Community Plan- century old neighborhood Conflict with 1988 voter initiative and certified LCP protections for public beach and property owners No confidence retreat can achieve quality beach and access High land value makes public acquisition cost prohibitive Alternative locations not available for those displaced High threat of legal risk if retreat is planned now
43 Del Mar s Adaptation Plan Follows State guidance and Coastal Act requirements Uses best available science- strong technical basis Addresses identified local vulnerabilities and risks Process involved robust public outreach Plan includes wide range of adaptation options Explains how City approach best meets goals & priorities
44 Amanda Lee, Principal Planner March 21, 2018
45 Thank You! Resilient Coastlines Project of Greater San Diego resilientcoastlines.org Upcoming ARCCA Learning Sessions Navigating Coastal Resilience Strategy Development (3/30) Adaptation Clearinghouse Beta Testing (4/18) Learn more at arccacalifornia.org/resources/learning-sessions New ARCCA Resources 2018 Legislative Tracking: arccacalifornia.org/2018-legislative-tracking Roadmap to Transportation Resilience: arccacalifornia.org/roadmap-to-resilience