3.0 AFFECTED ENVIRONMENT, IMPACT EVALUATION, AND MITIGATION MEASURES
|
|
|
- Amos Barrett
- 5 years ago
- Views:
Transcription
1 TABLE OF CONTENTS Page 3.0 AFFECTED ENVIRONMENT, IMPACT EVALUATION, AND MITIGATION MEASURES Land Use Affected Environment Impact Evaluation Mitigation Measures Economic Considerations Affected Environment Impact Evaluation Mitigation Measures Right-of-Way and Relocations Affected Environment Impact Evaluation Mitigation Measures Social Impacts, Facilities and Environmental Justice Social Impacts and Community Facilities Environmental Justice Cultural Resources (Historic and Archaeological Resources) Affected Environment Impact Evaluation Mitigation Measures Parks, Recreational Facilities, and Open Space Affected Environment Impact Evaluation Mitigation Measures Public Safety and Security Affected Environment Impact Evaluation Mitigation Measures Visual and Aesthetic Resources Affected Environment Impact Evaluation Mitigation Measures Air Quality and Energy Air Quality Energy Noise and Vibration Noise AFFECTED ENVIRONMENT, IMPACT EVALUATION, AND MITIGATION MEASURES Page i
2 Vibration Electro-magnetic Fields/Electro-magnetic Interference Affected Environment Impact Evaluation Mitigation Measures Biological Resources Vegetation Noxious Weeds Wildlife Special Status Species Mineral Resources/Geology/Soils Affected Environment Impact Evaluation Mitigation Measures Paleontology Affected Environment Impact Evaluation Mitigation Measures Hazardous Materials Affected Environment Impact Evaluation Mitigation Measures Utilities Affected Environment Impact Evaluation Mitigation Measures Water Resources Affected Environment Impact Evaluation Mitigation Measures Floodplains Affected Environment Impact Evaluation Mitigation Measures Wetlands/Waters of the U.S Affected Environment Impact Evaluation Mitigation Measures AFFECTED ENVIRONMENT, IMPACT EVALUATION, AND MITIGATION MEASURES Page ii
3 LIST OF FIGURES Page Figure Project Study Area and Sections Figure Other Actions Figure Existing Land Use Figure Future Land Use Figure Zoning Figure Total Employment within 0.5-Mile of Proposed Stations Figure Regional Unemployment Rates Figure Displacements in Section Figure Displacements in Section Figure Regional Population Trends Figure Neighborhoods and Community Facilities in Section Figure Neighborhoods and Community Facilities in Section Figure Neighborhoods and Community Facilities in Section Figure Neighborhoods and Community Facilities in Section Figure Minority Populations within 0.5-Mile of Stations Figure Minority Populations Figure Low-Income Populations Figure Commuter Modes within 0.5-Mile of Station Figure High Line Canal Figure Parks and Recreational Resources in Section Figure Parks and Recreational Resources in Section Figure Parks and Recreational Resources in Section Figure Parks and Recreational Resources in Section Figure FTA Noise Impact Criteria for Transit Projects Figure Noise Modeled Locations, Fitzsimons Campus Figure Typical Ground-Borne Vibration Levels and Responses Figure Vibration within Anschutz/Fitzsimons Medical Campus Figure Sites of Concern within the Project Footprint Figure Drainage Basins in Project Area Figure Driscoll Model Results for Zinc Figure Driscoll Model Results for Copper Figure Year Floodplains - Sections 3 and Figure Wetland and Waters of the U.S. Impacts within Section Figure Wetland and Waters of the U.S. Impacts within Section 3 (Near High Line Canal) Figure Wetland and Waters of the U.S. Impacts within Section Figure Wetland and Waters of the U.S. Impacts within Section AFFECTED ENVIRONMENT, IMPACT EVALUATION, AND MITIGATION MEASURES Page iii
4 LIST OF TABLES Page Table Summary of Other Actions within Project Study Area Table Summary of Local and Regional Plans/Policies Table Current and Future Land Use Compatibility at Proposed Stations Table Summary of Land Use Impacts and Mitigation Measures Table Type of Employment within 0.5-Mile of Proposed Stations Table Summary of 2007 Assessed Values and Tax Revenues Table Potential Business and Employment Impacts Table Summary of Potential Tax Revenue Impacts Table Summarization of Economic Impacts and Mitigation Measures Table Summary of Right-of-Way Impacts Table Displacements in Section Table Displacements in Section Table Summarization of Right-of-Way, and Relocation Impacts and Mitigation Measures Table Population and Households within 0.5-mile of Stations Table Summarization of Social Facilities Impacts and Mitigation Measures Table Summary of Ongoing Outreach to Minority and Low-Income Communities Table Minority and Low-Income Populations Served within 0.5-Mile of Station Table Local and Regional Community Facilities serving Minority and Low- Income Residents Table Impacts Analysis Table Summarization of Environmental Justice Impacts and Mitigation Measures Table Historic Resources within the Study Area Table Archaeological Resources within the Study Area Table Summarization of Cultural Resource Impacts and Mitigation Measures Table Parks and Recreational Resources within the Study Area Table Section 1 Potential Parks and Recreational Impacts Table Section 2 - Potential Parks and Recreational Impacts Table Section 3 Potential Parks and Recreational Impacts Table Section 4 Potential Parks and Recreational Impacts Table Mitigation Feasibility Evaluation Table Crime On-Board RTD Light Rail Vehicles Table Police, Fire, and Emergency Service Locations Table Preferred Alternative Station Crime Index Table Summarization of Public Safety and Security Impacts and Mitigation Measures Table Visual Quality Summary Table Summary of Potential Tree Impacts AFFECTED ENVIRONMENT, IMPACT EVALUATION, AND MITIGATION MEASURES Page iv
5 Table Summarization of Visual and Aesthetic Impacts and Mitigation Measures Table National Ambient Air Quality Standards Table Air Pollution Levels in the Metro Region (2007) Table Maximum Carbon Monoxide Hot Spot Model Results Table Amount of Carbon Dioxide Produced Table Summarization of Air Quality Impacts and Mitigation Measures Table Energy Consumption for the No-Action and Preferred Alternatives Table Energy Consumption for the No-Action and Preferred Alternatives Table Energy Consumed during the Construction of the No-Action Alternative Table Energy Consumed during the Construction of the Preferred Alternative Table Summarization of Energy Impacts and Mitigation Measures Table Summarization of Noise Impact and Mitigation Measures Table Ground-Borne Noise and Vibration Impact Criteria by Land Use Category Table Criteria for Detailed Vibration Analysis Table Distances to Potential Vibration Impacts for Sensitive Equipment Table Summarization of Vibration Impacts and Mitigation Measures Table Electromagnetic Field (EMF) Measurements adjacent to Operating LRT Table Summarization of EMF/EMI Impacts and Mitigation Measures Table Summary of Permanent Vegetation Impacts Table Summarization of Vegetation Impacts and Mitigation Measures Table Summarization of Noxious Weed Impacts and Mitigation Measures Table Summarization of Wildlife Impacts and Mitigation Measures Table Special Status Species that may occur within Study Area Table Potential Impacts to Special Status Species Table Summarization of Special Status Species Impacts and Mitigation Measures Table Generalized Geologic and Soil Characteristics of the Project Study Area Table Summary or Potential Direct Impacts Geology and Soils Table Summarization of Geology and Soils Impacts and Mitigation Measures Table Summarization of Paleontological Impacts and Mitigation Measures Table Summary of Sites with Potential or Recognized Environmental Conditions Table Summarization of Hazardous Materials and Mitigation Measures Table Recommended Mitigation Table Summary of Potential Conflicts with Major Utilities Table Summarization of Utility Impacts and Mitigation Measures Table Stream Classifications and Impairments Table Common Impervious Surface Related Surface Water Quality Impacts Table Comparison of Impervious Areas Table Summarization of Water Resource Impacts and Mitigation Measures Table Potential Impacts on Floodplains Table Jurisdictional Requirements for Onsite Detention Facilities AFFECTED ENVIRONMENT, IMPACT EVALUATION, AND MITIGATION MEASURES Page v
6 Table Summarization of Floodplain Impacts and Mitigation Measures Table Summary of Jurisdictional Waters of the U.S. in Study Area Table Summary of Wetlands in the Study Area Table Direct Permanent Impacts to Jurisdictional Waters of the U.S Table Direct Permanent Impacts to Wetlands Table Summary of Avoidance and Minimization Measures Table Summarization of Wetland and Waters of the U.S. Impacts and Mitigation Measures AFFECTED ENVIRONMENT, IMPACT EVALUATION, AND MITIGATION MEASURES Page vi
7 3.0 AFFECTED ENVIRONMENT, IMPACT EVALUATION, AND MITIGATION MEASURES This chapter describes the affected (existing) environment within the I-225 light rail (LRT) project area, compares the environmental consequences that would result from the No-Action Alternative and Preferred Alternative, and presents measures to avoid, minimize, and/or mitigate adverse impacts of the Preferred Alternative. The RTD Board will ultimately adopt mitigation measures recommended in this Environmental Evaluation (EE). The No-Action Alternative and the Preferred Alternative are described in detail in Chapter 2. The No-Action Alternative assumes that the I-225 LRT project would not be constructed. The No-Action Alternative would not address the Purpose and Need for the project, but has been retained in this EE to provide a baseline from which to compare the effects of the project alternatives. The actions and roadway network included in the EE is listed in detail in Section FasTracks I-225 Project Sections The affected environment, impacts, and mitigation analysis for the resources in this chapter are presented in four sections (south to north). These four sections are as follows (Figure 3.0.1): Section 1 Nine Mile to Exposition includes the Iliff Station and Florida Station Section 2 City Center includes the City Center Station Section 3 Ellsworth to Fitzsimons/Montview includes the 2nd/Abilene Station, 13th Avenue Station, and Colfax Station Section 4 Fitzsimons/Montview to Peoria/Smith includes the Montview Station, and Peoria/Smith LRT Station Platform. The Peoria/Smith Station will be the connection point to the East Corridor. Only a station platform providing transfer opportunity will be provided as part of the Preferred Alternative. Parking allocated for the I-225 Corridor will be constructed with the East Corridor project. FasTracks I-225 Study Areas For this EE, a number of different study areas were needed to assess impacts (both direct and indirect) to various resources. The use of resource-specific study areas allows the assessment to be focused on the particular resource and the impacts that might be expected. Without such resource-specific study areas, the analysis for some resources would either be needlessly broad or not broad enough. The following study area terminology will apply for this EE. This terminology has been tailored to this corridor, while providing consistency with the other FasTracks corridors and in accordance with the Environmental Methodology Manual (EMM) (RTD, 2008). Project Study Area The Project Study Area encompasses that area in which major travel pattern changes could occur as a result of the implementation of the I-225 Corridor LRT project (Figure 3.0.1). The Project Study Area has been established based on the boundaries of appropriate transportation analysis zones (TAZs) from the regional model. The Project Study Area has been used to evaluate the effect of the LRT on travel patterns, and also to assess indirect effects of the LRT implementation on a number of resources. AFFECTED ENVIRONMENT, IMPACT EVALUATION, AND MITIGATION MEASURES Page 3-1


8 Figure Project Study Area and Sections Source: FasTracks I-225 Team, 2008 AFFECTED ENVIRONMENT, IMPACT EVALUATION, AND MITIGATION MEASURES Page 3-2
9 Resource-Specific Study Areas The resource-specific study areas vary by resource, and in many cases the EMM identifies different study areas for the assessment of direct and indirect impacts, respectively, for a given resource. The identification of resource specific study areas allows the analysis to be tailored such that it is appropriate for each resource of concern. Project Footprint The project footprint is the area in which physical impacts may occur during project implementation and construction. The project footprint consists of the permanent and the temporary project footprint as follows: Permanent Project Footprint includes the area that would be occupied by project facilities such as the LRT tracks, station and parking facilities and other associated facilities (such as substations, drainage facilities, etc.) that RTD would continue to maintain after construction Temporary Project Footprint - includes adjacent areas that may be disturbed during construction, such as construction access/staging areas Organization of the I-225 Light Rail Transit Environmental Evaluation Each resource section that follows in Chapter 3 is organized as follows: Affected Environment describes the existing environment of the area to be affected by the No-Action and Preferred Alternative Impact Evaluation presents potential direct, indirect, temporary construction, and cumulative impacts (Table 3.0.1) associated with the No-Action and Preferred Alternative Mitigation Measures discusses potential mitigation measures that will be implemented to avoid, minimize, or compensate for impacts identified in the impact evaluation section Appendix A provides detailed mapping of the Preferred Alternative. Appendix B provides agency coordination, including letters and minutes from key meetings in the Preferred Alternative identification process. Cumulative Impact Evaluation According to the Council on Environmental Quality regulations, a cumulative effect results from the incremental impact of an action when added to past, present, and reasonably foreseeable future actions regardless of what agency (federal or non-federal) or person undertakes such other actions. Prior to this project, the RTD prepared a Programmatic Cumulative Effects Analysis (PCEA) (RTD, 2007) that documents combined cumulative impacts of the FasTracks Program including the I-225 Corridor. This document is incorporated by reference. The PCEA focuses on regional issues, whereas the cumulative impact evaluation analysis in each resource section of this EE focuses on issues within the Project Study Area. Cumulative effects were evaluated for the No-Action and Preferred Alternatives in conjunction with other actions expected to occur within the Project Study Area (Table and Figure 3.0.2). The AFFECTED ENVIRONMENT, IMPACT EVALUATION, AND MITIGATION MEASURES Page 3-3
10 Project Study Area is used to capture these actions because it incorporates the broader area in which major travel patterns would be affected by the project. Other actions have been identified as reasonably foreseeable projects from either Denver Regional Council of Governments (DRCOG s) 2035 Metro Vision Regional Transportation Plan or from local capital investment plans. This summary is not exhaustive and does not include every current or future project within the Project Study Area. These actions are expected to occur sometime before Potential cumulative effects of the No-Action and the Preferred Alternative are described in the section for each respective resource. Table Summary of Other Actions within Project Study Area Project Name Description/Location Status Map ID Current and Future Transportation Projects within the Project Study Area I-255 widening between Parker Road and 6th Avenue In accordance with CDOT s EA/FONSI, widen I-225 between Parker Road and 6th Avenue to six Future Project lanes, while reserving space within 1 the corridor for both transit improvements and future widening to I-225/Colfax Avenue Interchange Reconstruction Martin Luther King Boulevard Extension Peoria Street Grade Separation I-70 Scheduled Improvements Montview Boulevard Reconstruction eight lanes In accordance with CDOT s EA/FONSI, reconstruct Colfax Avenue interchange at I-225 Roadway extension to Peoria Street, 4-lane median-divided arterial with turn lanes and some parking Grade separation of Peoria Street from Union Pacific rail Sections of I-70 scheduled for improvements Montview Boulevard will be reconstructed to accommodate the LRT and the development of the Fitzsimons/Anschutz Medical Campus Current Local Agency Planning Projects Aurora s Station Area Station area plans Planning Process Current and Future Development Projects within the Study Area Stapleton South Mixed Use Redevelopment of former Stapleton Development Airport site into mixed-use commercial development. Stapleton South is located at intersection of Peoria Street and planned Martin Gateway Park Mixed Use Development Luther King Jr., Boulevard Addition of more than 33,000 housing units and 38 million square feet of commercial space in northeast corner of Project Study Area Current Project Future Project Future Project Future Project Future Project Current Planning Effort On-going Project On-going Project NA 7 8 AFFECTED ENVIRONMENT, IMPACT EVALUATION, AND MITIGATION MEASURES Page 3-4


11 Project Name Description/Location Status Map ID Anschutz/Fitzsimons Medical Redevelopment of former Fitzsimons On-going Project Campus Army Medical Center into 570-acre medical and bioscience campus that will support 40,000 bioscience and health care professionals; includes the University of Colorado Denver, Children s Hospital, Veteran s Administration Hospital, and Colorado Science + Technology Park at Fitzsimons 9 Abilene Station TOD Metro Center Mixed Use Development Source: FasTracks I-225 Team, 2008 Mixed Use development including 800 multi-family units on vacant land near proposed 2nd/Abilene Station Approximately 70 acres of mixed use development on vacant land near Aurora City Center Approved General Development Plan Future Project Current and Future Development Projects AFFECTED ENVIRONMENT, IMPACT EVALUATION, AND MITIGATION MEASURES Page 3-5


12 Figure Other Actions Source: FasTracks I-225 Team, 2008 AFFECTED ENVIRONMENT, IMPACT EVALUATION, AND MITIGATION MEASURES Page 3-6
13 3.1 Land Use This section describes the impacts to local land use that would result from the No-Action Alternative and the Preferred Alternative. Land use was evaluated based on transportation analysis zones from the Denver Regional Council of Governments (DRCOG) regional model that intersect the boundaries of the Project Study Area Affected Environment Existing land uses include commercial, community, residential, and industrial. Figure illustrates existing land use while Figure illustrates future land use. Figure illustrates current zoning. Future land uses and development trends are guided by the plans and policies summarized in Table As part of the overall local land use planning process, the City of Aurora and the City and County of Denver have developed plans and policies to support transit oriented development (TOD) as part of the integration of transportation investments with land use goals. This integration is being addressed specifically through Aurora s station area planning process and zoning for TOD districts. It is anticipated that these plans will be adopted by ordinance to guide development and redevelopment at the proposed station areas. While the exact timing of these developments is unknown, some of the planning process has begun at certain locations. Farmlands There are no agricultural land uses along the corridor. The Project Study Area is urbanized and is located entirely within the City of Aurora, with the exceptions of the planned Stapleton South development and industrial uses north of Smith Road both in the City and County of Denver. Land Use Page 3-7
14 Figure Existing Land Use Source: City of Aurora, 2006; City and County of Denver, 2002; and FasTracks I-225 Team, 2008 Land Use Page 3-8

15 Figure Future Land Use Source: City of Aurora, 2006; City and County of Denver, 2002; and FasTracks I-225 Team, 2008 Land Use Page 3-9

16 Figure Zoning Source: City of Aurora, 2006; City and County of Denver, 2009; and FasTracks I-225 Team, 2008 Land Use Page 3-10
17 Table Summary of Local and Regional Plans/Policies Plan Name 2035 Metro Vision Regional Transportation Plan (2007) Adams County Transportation Plan (1996) Arapahoe County Transportation Plan (2002) Aurora Strategic Parking Plan and Program Study (2009a) Aurora Parks and Open Space Framework Master Plan (2007a) Aurora Transit Oriented Development District (2009b) Aurora Urban Street Standards (2007b) Aurora Zoning Map and Building and Zoning Code (2006) City of Aurora Comprehensive Plan (2003) City of Aurora station area planning process Policies Related to the FasTracks I-225 Corridor This plan is the foundation for long-range planning activities and establishes the need and demand for regional facilities and services Developed in cooperation with RTD and CDOT, the plan outlines needed transportation system improvements and identifies those improvements that can be reasonably expected in the region over the next 25 years, given current funding levels The I-225 LRT is identified in this plan to provide increased transit service and encourage travel by means other than the single-occupant motor vehicle Coordinate capital improvement programs (CIP) with cities (including City of Aurora) Develop a comprehensive bicycle and pedestrian trail plan Corridor preservation for high-occupancy vehicle (HOV) or LRT including I- 225 corridor Promote a multi-modal transportation system Support public transit including I-225 LRT corridor Consider pedestrian needs and establish a bicycling network Addresses city-wide parking strategies Guides vision for parks and recreational resources in the City of Aurora through the year 2030 and acts as the blueprint for decision-making. This zoning district emphasizes urban form over land uses and provides a flexible approach to encourage compact developments around transit stations Continues the modifications to City of Aurora standards initiated through the Urban Street Standards and the Small Urban Parks standards Standards to create a safe, comfortable, pleasant and pedestrian-friendly multi-modal travel environment Designates permitted uses of land based on mapped zones (Aurora zoning is depicted on Figure 3.1.2) Develop specific land use and zoning regulations and design standards to support the creation of TOD Develop a systematic planning approach to identify, design and develop LRT stations and major bus transfer centers Encourage more attractive, safer, comfortable and user friendly transit facilities Provide more effective and convenient travel choices and connections including public transit, bicycle and walking routes Station area planning processes for the Nine Mile, Iliff, Abilene, Fitzsimons- Colfax and 13th Avenue, and Smith-Peoria Stations (2009c, 2009d, 2009e, 2009f, 2009g) Station planning process is anticipated for the Florida Station in 2009 Land Use Page 3-11
18 Plan Name Policies Related to the FasTracks I-225 Corridor Ensures that Denver s Citywide Land Use and Transportation Plan and regulatory system support the development of a clean, efficient and 2000 Denver innovative transportation system that meets Denver s future economic and Comprehensive Plan mobility needs (1998) Supports regional transit systems that provide access between downtown and neighboring communities, including Aurora Directs growth to Areas of Change (which includes locations around transit stations) while preserving the character of Areas of Stability (such as stable residential neighborhoods). Blueprint Denver Encourages implementation of multi-modal streets that accommodate (2009) public transportation, pedestrians, bicycles, and private vehicles. Encourages mixed-use development in areas such as downtown and around rapid transit stations (e.g., TOD). Sets priorities for where city resources should be directed in the short-, mid-, and long-terms. Denver TOD Strategic Plan (2006) Identifies effective implementation tools, policies, and strategies to facilitate TOD where appropriate. Ensures close coordination among City departments, staff, and others in the planning and implementation of TOD. Analyzes how traffic and construction will change with development of the Fitzsimons Multimodal Transportation Anschutz/Fitzsimons Medical Campus Provides strategies and measures to improve travel to and from area Plan (2009h) Identifies I-225 LRT as one part of the multi-modal solutions I-225 Colfax Avenue Interchange EA Expands the existing I-225/Colfax Avenue interchange to add an I-225 connection to the north at 17th Street via collector distributor roads. (2005)/FONSI (2007) Project intent was to relieve congestion at the interchange I-225 Major Investment Study (MIS) (2001) RTD initiated this study to incorporate rail transit connecting the Southeast and East Corridor in the area between Parker Road and Interstate 70 along the I-225 corridor. I-225 Widening from North of Parker Road Recommended the widening of I-225 from four lanes to six through-lanes, with auxiliary lanes between interchanges to North of 6th Avenue (2000; 2001) Space for future widening to eight lanes and a future transit (LRT) envelope was preserved in the median as part of this study Source: FasTracks I-225 Team, 2009 The following four sections discuss the predominant existing land use and major planned developments. Section 1 Nine Mile to Exposition Between South Parker Road and Exposition Avenue along the I-225 corridor, current land uses include a mix of commercial, community, and residential uses. Land use immediately east of I-225 between Yale Avenue and Exposition Avenue is a mixture of hotel, office, restaurant and other business uses. Land use west of I-225 is primarily residential with medical-related community uses. There are currently no major approved development plans within Section 1. Land Use Page 3-12
19 Section 2 City Center Current land uses between Exposition Avenue and Ellsworth Avenue in the City Center Section include commercial, mixed use, and residential. The commercial development is dominated by big box retail including the Town Center at Aurora (regional mall) and Aurora City Place (600,000 square foot village street retail). East of Sable Boulevard, public facilities predominate including the Aurora Municipal Center, Justice Center, Arapahoe County offices, Aurora Public Library, and Aurora History Museum. Major plans and approved developments within this section include the Metro Center commercial development project (formerly known as Centrepointe property), situated adjacent to the east of the proposed City Center Station. This development would consist of approximately 70 acres planned for mixed-use development in Aurora s City Center. Section 3 Ellsworth to Fitzsimons/Montview Between Ellsworth Avenue and Fitzsimons Parkway at East 17th Avenue, the current land use includes a mix of commercial and residential uses. A combination of office, hotel, retail, and community uses are clustered at the I-225 interchanges at 6th and Colfax Avenues. The south side of Colfax Avenue is currently redeveloping with mixed commercial uses to support the Anschutz/Fitzsimons Medical Campus. Major plans and approved developments within this section include the future Abilene Station development near the Abilene Station. This development is proposed to include mixed-use consisting of four-story lofts for rent and/or sale with structured parking. The potential also exists for office building and hotel sites. Convenience retail may be adjacent to the LRT station. In addition, the development includes a proposed pedestrian bridge over High Line Canal. A Veterans Affairs hospital is proposed for approximately 20-acres of the southeast corner of the Anschutz/Fitzsimons Medical Campus. Section 4 Fitzsimons/Montview to Peoria/Smith From Fitzsimons Parkway at East 17th Avenue to Peoria Street at Smith Road, the current land use includes a mix of commercial, community, mixed use, recreational, residential, and industrial uses. Land uses south of Montview Boulevard are primarily medical related community uses while land uses to the north are recreational (Fitzsimons Golf Course) and currently being redeveloped. Peoria Street includes several undeveloped parcels and a mixture of recreational, industrial, residential and commercial business uses. Major plans and approved developments within this section include the Colorado Science + Technology Park at Fitzsimons that plans to redevelop the area north of Montview Boulevard on the Anschutz/Fitzsimons Medical Campus for commercial bioscience and mixed use (Fitzsimons Redevelopment Authority, 2007). In addition, Stapleton South is a mixed use development proposed at the intersection of Peoria Street and the planned extension of Martin Luther King Boulevard in Denver. Land Use Page 3-13
20 3.1.2 Impact Evaluation The impact analysis process included a review of the documents listed in Table 3.1.1, proposed major development projects, aerial photos, meetings with local governments, and site visits. The criteria used to identify direct impacts include: Land use conversion (type of land required) Compatibility with existing land uses Compatibility with future land use including adopted land use and transportation plans The criteria used to identify indirect impacts included: Potential indirect land use changes Compatibility with adopted land use and transportation plans No-Action Alternative The No-Action Alternative is described in detail in Chapter 2. The No-Action Alternative would not result in direct impacts to land use because no I-225 corridor LRT facilities would be constructed. The No-Action Alternative is not consistent with future land use and transportation plans that anticipate the development of LRT service. Under the No-Action Alternative, the effectiveness of the plans listed in Table would decrease, and the No-Action Alternative would not fully support key elements of several local plans. Other transportation projects included in the No-Action transportation network may have impacts to land use. The impacts of these other projects have been or will be considered in the NEPA process for each of these projects, and avoidance, minimization, and/or mitigation specified, as appropriate, in the specific NEPA decision documents for each project. Indirect Impacts Implementing the No-Action Alternative would result in minimal TOD in Aurora. TOD opportunities would be limited to the Peoria/Smith and Nine Mile Station areas. Cumulative Impacts The No-Action Alternative and other local actions are expected to provide less opportunity to link public transportation with new development. These actions also would promote lessfocused and concentrated development patterns both in the Project Study Area and throughout the region as a whole Preferred Alternative The Preferred Alternative is discussed in Detail in Chapter 2. The implementation of the Preferred Alternative would primarily result in use of portions of CDOT and City of Aurora transportation right-of-way. All four sections would also include the conversion of some commercial and vacant land uses to transportation uses. Potential real property acquisitions are summarized in Section 3.3. Land Use Page 3-14
21 The proposed station locations are compatible with zoning and current and future land uses, as shown in Table 3.1.2, therefore, there are no impacts expected to land use from the Preferred Alternative. Table Current and Future Land Use Compatibility at Proposed Stations Station Current Adjacent Land Use Future Land Use Compatible Iliff Station Florida Station Aurora City Center Station 2nd/ Abilene Station 13th Avenue Station Colfax Station Montview Station Peoria /Smith Station I-225 right-of-way to the west; commercial uses including hotels north, south and east; and vacant and residential to the east Big box commercial and residential to the east; I-225 rightof-way and community (medical) to the west Vacant to the north and east. Transportation uses west and south (Sable Blvd. and RTD bus transfer facility). Commercial and community uses for remainder of area. Vacant immediately east. I-225 and residential to the west; retail and multi-family to the south. Vacant parcels north and south of Toll Gate Creek, bounded by I- 225 and multi-family to the west and single family to the east. RTD bus maintenance facility to the north Commercial and residential to the south and northeast; I-225 to the east; commercial and community (Anschutz Fitzsimons Medical Campus) to the northwest. Recreation and vacant to the north; community to the south (Anschutz Fitzsimons Medical Campus) Vacant parcels immediately south, surrounded by industrial uses; to the east, commercial along Peoria and residential. Source: FasTracks I-225 Team, 2008 Per station area plan, primarily mixed-use office along Iliff Avenue and mixed-use housing residential infill between Harvard Avenue and Yale Avenue Station area plan pending Development of vacant property for mix of commercial and residential uses (Metro Center) Per station area plan, development of vacant property for mixed-use housing (Abilene Station) Per station area plan, mixed-use office immediately west. Public open space along Toll Gate Creek to the west and south and infill and redevelopment with mixed use housing to the east. Per station area plan, public open space along Toll Gate Creek to the east. Mixeduse office and structure parking immediately to the west Continued community and mixed use development of Anschutz/Fitzsimons Medical Campus including the Colorado Science + Technology Park at Fitzsimons Per station area plans, infill and redevelopment west of Peoria with mixeduse office and mixed-use housing Yes Yes Yes Yes Yes Yes Yes Yes Land Use Page 3-15
22 Indirect Impacts Independent of this project, it is likely that each of the eight station areas would experience some degree of redevelopment in the future as expressed through Aurora s station area planning process. Each station area would lend itself to TOD; developments that generally have an increased density, mix of land uses and encourages use of transit and other alternative modes of travel. While the exact timing of these developments is unknown, some of the planning process has begun at certain locations. During the Project Partners coordination process, planners in Aurora and Denver expressed concerns that proposed surface parking at the transit stations would require land that would be better used for TOD. The City of Aurora is addressing this concern during their station area planning process. If TOD plans come to fruition, changes in density could result in increased employment and denser residential development at station areas. Temporary Construction Impacts Land use policies and planning would be unaffected by the construction activities associated with the Preferred Alternative. Cumulative Impacts The Preferred Alternative in conjunction with current and planned transportation projects would result in improved regional options for transit riders and improved mobility for motorists. These improvements have been known to redirect growth as residents and business owners seek to live and work in locations with reliable and efficient transportation systems. As population continues to increase, new development projects would result in land use changes. For example, all of the current and future reasonably foreseeable development projects identified in the Project Study Area would occur on vacant land or on land that traditionally was used for other purposes. Upon completion of the project, that land use would be converted to support residential, commercial, and institutional uses. For example, between 1950 and 1990, non-residential development increased by 507 percent, while residential development increased by 264 percent. This land formerly was vacant and dominated by herbaceous cover (RTD, 2007). Land use changes within the Project Study Area are not necessarily considered to have negative environmental consequences, especially because the City of Aurora and other jurisdictions plan for and address such changes in their local and regional plans. For example, the identified development projects in Table encompass high density and/or mixed uses. Additionally development associated with I-225 station areas will be subject to the Aurora Transit Oriented Development District (2009b). This zoning district emphasizes urban form over land uses and provides a flexible approach to encourage compact developments around transit stations. These projects will help consolidate anticipated growth as infill around proposed I-225 stations, which ultimately can reduce urban sprawl. Land Use Page 3-16
23 3.1.3 Mitigation Measures The implementation of the Preferred Alternative would provide an overall benefit to land use planning and help conserve land resources by promoting TOD over more consumptive, dispersed development practices. No mitigation measures are required under the Preferred Alternative as shown in Table Table Summary of Land Use Impacts and Mitigation Measures Impacts Direct Impacts Conversion of land to transportation uses Project is consistent with local plans Indirect Impacts If TOD plans come to fruition, changes in density could result in increased employment and denser residential development. Temporary Construction Impacts No temporary construction impacts Source: FasTracks I-225 Team, 2009 Mitigation Measures No mitigation required No mitigation required No mitigation required Land Use Page 3-17
24 3.2 Economic Considerations This section provides an overview of existing economic conditions and summarizes existing and projected future economic conditions, including personal income, retail sales, and employment. The section also identifies impacts of the Preferred Alternative and the No-Action Alternative on sales tax, property tax, and other revenue sources, and mitigation requirements. Economic conditions were evaluated using a study area extending 1,000 feet on either side of the LRT alignment plus a 0.5-mile radius from each station. This is referred to in this section as the economic study area Affected Environment Total Employment and Employment by Sector Employment trends have been identified based on Denver Regional Council of Governments (DRCOG) data and projections. Citywide, Aurora had over 116,000 jobs and 6,000 businesses (DRCOG, 2007) while the economic study area contained 20,060 jobs as of The majority (62 percent) of these jobs were service-related, as shown in Table Total employment in the study area is forecast to grow by 184 percent, resulting in a total of 56,928 jobs by 2035 (Table 3.2.1). This anticipated growth primarily is fueled by service-related activity. Employment growth is expected to be highest near the proposed Montview Station and Colfax Station, associated with the Colorado Science + Technology Park at Fitzsimons, which is part of the Anschutz/Fitzsimons Medical Campus, a growing employment center for the region that is expected to become a major regional employment center by 2035 (Figure 3.2.1). In addition, City Center is another important employment center for Aurora. Table Type of Employment within 0.5-Mile of Proposed Stations Employment 2005 Jobs 2005 Jobs 2035 Jobs 2035 Jobs (Percent) (Percent) Production 4,108 20% 9,126 16% Retail 3,423 17% 9,813 17% Service 12,529 62% 37,989 67% Total 20,060 56,928 Source: DRCOG, 2005, 2008 and FasTracks I-225 Team, 2008 Note: Employment estimates based on 0.5-mile buffers overlaid with transportation analysis zone (TAZ) data from DRCOG. Employment distribution is assumed to be equal throughout the TAZ such that data for part of a TAZ can be interpolated. Unemployment trends have been identified using data from the US Bureau of Labor Statistics (Figure 3.2.2). Data is available only at the county and metropolitan statistical area levels. Unemployment rates in these geographic areas increased from 2000 to 2003 and then decreased from 2003 to This trend is consistent with the nationwide economic downturn and slow recovery that occurred during this timeframe. Economic Considerations Page 3-18
25 Figure Total Employment within 0.5-Mile of Proposed Stations Source: DRCOG, 2005 and 2008 Figure Regional Unemployment Rates Source: US Department of Labor, 2008 Economic Considerations Page 3-19
26 Major Employment Centers/Business Districts Aurora City Center serves the City of Aurora and other surrounding communities. This major activity center includes government facilities, such as Aurora s Municipal Center and Arapahoe County s Center Point Plaza; numerous retail and entertainment venues, including Town Center at Aurora, Aurora City Place, and Century 16 Theatres; and some educational and day care facilities. The Anschutz/Fitzsimons Medical Campus draws employees from all around the Metro Region. This campus, which contains the University of Colorado Hospital, Children s Hospital, the William T. Fitzsimons Reserve Center, and numerous planned bioscience facilities, is rapidly becoming a major regional employment center, and growth is expected to continue through These facilities are shown in Figures and in Section 3.4. Housing/Household Income Characteristics According to the 2006 US Census Bureau, the vacancy rate within the City of Aurora was approximately eight percent. In 2006, the rental vacancy rate in Aurora was about 10 percent and homeowner vacancy rate was about four percent (Census, 2006). Similarly, in 2006, the Metro Area had a rental vacancy rate of 11 percent and a homeowner vacancy rate of four percent (Census, 2006). Overall, these figures are slightly higher than vacancy rates experienced throughout the State of Colorado in The balance between jobs and housing represents the relationship between the number of people employed in an area and potential housing opportunities in that area. In theory, a balanced community would have 1.0 to 1.5 jobs available for every housing unit resulting in less commuting. A ratio over this range means there are too many jobs available compared to housing units. A ratio under this range would indicate that there are too few jobs to accommodate the housing units in an area. Factors such as major employment centers, commercial/retail nodes, and housing densities may influence this balance. The City of Aurora is moving toward a more favorable balance of jobs to housing. However, jobs to housing ratios within 0.5-mile of proposed station locations suggest that the station areas will serve as employment centers for the Metro Region. In 2005, 10,360 households and 20,060 jobs were present within the 0.5-mile of proposed stations which resulted in a housing to jobs ratio of 1:1.9. This indicates that the proposed station locations currently serve as major employment centers. In 2035, the housing to jobs ratio is expected to increase to 1:3.2, which suggests that many more housing units would be needed to obtain a favorable balance at these major employment centers. In 2006, the median household income in the City of Aurora was $47,471. Taxable Retail Sales Trends Between 2001 and 2005 taxable annual retail sales for the City of Aurora increased by 7.1 percent annually, from $2.8 billion to $3.0 billion. The overall growth for this time period was fueled primarily by restaurant and discount store activities in the study area. This data does not include grocery sales because grocery food sales generally are not taxable. (City of Aurora Budget Department, 2008) Economic Considerations Page 3-20
27 Assessed Valuation and Annual Property Tax Revenue Assessed valuation represents the property value assigned by the county for tax assessment purposes. Municipal tax revenue as described below refers only to revenue generated through a city levy or a county levy for use by that city or county. Total property tax revenue applies on the county level only and encompasses revenue generated through levies for school districts, junior colleges, the county itself, cities and towns, and special districts all located within the county. Table represents these values as a baseline for comparison with the potential revenue losses described in the Impact Evaluation section. Table Summary of 2007 Assessed Values and Tax Revenues Location Total Assessed Municipal Tax Total Property Tax Value Revenue Revenue City and County of Denver $10,657,404,830 $289,105,557 $752,371,316 Adams County $4,524,060,000 $121,777,091 $452,540,812 Arapahoe County $7,686,129,630 $116,176,963 $676,268,997 City of Aurora $3,060,114,170 $32,746,282 Not Applicable Source: Colorado Department of Local Affairs, Impact Evaluation New transportation infrastructure, such as the proposed I-225 LRT, has the potential to affect future community development. Affects could be negative (by drawing people or businesses away) or positive (by creating a climate for economic investment around stations and in areas served by transit). For example, siting stations in existing employment centers likely would promote continued economic viability throughout that area. The impact evaluation section details how both the Preferred Alternative and the No-Action Alternative may affect shifts in employment and income, property taxes, assessed valuation No-Action Alternative The No-Action Alternative is described in detail in Chapter 2. The No-Action Alternative would not result in direct impacts to economic conditions because no I-225 corridor LRT facilities would be constructed. Other transportation projects included in the No-Action transportation network may have impacts to economic conditions. The impacts of these other projects have been or will be considered in the NEPA process for each of these projects, and avoidance, minimization, and/or mitigation specified, as appropriate, in the specific NEPA decision documents for each project. With the No-Action Alternative growth, employment, and income would be expected to continue along current trends. Private property may be acquired as a part of other transportation projects resulting in modest impacts to tax revenues and potential loss of businesses and employment. Indirect Impacts Without the stimulus at new transit stations, economic growth associated with TOD would not be experienced in the No-Action Alternative. Economic Considerations Page 3-21
28 Cumulative Impacts The No-Action Alternative would result in fewer travel options for commuters, thus reducing appeal to some new residents and businesses. Compared with other areas in the Metro Region, this may reduce the economic vitality of the Project Study Area Preferred Alternative The Preferred Alternative is described in detail in Chapter 2. Potential impacts of the Preferred Alternative are described below. Employment /Major Employment Centers/Business Districts Direct impacts to economic conditions includes the displacement and relocation of an estimated 18 retail and service businesses. The number of business displacements is an estimate based on real estate negotiations and acquisitions based on preliminary design as discussed in Section 3.3. Table shows the number of businesses and employees that would be affected by property acquisitions associated with the Preferred Alternative. The displacement of these businesses and jobs represents less than 0.3 percent of Aurora s total businesses. A majority of the business displacements are located along Peoria Street. Table Potential Business and Employment Impacts Alternative Section Displaced Businesses Estimated Employment Displacement* Nine Mile to Exposition 0 0 City Center 0 0 Ellsworth to Fitzsimons/Montview 2 5 Fitzsimons/Montview to Peoria/Smith Total Source: FasTracks I-225 Team, 2008 * Based on car counts and a 1.1 multiplier. Direct impacts to existing businesses were evaluated using the number of businesses that would be displaced (based on Section 3.3) and the subsequent number of employees that would be affected. To determine the number of employees at each business, car counts were conducted at each potentially affected business and then a multiplier of 1.1 was applied to that number. Relocation decisions would be made by the affected business owners. It is likely that some business owners may chose to relocate nearby, while others may relocate to more distant locations. Some may choose to close, rather than relocate. Another direct and permanent economic impact of the Preferred Alternative would be new jobs created to maintain and operate the I-225 LRT. Based on estimates from RTD s current system, approximately 94 jobs would be created to maintain and operate the Preferred Alternative. From RTD s experience, each mile of LRT would require approximately 8.9 new full-time RTD employees. Economic Considerations Page 3-22
29 Permanent changes to access would occur for some businesses due to the presence of the LRT. All impacted business access will be replaced with an adequate alternate access. Some existing business access would be closed and rerouted to a new, consolidated access location at a signalized intersection. Some business access along the center running alignments in Exposition Avenue, Sable Boulevard, and Ellsworth Avenue would be changed from full access to right-in right-out access at median closure locations. Additionally, existing and new signalized intersections will maintain full access to businesses. The potential location of closures, median closures, and gated and/or signalized intersections that could affect existing businesses are shown in Chapter 4, Figures 4.5 through 4.8. Specific impacts to business access and relocations will be determined as engineering design continues and in coordination with business owners. Access changes are depicted in detail in Appendix A. Assessed Valuation and Property Tax Revenue Anticipated changes to property tax bases and revenues that would result from the conversion of private property to transportation use were estimated using 2007 county assessor data for each potentially affected parcel. If a full acquisition is expected, then the total assessed value in its entirety was considered. On the other hand, if a partial acquisition is expected, then only a portion of the total assessed value was used to avoid overstating impacts. For example, if 10 percent of a parcel would be acquired, then 10 percent of the assessed value was counted as the impact. Table shows potential reduction in property tax revenues that could result from right-ofway acquisition for the Preferred Alternative. The City of Aurora could experience a reduction of $68,883, which amounts to approximately 0.2 percent of its annual property tax revenue. Compared to the base values received by the counties and by Aurora in 2007 (Table 3.2.2), these reductions would be relatively small. Increases in property values with new development near stations could partially or entirely offset these reductions. Table Summary of Potential Tax Revenue Impacts Location Reduction in Municipal Tax Revenue Percent Reduction Reduction in Total Property Tax Revenue Percent Reduction City and County of Denver $2, % $6, % Adams County $51, % $175, % Arapahoe County $65, % $361, % City of Aurora $68, % Not Applicable Not Applicable Source: Adams County, 2008; Arapahoe County, 2008; City and County of Denver, 2008, FasTracks I-225 Team, 2008 Indirect Impacts As an indirect impact, increased TOD associated with the Preferred Alternative could increase the number and variety of businesses and employment opportunities around stations. Currently, land uses in the vicinity of proposed stations include commercial, office, and residential. Future growth near stations likely would include medium- to high-density mixed use development. Economic Considerations Page 3-23
30 Proximity to rail transit projects has generally been shown to have a positive effect on property values (Diaz, 1999). The Preferred Alternative would provide a high level of access to work and other facilities, thereby causing the monetary value of this access to be reflected indirectly in the value of surrounding residences and businesses (Parsons Brinckerhoff, 2001). Commercial land values may rise because additional potential shoppers would have improved access to adjacent retail outlets. Furthermore, residential and commercial development tends to have higher land values when situated near transit (Cervero et al., 2004). Temporary Construction Impacts Construction impacts of the Preferred Alternative would be associated with both LRT construction and roadway reconfiguration and would include dust, noise, and temporary visual changes. In addition, businesses may experience temporary access modifications during construction. Specific details about temporary access modifications are determined as construction phasing plans are established. Should such impacts occur near businesses along the corridor, especially near City Center and along Peoria Street, these businesses could experience a temporary decrease in patronage. Assuming the total project cost for the I-225 Corridor is $615 million (2009 dollars), almost 800 temporary construction jobs would be created for the duration of construction. This estimate was calculated using 40 percent of the project cost (which is an industry standard to determine labor cost). That cost was then divided by the construction period of 4 years and then by the 2015 average income for a construction worker in the Metro Region ($76,860). Additionally, the construction expenditures and employment will result in indirect (induced) employment and wage benefits associated with supporting construction services and the retail sector. Cumulative Impacts The Preferred Alternative in conjunction with other past and reasonably foreseeable future transportation projects in the Project Study Area would improve traffic conditions and reduce congestion at the local level. As a result, the cost of congestion to individuals and business owners would decrease slightly, while livability of the area would increase. Enhanced livability potentially may draw in new businesses and employees from around the Metro Region. Current and future mixed use and TOD within the Project Study Area may increase property values in surrounding areas. Property values increases generally represent a beneficial impact for property owners in terms of resale value and for municipalities in terms of property tax revenues. Nevertheless, such increases in the cost of living can be an adverse impact to lowincome populations. Implementation of the Preferred Alternative in conjunction with other local actions also would stimulate the local and regional economy. Temporary construction jobs would be created, and construction materials would need to be procured. Economic Considerations Page 3-24
31 3.2.3 Mitigation Measures Table summarizes impacts and mitigation measures to address the identified economic impacts from the Preferred Alternative. Table Summarization of Economic Impacts and Mitigation Measures Impacts Direct Impacts Potential displacement of 18 businesses and 62 jobs New jobs created to construct, operate and maintain I-225 LRT Permanent access changes to businesses Annual property tax revenue reduction of 0.2 percent Indirect Impacts Increased TOD could increase the number and variety of businesses and employment opportunities around stations Temporary Construction Impacts Adjacent businesses may experience noise, dust, and temporary visual changes Temporary access modifications to adjacent businesses Increased construction employment and revenues Mitigation Measures See Section 3.3, Right-of-Way and Relocations New access evaluated based on input from business owners No mitigation required See Section 3.8, Visual and Aesthetic Resources See Section 3.9, Air Quality and Energy See Section 3.10, Noise and Vibration Develop traffic maintenance plans to maintain access and circulation A Construction Management Plan will be developed in coordination with local communities and businesses In accordance with the Construction Management Plan the following measures will be implemented: Where possible business access closure will be limited to outside of normal operating hours Provide clear signage for detours Coordinate with local groups, business districts, and jurisdictions regarding construction impacts using a variety of media (for example radio, flyers advertisements, and website), where appropriate Source: FasTracks I-225 Team, 2009 Economic Considerations Page 3-25
32 3.3 Right-of-Way and Relocations This section identifies public and private property acquisitions and displacements resulting from right-of-way requirements for the Preferred Alternative. Property acquisition is necessary to obtain public right-of-way to construct the Preferred Alternative. The alternative development process included efforts to avoid and minimize both impacts to private property and displacements. These efforts will continue during preliminary and final design. As described in Chapter 5.0, Section 5.3, the public outreach process conducted during alternative development included meetings with affected property owners throughout the project. Acquisitions and relocations would be conducted in accordance with the Uniform Relocation Assistance and Real Property Acquisition Policies Act of 1970, as amended. Relocation resources are available to all residents and business relocatees without discrimination Affected Environment Previous studies and planning efforts by RTD, CDOT and the City of Aurora identified right-ofway needs for the FasTracks I-225 LRT project. These previous studies considered areas including I-225 between Parker Road and Exposition Avenue; some city streets such as Sable Boulevard, Fitzsimons Parkway, and Peoria Street; and some dedicated easements as part of the City s site development process (i.e., Abilene Station TOD and Colorado Science + Technology Park at Fitzsimons). Public and private parcel ownership comprises undeveloped parcels and a mixture of business, residential (a variety of single and multi-family dwellings), and other uses. The Preferred Alternative falls within and/or abuts CDOT right-of-way in the Nine Mile to Exposition and Ellsworth to Fitzsimons/Montview Sections Impact Evaluation This section describes impacts of the No-Action Alternative and Preferred Alternative in terms of right-of-way acquisitions and relocations. It identifies properties that may be acquired fully or partially and associated displacements of property owners or tenants that would result. Full property acquisitions and displacements resulting from construction of the Preferred Alternative would affect businesses only; no full acquisitions of residences or residential displacements are expected with this project. The right-of-way acquisition process will begin after preliminary engineering has been completed and is subject to negotiation with individual owners. This analysis represents a best estimate based on the current level of design. Potential real property (land) acquisitions were identified using the project footprint. The limits for the permanent project footprint were aligned with parcel data to determine potential partial and full property acquisitions. Full acquisitions were assumed if the alternative would remove the main structure, if access could not be provided, if a substantial portion of parking for a business would be removed (more than 50 percent or potential for shared parking), or if the remaining parcel of land otherwise would become an uneconomic remnant. Partial acquisitions were identified where permanent project footprint encroached upon parcel boundaries but the impacts would not require full acquisition. Right-of-Way and Relocations Page 3-26
33 This extent of potential real property impacts then was used to identify potential displacements. For partial property acquisitions, impacts to site features (e.g., sheds and outbuildings) have also been identified. In accordance with the City of Aurora parking and landscaping requirements, potential parking and landscaping impacts also were estimated. Impacts to public right-of-way (owned by either City of Aurora or CDOT) were assessed in a similar manner. Not all property within the project footprint would be affected permanently. During the alternative development process, areas of permanent and temporary impact were identified and differentiated with specific minimization measures implemented to reduce right-of-way needs and resulting property impacts. Permanent impacts of the Preferred Alternative and No-Action Alternative are described in Section Minimization efforts, described in Section 3.3.3, will be continued through preliminary and final design of the Preferred Alternative. Final property acquisitions will be determined after preliminary engineering and during RTD s right-of-way acquisition process No-Action Alternative The No-Action Alternative is discussed in detail in Chapter 2. The No-Action Alternative does not result in direct impacts involving property acquisitions or relocations because no I-225 corridor LRT facilities would be constructed. Other transportation projects included in the No-Action transportation network may require property acquisition and relocations. The impacts of these other projects have been or will be considered in the NEPA process for each of these projects, and avoidance, minimization, and/or mitigation specifies as appropriate in the specific NEPA decision documents for each project. Indirect Impacts In addition to the direct job losses associated with business displacements of other actions, some employees have the potential to be indirectly impacted, though it is difficult to quantify. Cumulative Impacts Historically, about 20 percent of developed lands are used for local infrastructure projects, such as streets, parking facilities, schools, utility right-of-way, and parks. This trend is expected to continue alongside increasing development in the Project Study Area. Assuming a density of 10 persons per acre and approximately 35,000 new residents in the Project Study Area by 2035, about 3,500 new acres of development would be required. If 20 percent is committed to public infrastructure, this amounts to a need for approximately 700 acres Preferred Alternative The Preferred Alternative is described in detail in Chapter 2. Table summarizes direct property impacts throughout all four sections. In total, 66 acres would be acquired as full or partial acquisitions from 127 parcels throughout the corridor. Additionally, 37 acres of Aurora right-of-way and 46 acres of CDOT right-of-way will be required to develop the Preferred Alternative. Final property acquisitions and relocations would be determined after preliminary engineering, during RTD s right-of-way acquisition process. Impacts to employees of displaced businesses were described in Section 3.2. Right-of-Way and Relocations Page 3-27
34 Table Summary of Right-of-Way Impacts Total Section Number of Parcels Approximate Acreage Other Impacts Full Acquisitions Partial Acquisitions 23 3 Aurora Right-of-Way NA 10 No other impacts CDOT Right-of-Way NA 42 Full Acquisitions Partial Acquisitions Aurora Right-of-Way NA 16 1 bus shelter and 2 storage sheds CDOT Right-of-Way NA 0 3 Full Acquisitions 3 1 Partial Acquisitions business displacements and 130 storage units displacements Aurora Right-of-Way NA 3 3 garages at Copper Flats CDOT Right-of-Way NA 4 Full Acquisitions Partial Acquisitions business displacements and Aurora Right-of-Way NA storage units displacements CDOT Right-of-Way NA 0 Full Acquisitions business displacements, 250 Total Partial Acquisitions storage units displacements, 3 Aurora Right-of-Way NA 37 garages, 1 bus shelter, and 2 CDOT Right-of-Way NA 46 storage sheds Source: FasTracks I-225 Team, 2008 Note: All breaks in the Access control Line of I-225 will be processed and approved by CDOT and FHWA according to proper procedures. Section 1 Nine Mile to Exposition Commercial or undeveloped property impacts within this section would involve 23 partial property acquisitions and two full property acquisitions (Table 3.3.1). The two full property acquisitions would occur near the proposed Iliff Station. One of these parcels is undeveloped. The other is predominately undeveloped with the exception of overflow parking for the adjacent office building. No displacements would occur in this section. Section 2 City Center Commercial, residential, and vacant full and partial property impacts would include approximately 16 acres in and around the City Center area (Table 3.3.1). This total comprises 41 partial property acquisitions and two full property acquisitions. The two full property acquisitions would occur near the 2nd/Abilene Station, between the Member s Federal Credit Union building and the Cherry Grove East Condominiums. One of these parcels is vacant, and the other contains overflow parking for the credit union. No displacements would occur in the City Center Section. CDOT does not own land within the City Center Section, which means CDOT right-of-way impacts would not occur. Right-of-Way and Relocations Page 3-28
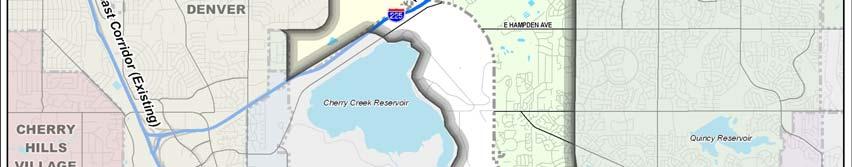
35 Section 3 Ellsworth to Fitzsimons/Montview Construction of this section would involve 23 partial acquisitions and three full acquisitions of private property (Table 3.3.1). Two of the full acquisitions would occur near the Colfax Station resulting in the displacement of two businesses. Additionally, 130 storage units would be displaced (Table and Figure 3.3.1). Business owners and tenants would be eligible for relocation benefits. Minimization efforts during the alternative development process, which are discussed further in Section 3.3.3, reduced full displacement impacts so that 88 percent of mini storage units would remain intact following construction of the project. The other full acquisition would involve a small parcel of vacant land. As a means to use existing resources and reduce right-of-way impacts, RTD is utilizing land it presently owns near the proposed 13th Avenue Station, which is located just south of RTD s existing Bus Maintenance Facility on Colfax Avenue. Table Displacements in Section 3 Map ID (Property) Business Name Address Potential Displacement Impact Business Type (NAICS Classification) 13, 14 A-AAA Key Mini Real Estate and Rental 1520 Potomac St 130 Storage units Storage and Leasing 15 Country Liquors E Colfax Ave One business Retail Trade 16 Car Care Conoco E Colfax Ave One business Other Services Source: Adams County, 2007 and FasTracks I-225 Team, Business names are based on field surveys completed in Fall Notes: NAICS represents industry classifications under the North American Industry Classification System (Census, 2008) Section 4 Fitzsimons/Montview to Peoria/Smith Section 4 would result in 22 partial property acquisitions and 11 full property acquisitions. Eight of these full property acquisitions are associated with business displacements as discussed below. The remaining three full property acquisitions involve undeveloped land between East 31st Street and Peoria Mart. A new road will be provided on these three parcels to access to remaining businesses to the north and south. Between Fitzsimons/Montview and Peoria/Smith, the project would displace 16 businesses, two are currently vacant, and 120 storage units along the west side of Peoria Street. Figure illustrates the locations of these displacements. These impacts would result from the LRT alignment and potential loss of access and/or parking. These potential displacements are summarized in Table Relocation of these businesses would be discussed during RTD s right-of-way acquisition process. Impacts to employees of displaced businesses were described in Section 3.2. Right-of-Way and Relocations Page 3-29


36 Figure Displacements in Section 3 Source: Adams County, 2007, Arapahoe County, 2008; City and County of Denver, 2008; City of Aurora, 2007; and FasTracks I-225 Team, 2008 Right-of-Way and Relocations Page 3-30


37 Figure Displacements in Section 4 Source: Adams County, 2007, City and County of Denver, 2008; City of Aurora, 2007; and FasTracks I-225 Team, 2008 Right-of-Way and Relocations Page 3-31
38 Table Displacements in Section 4 Map ID (Property) 1 2 Business Name Squeeky Clean Car Wash Pho Duy II Address Potential Displacement Impact Business Type 3391 Peoria St One business Other Services 3371 Peoria St One business Accommodation and Food Services 3 A & D Tire Sales 3351 Peoria St One business Retail Trade 4 Real de Minas Restaurant and Food 3341 Peoria St One business Mexican Grill II Services 5 Chester Philly Restaurant and Food 3301 Peoria St One business Grill Services 6 Overhead Door Company of Denver, Nutrasan (NSI), 3191 Peoria St Five business Vacant and Other Services Western Union, Vacant, Vacant 7 N Mart Food Store 3113 Peoria St One business Retail Trade 8 Carniceria Meat Market 3103 Peoria St One business Retail Trade Cricket Wireless, 9 Boyde s Family Retail Trade and Other 3091 Peoria St Three businesses Barbers, Services Blooming Ideas Flowers 10 Peerless Tires 3001 Peoria St One business Retail Trade 11, 12 U Store Self E 30th Real Estate and Rental and 120 Storage units Store Ave Leasing Source: Adams County, 2007 and FasTracks I-225 Team, 2008 Notes: NAICS represents industry classifications under the North American Industry Classification System (Census Bureau, 2008). Business names are based on field surveys completed in Fall Minimization and mitigation measures relating to this Section are discussed in Section Indirect Impacts The property acquisitions would indirectly result in job displacement, as discussed in Section Temporary Construction Impacts As noted, not all property within the project footprint would be affected permanently. During the alternative development process, areas that would be affected permanently and temporarily were identified and differentiated. Temporary impacts may be associated with staging, materials storage, and parking as necessary to construct the project. Following the project, land affected Right-of-Way and Relocations Page 3-32
39 temporarily would be returned to its pre-project condition. In addition, property access may be impacted as previously discussed in Section 3.2. Temporary impacts would include less than 15 acres in Section 1, less than 18 acres in Sections 2 and 3, and less than 10 acres in Section 4. Not all of the land identified would be necessary for construction activities. Some construction easements for temporary land use would be required. These easements will be identified during the design phase. Lastly, construction of the Preferred Alternative could affect surrounding roadways through temporary road closures and detours. Cumulative Impacts Full and partial property acquisitions required for the Preferred Alternative (approximately 66 acres excluding public right-of-way needs) would compound property needs associated with other local actions in the Project Study Area. While the Preferred Alternative would require up to 18 business relocations, these other local actions may displace additional businesses and even residents. At present, available business location stock exceeds potential relocation requirements associated with the Preferred Alternative. Abundant housing and business relocation opportunities exist throughout Aurora to accommodate displacements resulting from other local actions. Although market conditions are difficult to forecast with absolute certainty, future housing and business availability is favorable for future relocatees based on existing availability and forecasts. As a result, no cumulative relocation impacts are expected from the Preferred Alternative Mitigation Measures Minimization efforts were identified during Preferred Alternative development to avoid or minimize property acquisitions as discussed below. Mitigation measures for property impacts that could not be avoided are discussed in Table Avoidance and Minimization Measures Input provided during the public involvement process was a key factor in development of alternatives to avoid and minimize impacts to private property. Outreach included public meetings and newsletters. In addition residents and business owners have been actively involved in Key Stakeholder Meetings and have participated in small group meetings as discussed in Chapter 5. The I-225 Project Team met on December 15, 2008 to review preliminary project impacts, to review existing avoidance measures, and to identify additional minimization measures. Specific right-of-way avoidance and minimization measures are described below according to each section. In total, over 15 business displacements were avoided during the avoidance and minimization process. Efforts were made to reduce the extent of permanent impact only to include land necessary for the LRT alignment, stations, park-n-ride facilities, and associated roadway improvements. This commitment to minimize permanent impacts reduces the amount of public right-of-way and private and public parcels (including parking) that would be necessary for implementation of the Preferred Alternative. Right-of-Way and Relocations Page 3-33
40 Section 1 Nine Mile to Exposition The LRT alignment and project footprint were shifted west along Abilene Street to minimize further commercial property impacts near the Florida Station. Section 2 City Center Initial planning and engineering efforts within this section led to selection of a center-running alignment to avoid major permanent impacts to business and residential property in the City Center area. As a result, less parking would be affected and one less residential storage shed near Walsh Drive and Exposition Avenue. Lastly, the project footprint was modified near the intersection of Centrepointe Drive and Sable Boulevard and near Member s Federal Credit Union to further reduce the amount of business property that would be needed to construct the City Center and 2nd/Abilene Stations and park-n-rides. Section 3 Ellsworth to Fitzsimons/Montview The avoidance and minimization process reduced potential impacts to other property, such as one of the Copper Flats garages. In addition, the potential full property acquisition of a storage unit facility has been reduced to a partial acquisition. Section 4 Fitzsimons/Montview to Peoria/Smith The Preferred Alternative was located on the west side of Peoria Street for the following reasons: Reflection of the City of Aurora s preference and station area planning process Avoidance of Aurora s Fire Station No. 3 a critical community resource and the Greater Wayside Church of God in Christ, which are located on the east side of Peoria Street Consideration of input from the Morris Heights Neighborhood, which is located on the east side of Peoria Street An alignment situated behind (west of) developed properties on the west side of Peoria Street would have produced multiple transportation corridors and potential impacts to floodplains A center-running alignment extending to the Peoria/Smith Station would preclude a possible future grade separation of Peoria Street and Union Pacific Railroad Given the potential impacts of the west-running alignment, efforts were made to reduce the extent of permanent impact. Efforts to minimize permanent impacts reduce the amount of displacements and private property (including parking) that would be necessary to implement the Preferred Alternative Mitigation Measures General mitigation measures for all sections are presented in Table Relocation decisions are made by the business owner. Analysis has determined that adequate relocation opportunities are available. Relocation opportunities within the Peoria Street and Colfax Avenue areas include undeveloped parcels and vacant building space. Additional relocation opportunities may be available in other parts of the Metro Region and associated with anticipated TOD. Right-of-Way and Relocations Page 3-34
41 Table Summarization of Right-of-Way, and Relocation Impacts and Mitigation Measures Impact Direct Impact 66 acres from 127 parcels 46 acres of CDOT right-of-way 37 acres of Aurora right-of-way Use of existing 16 acre RTD owned parcel Displacement of 18 businesses and 250 storage units Other impacts: 3 garages, 1 bus shelter, and 2 storage sheds Mitigation Measures Acquisition. The acquisition of real property interests will fully comply with the Uniform Relocation Assistance and Real Property Acquisition Policies Act of 1970, as amended (Uniform Act) and the Fifth Amendment of the United States Constitution. The Uniform Act applies to all acquisitions of real property or displacements of people resulting from federal or federally assisted programs or projects. Relocation resources are available to all residential and business relocatees without discrimination. All affected owners will be provided notification of the acquiring agency s intent to acquire an interest in their property, including a written offer letter of just compensation specifically describing those property interests. Relocation Analysis. RTD will prepare a relocation analysis to enable relocation activities to be planned in such a manner that the problems associated with the displacement of businesses are recognized and solutions are developed to minimize the adverse impacts of displacement. The Relocation Study will estimate the number, type, and size of businesses and nonprofit organizations to be displaced and the approximate number of employees that may be affected; and consider any special advisory services that may be necessary from RTD and other cooperating agencies. Relocation Assistance Advisory Services. Relocation assistance will include determining the relocation needs and preferences of each business to be displaced and explaining the relocation payments and other assistance for which the business owner is eligible; providing current and continuing information on the availability, purchase prices, and rental costs of comparable replacement commercial properties, and other programs administered by the Small Business Administration and other federal, state, and local programs offering assistance to the displaced businesses. The Uniform Act provides numerous benefits to these individuals to assist them both financially and with advisory services related to relocating their business operations. Right-of-Way and Relocations Page 3-35
42 Impact Mitigation Measures Payments. The relocation payments provided to displaced businesses are determined by federal eligibility guidelines. Indirect Impacts Loss of employment Temporary Construction Impacts Use of property for temporary construction easements or equipment staging as determined during design Restricted access during construction Road closures and detours Source: FasTracks I-225 Team, 2009 No mitigation required Coordinate use with a specific property owner where a temporary construction easement is required Provide temporary access during normal business hours Provide adequate detours, including advanced notice and signing before beginning construction Right-of-Way and Relocations Page 3-36
43 3.4 Social Impacts, Facilities and Environmental Justice Social Impacts and Community Facilities This section provides an overview of social and community factors and discusses social and community impacts, including environmental justice impacts, from the No-Action Alternative and the Preferred Alternative Affected Environment This project would affect communities within the City of Aurora (in both Adams and Arapahoe Counties) and a planned community within the City and County of Denver. Data were collected from the Denver Regional Council of Governments (DRCOG), U.S. Census, City of Aurora, and City and County of Denver. Additionally, the public outreach process was used to identify valuable community resources and issues of concern regarding the proposed transportation project. The social, community, and environmental justice study resources were evaluated within an area extending 0.5-mile from proposed stations and 1,000 feet of the LRT centerline. Although all existing neighborhoods in the study area are located within the City of Aurora, city-wide characteristics are also provided for comparison purposes. Neighborhoods and Travel Patterns The study area is located within an urban corridor and intersects 65 registered neighborhood associations (neighborhoods) characterized by single- and multi-family housing. These neighborhoods are situated adjacent to office and industrial complexes, institutional facilities, and retail centers. Many of these neighborhoods developed around I-225 and do not span across both sides of the highway. As evidenced by active homeowner associations and participation in the Environmental Evaluation (EE) public involvement process (discussed in Chapter 5), residents in these neighborhoods emphasize strong community cohesion. Existing neighborhoods are shown on Figure through Figure Planned and approved residential developments are discussed in Section Travel patterns within neighborhoods are discussed in detail in Chapter 4. Population and Household Characteristics As illustrated in Figure 3.4.1, Aurora had an estimated population of 303,582 in 2006 (Census, 2006). Aurora has experienced 37 percent population growth between 1990 and 2006 and 10 percent between 2000 and Social Impacts, Facilities and Environmental Justice Page 3-37

44 Figure Regional Population Trends Source: Census 1990, 2000, and 2006 In 2006, Aurora had an estimated 125,360 housing units. Of these, approximately 50 percent were single-family detached, 12 percent single-family attached or duplex, and 37 percent multifamily. Over 90 percent of housing units were occupied with 63 percent owner occupied and 37 percent renter occupied. Average household size ranged from 2.56 for owner-occupied units to 2.59 for renter-occupied units (Census, 2006). Section provides detailed income and minority data for the study area, including a discussion of low-income and minority communities. In 2006, median household income in the City of Aurora was $47,471 and 86 percent of households contained one or more vehicles (Census, 2006). Aurora s minority population comprises approximately 50 percent of the total population. Of the minority population in Aurora, approximately 29 percent was Hispanic (of any race). The additional racial composition was 16 percent Black or African American, six percent Asian, two percent American Indian or Alaskan Native, less than one percent Native Hawaiian or other Pacific Islander, and eight percent some other race (percentages shown do not add up to 100 percent because unaccounted percentages are for the census categories of some other race or two or more races ). Over 31 percent of Aurora s residents speak a language other than English at home, with 22 percent speaking Spanish and 9 percent other languages. In 2006, approximately nine percent of Aurora s population was 65 years of age and older, and 11 percent of the population was Social Impacts, Facilities and Environmental Justice Page 3-38
45 identified with disability status. Of the 72,459 family households in Aurora, approximately 34 percent contain children under the age of 18. Community Services and Facilities Figure through Figure show the community facilities within 0.5-mile of the station or 1,000-feet of alignment. Parks, recreational areas, and trails are presented in detail in Section 3.6. Major community facilities are concentrated within Sections 2 and 4. Section 2, includes Arapahoe County and City of Aurora municipal services, Aurora Public Library, Aurora History Museum, Aurora Police, and major retail developments including the Town Center at Aurora and Aurora City Center Place. Section 4 includes the Anschutz/Fitzsimons Medical Campus, the planned Colorado Science + Technology Park at Fitzsimons, and multiple emergency service providers Impact Evaluation This section describes impacts of the No-Action Alternative and Preferred Alternative. No-Action Alternative The No-Action Alternative is discussed in detail in Chapter 2. The No-Action Alternative would not result in direct impacts to community cohesion or community facilities because no I-225 corridor LRT facilities would be constructed. However, with the No-Action Alternative residents and people working in the area would not have the benefits that the Preferred Alternative would provide with regard to transit options. The lack of convenient, reliable transit options would impact the quality of life of residents within the corridor. The No-Action Alternative would not provide the benefit of expanded rail service connecting City of Aurora to downtown Denver and the East Corridor or DIA, and would not provide benefits for transit dependent populations. Other transportation projects included in the No-Action transportation network may have impacts to community cohesion and community facilities. The impacts of these other projects have been or will be considered in the NEPA process for each of these projects, and avoidance, minimization, and/or mitigation specified, as appropriate, in the specific NEPA decision documents for each project. Indirect Impacts Without LRT stations, no changes in population distribution or additional community gathering points would result from the No-Action Alternative. Cumulative Impacts Under the No-Action Alternative, the demographic character of neighborhoods and the need for community facilities would follow historical trends. Since 1950, the Project Study Area has changed from rural communities with low densities to an urbanized environment with a mixed use of commercial, industrial, and denser residential land uses. Over the last 30 years, neighborhoods have evolved around business centers and transportation facilities. As a result of the development, new community centers have been constructed to meet the changing needs of the residents. Social Impacts, Facilities and Environmental Justice Page 3-39


46 Figure Neighborhoods and Community Facilities in Section 1 Source: City of Aurora, 2007a and 2007b; FasTracks I-225 Team, 2008; DRCOG, 2007 Social Impacts, Facilities and Environmental Justice Page 3-40


47 Figure Neighborhoods and Community Facilities in Section 2 Source: City of Aurora, 2007a and 2007b; FasTracks I-225 Team, 2008; DRCOG, 2007 Social Impacts, Facilities and Environmental Justice Page 3-41


48 Figure Neighborhoods and Community Facilities in Section 3 Source: City of Aurora, 2007a and 2007b; FasTracks I-225 Team, 2008; DRCOG, 2007 Social Impacts, Facilities and Environmental Justice Page 3-42


49 Figure Neighborhoods and Community Facilities in Section 4 Source: City of Aurora, 2007a and 2007b; FasTracks I-225 Team, 2008; DRCOG, 2007 Social Impacts, Facilities and Environmental Justice Page 3-43
50 The No-Action Alternative would result in continued development of vacant areas along the outskirts of the Project Study Area. Population projections indicate that population will increase resulting in the creation of new neighborhoods and the need for new community centers to serve those neighborhoods (RTD, 2007). Planned mixed-use developments would still create new communities in the No-Action Alternative; however, these new communities would develop without the transportation benefit and community focal point provided by LRT transit access. Under the No-Action Alternative, the currently limited transportation infrastructure would likely remain a barrier to expansion and renewal of existing neighborhoods within the Project Study Area. Access to employment would be limited to those who have vehicle access or who use existing bus service. Some of the reasonably foreseeable future transportation projects, including implementation of the East Corridor, would contribute to improved transit access and connectivity of the surrounding area to other parts of the Metro Region. Transit improvements included in the No-Action Alternative would not directly provide transit service to neighborhoods that already lack access to employment and services in Aurora and beyond. Preferred Alternative The Preferred Alternative is described in detail in Chapter 2. Table summarizes the populations and households within 0.5-mile of the proposed stations in 2005 and There would be a direct benefit to people who live or work near the proposed stations, because of the increased accessibility to transit. This access would be particularly important for transit dependent persons, but would also benefit persons who own and use private vehicles. The Preferred Alternative would not result in the direct loss of population or housing units. Community cohesion and community facility impacts are discussed below. Table Population and Households within 0.5-mile of Stations Station 2005 TAZ 2035 TAZ Change Population Households Population Households Population Households Iliff 3,647 1,610 4,068 1,924 12% 19% Florida 5,211 2,269 5,348 2,482 3% 9% City Center 3,565 1,657 11,794 5, % 252% 2nd/Abilene 3,120 1,368 5,368 2,610 72% 91% 13th Avenue 4,259 1,651 5,804 2,372 36% 44% Colfax 3,874 1,407 5,116 1,978 32% 41% Montview , % 42% Peoria/Smith % 28% Source: DRCOG, 2005, 2008 and Fastracks I-225 Project Team, 2008 Social Impacts, Facilities and Environmental Justice Page 3-44
51 Section 1 Nine Mile to Exposition The Preferred Alternative location minimizes impacts to the neighborhoods located along the alignment and within a 0.5-mile radius of the Iliff and Florida Stations (Figure 3.4.2). There would be no isolation of existing neighborhoods, no residential property acquisitions, and no removal of community facilities in this section. Heather Gardens is the only neighborhood located directly adjacent to the LRT alignment, but the community is separated from the LRT alignment by an existing sound barrier, so no impacts are expected. Heather Gardens contains the highest elderly population in the Study Area. Individuals in Heather Gardens would be served by the proposed Iliff Station. Elderly and disabled individuals would benefit from improved regional transit access. These populations would not be affected adversely. The availability of alternate travel modes would increase in this section with the addition of the Iliff and Florida Stations connected to the regional rail system and a pedestrian bridge over I-225 near Florida Avenue. The Iliff Station would provide the addition of 600 surface parking spaces to conveniently access the LRT. The pedestrian bridge would offer safe and convenient access to and from the Florida Station from the west side of I-225, including the Medical Center of Aurora and neighborhoods on the west side of I-225. The pedestrian bridge also would provide improved access for bus patrons who utilize Routes 11 and 21, which are expected to remain in service under the Preferred Alternative. Changes in travel patterns would be limited to the Iliff Station area and its associated park-n- Ride as discussed in Chapter 4, Section Throughout the public involvement process, residents of neighborhoods near the Iliff Station have expressed concerns related to vehicle and pedestrian safety and the possibility of transit patrons parking outside of RTD park-n-ride facilities. Section 3.7 addresses safety concerns, while the Aurora Strategic Parking Plan and Program Study (City of Aurora, 2009) is expected to address city-wide parking issues. Section 2 City Center This section, situated in a suburban and commercial setting, includes the greatest number of social resources and community facilities of the four sections. Furthermore, the area around City Center is expected to have the largest rate of population growth by 2035 of all the sections. Of neighborhoods located within 0.5-mile of the City Center Station (Figure 3.4.3), the neighborhoods situated adjacent to the alignment have greatest potential to be affected directly by this project. Community impacts include partial property acquisitions and changes to access and parking. Ultimately, no fragmentation of existing neighborhoods and no residential, community facility, or commercial displacements would occur in this section. Under the Preferred Alternative, vehicles, pedestrians, and bicycles would cross LRT lines along Exposition, Sable, and Ellsworth Avenues at signalized intersections. These modes would be limited from entering the track alignment by ballast walls or concrete barriers plus fencing. Except at signalized intersections, access to businesses and neighborhoods would be limited to right-in and right-out access. Social Impacts, Facilities and Environmental Justice Page 3-45
52 City Center Station would provide access to numerous community resources, including the Aurora Municipal Center and Library and a large concentration of retail businesses. In addition, RTD patrons would have access to 200 parking spaces near this station and the regional rail system. Section 3 Ellsworth to Fitzsimons/Montview As shown in Figure 3.4.4, there would be no fragmentation of existing neighborhoods and no residential or community facility displacements in this section. The 2nd/Abilene Station would have bicycle and pedestrian connectivity with access to the regional High Line Canal Trail. Residents near the 13th Avenue and Colfax Stations would have direct access to LRT. Access to the 13th Avenue park-n-ride would occur along 13th Avenue through The Meadows neighborhood. The Colfax Station, because of its elevated platform, would minimize impacts to traffic operations, provide safer pedestrian access over the roadway, and provide convenient bus transfers to the highest volume routes in RTD s system. Considering the station s location near the Anschutz/Fitzsimons Medical Campus, pedestrians accessing this station may be visitors to or employees at medical and healthcare facilities in that area. The Colfax Station also provides close access to St. Pius 10th Church and School and to restaurants and other shops along Colfax Avenue. As described in Section 3.3 development of this station would displace two businesses. Section 4 Fitzsimons/Montview to Peoria/Smith This section currently contains the lowest population density and is expected to retain that status in This section, which includes a number of community facilities and recreation resources, would experience the greatest number of business displacements of the four sections as described in Section 3.3. No park-n-ride is planned at the Montview Station, which means traffic volumes should not increase as a result of the LRT. The introduction of LRT and numerous at-grade crossings would increase the risk for accidents between LRT, pedestrians, bicyclists, and motorists. RTD implements a number of measures to ensure safety in transportation corridors, which are described in Section 3.7. Access from the Peoria/Smith Station would serve residents in the Morris Heights, Montbello, Green Valley Ranch, and Stapleton neighborhoods. It would also provide access to the remaining businesses along Peoria and the Aurora Service Center. The Aurora Service Center is part of Adams County Social Services and provides programs and services to low-income, elderly, and disabled residents. Indirect Impacts Changes in population distribution may be recognized in areas around stations depending on how TOD occurs along the corridor. Stations associated with the Preferred Alternative may benefit community cohesion by creating a community gathering point and adding sense of place within neighborhoods. Residents within the corridor may indirectly experience visual and noise impacts due to the presence of LRT in their community. Social Impacts, Facilities and Environmental Justice Page 3-46
53 Temporary Construction Impacts Residences within 300 feet of the project footprint (approximately 2,900 households) would be most affected by temporary construction impacts including visual changes, dust, traffic congestion and noise. During construction, travel through the study area would be affected temporarily by construction of the LRT and by reconstruction of associated roadways and sidewalks. Motorists, cyclists, and pedestrians may need to use alternate routes or detours in this area during that time. Other potential adverse construction impacts include dust, noise, traffic congestion, and visual disturbance. Access to residential areas may be temporarily restricted or re-routed during construction, with residences adjacent to the proposed alignment expected to be impacted the most. As described in Section 3.7, care will be taken during construction and operation to ensure emergency vehicle access, mobility, and response times relating to this project are maintained in and around the Anschutz/Fitzsimons Medical Campus and throughout the study area. Cumulative Impacts The Preferred Alternative coupled with other local projects is expected to have an overall positive effect on community cohesion. Individuals would have access to an improved roadway and transit system, which would provide greater connectivity and employment access locally and regionally. Reasonably foreseeable future mixed use developments and TODs in the Project Study Area are expected to result in additional local employment opportunities, community focal points, and redevelopment opportunities within existing neighborhoods. Although the Preferred Alternative would displace a number of businesses, the long-term cumulative effects of providing transit access, and new operation and maintenance jobs overall is positive for local communities Mitigation Measures Minimization efforts were identified during Preferred Alternative development to avoid or minimize impacts to community resources as discussed below. Mitigation measures for impacts that could not be avoided are discussed in Table Avoidance and Minimization Measures An internal project meeting was held on December 15, 2008 to discuss preliminary project impacts, review existing avoidance measures, and identify additional potential minimization and mitigation measures. This section describes specific avoidance and minimization measures relating to social and community resources. During initial planning phases, an east-running alignment along I-225 in Section 1 was selected to avoid potential impacts to existing neighborhoods situated west of the highway. In Section 3, direct impacts to the Copper Flats apartment complex were avoided by developing an alignment that runs east of the complex rather than an alignment that would fragment the complex along 13th Avenue. A similar approach was taken in Section 4 as the Preferred Alternative was aligned to run along the west side of Peoria Street. While the western alignment would require the displacement of several businesses, it avoided displacement of community facilities including Aurora s Fire Station No. 3 and the Greater Wayside Church of God in Christ. Social Impacts, Facilities and Environmental Justice Page 3-47
54 As discussed in Section 3.3, throughout the entire corridor efforts were taken to minimize impacts to private property by reducing the project footprint and by identifying permanent impacts based on the maximum extent of property that would be needed for the Preferred Alternative alignment. Mitigation Measures Table summarizes impacts and mitigation measures that have been identified with implementation of the Preferred Alternative. This discussion includes mitigation measures to address temporary impacts associated with construction of the Preferred Alternative. Specific types of potential community impacts are evaluated in other sections of this document including environmental justice, noise, transportation, safety, right-of-way, land use, parks, and economics. As a result, any mitigation measures described in these sections also may apply to social resources and community facilities. Table Summarization of Social Facilities Impacts and Mitigation Measures Impact Direct Impacts Benefits from increased accessibility to LRT transit for transit dependent (including elderly and disabled) and general community No residential displacements No impacts to community facilities Displacement of businesses within Sections 3 and 4 Mitigation Measures See Section 3.3, Right-of-Way and Relocations, Table Indirect Impacts Possible growth in population near stations with TOD Visual and noise impacts due to presence of LRT Temporary Construction Impacts Temporary changes in local travel patterns Roadway and sidewalk alternate routes or detours and traffic congestion Visual, dust, noise, and vibration disturbance to adjacent neighborhoods Highway users may experience delays during construction Source: FasTracks I-225 Team, 2009 See Section 3.8, Visual and Aesthetic Resources See Section 3.10, Noise and Vibration Working with the stakeholders, RTD will prepare a Construction Management Plan (CMP) that specifies public communications and construction means and methods to reduce or mitigate the inconveniences of construction such as noise, dust, visual blight, construction traffic, and preservation of access to homes, businesses, and community facilities. RTD will coordinate with adjacent neighborhoods prior to and during construction activities to coordinate access. A Traffic Control Plan will be reviewed and approved by CDOT, Aurora, and Denver for mitigation of temporary construction impacts within their respective right-of-ways. See Section 3.8, Visual and Aesthetic Resources See Section 3.9, Air Quality and Energy See Section 3.10, Noise and Vibration Social Impacts, Facilities and Environmental Justice Page 3-48
55 3.4.2 Environmental Justice Environmental justice refers to social equity in sharing the benefits and burdens of specific projects or programs. Assessment of environmental justice has developed to address concerns that undesirable land uses and facilities were being placed in minority and/or low-income communities without regard to the consequences of these actions. In accordance with environmental justice principles, this section focuses on minority and lowincome populations, considers the project benefits and impacts on these populations, and evaluates whether these populations would experience disproportionately high and adverse impacts from the project Affected Environment The primary data source used to identify minority and low-income populations was the 2000 Census correlated with the Housing and Urban Development (HUD) Area Median Income (AMI) limits. Census 2000 data is the most recent data available at this neighborhood or block group level. However, site reconnaissance, public outreach, and City-wide demographic trends suggest that the 2000 Census data continues to reflect current demographic conditions. This environmental justice analysis addresses persons belonging to the following populations: Minority Black or African American, Asian American, American Indian, Alaskan Native, Native Hawaiian, Other Pacific Islander, some other race, two or more races or Hispanic or Latino (regardless of race). Low-income Low-Income means a person whose median household income is at or below HUD 30 percent AMI. For this analysis, minority populations have the potential for disproportionate effects when the minority population percentage exceeds 50 percent or is meaning fully greater than the general area. The minority population of the study area is 13,428 (44 percent), compared to 41 percent for the City of Aurora and 48 percent for the City and County of Denver (Census, 2000). Figure illustrates the minority populations within 0.5-mile of proposed stations. Of the stations, the Florida Station has the highest Black (over 1,280 residents) and Asian (over 315 residents) populations, and 13th Avenue Station has the highest Hispanic population (over 1,350 residents). Social Impacts, Facilities and Environmental Justice Page 3-49
56 Figure Minority Populations within 0.5-Mile of Stations Source: FasTracks I-225 Team, 2008; Census, 2000 Figure illustrates total minority populations at the Census block group level in Percentages of minority populations in individual block groups range from 3 to 90 percent. Of the 50 Census block groups that represent the Study Area, 20 have minority population percentages greater than 50 percent. The 30 percent AMI for Adams and Arapahoe Counties was $18,650 for a family of four based on year 2000 income limits. As it corresponds to 2000 Census household income data, this falls within the reported census range of households with incomes of $19,999 or less. This analysis indentifies a low-income population with the potential for disproportionate effects when the lowincome population is meaningfully greater than the low-income population percentage of the general population. The general population is defined as the City of Aurora, which had a lowincome population of 14 percent (Census, 2000). Over 2,390 households (or 18 percent) in the study area are considered low-income. This is higher than the City of Aurora at 14 percent, but lower than the City and County of Denver (23 percent). Figure illustrates low-income households at the Census block group level in Percentages of low-income households in individual block groups range from 0 to 43 percent. Of the 50 Census block groups that represent the study area, 27 have low-income household percentages greater than 14 percent. The highest concentrations of low-income populations (greater than 50 percent) reside between 6th Avenue and Montview Boulevard. Social Impacts, Facilities and Environmental Justice Page 3-50

57 Figure Minority Populations Source: FasTracks I-225 Team, 2008; Census, 2000 Note: Regional minority population percentages: City of Aurora (41%) and City and County of Denver (48%) Social Impacts, Facilities and Environmental Justice Page 3-51

58 Figure Low-Income Populations Source: FasTracks I-225 Team, 2008; Census, 2000 Note: Regional low-income population percentages: City of Aurora (14%) and City and County of Denver (23%) Social Impacts, Facilities and Environmental Justice Page 3-52
59 Impact Evaluation This section describes impacts of the No-Action Alternative and Preferred Alternative for each resource. The environmental justice methodology applied during this process is based on three fundamental environmental justice principals as follows: Full and fair participation of all communities is an outreach goal established in the Public Involvement Plan (as summarized in Chapter 5). Specific outreach to minority and low-income communities is discussed in the sections below. Prevent the denial of, reduction in, or delay in the receipt of benefits, based on the populations served by the proposed project and other offsetting benefits to minority or low-income populations. Avoid, minimize, or mitigate disproportionately high and adverse impact, which is defined as adverse impact predominantly borne by minority or low-income households; an impact that is appreciably more severe or greater in magnitude than non-minority or non-low-income populations; or would result in cumulative or multiple exposures to environmental hazards. No-Action Alternative The No-Action Alternative is described in detail in Chapter 2. The No-Action Alternative would not result in direct impacts to minority and low-income populations because no I-225 corridor LRT facilities would be constructed. However, the No-Action Alternative would not provide benefits to minority and low-income populations that the Preferred Alternative would provide with regard to transit options. Other transportation projects included in the No-Action transportation network may have impacts to minority and low-income populations. The impacts of these other projects have been or will be considered in the NEPA process for each of these projects, and avoidance, minimization, and/or mitigation specified, as appropriate, in the specific NEPA decision documents for each project. Indirect Impacts Under the No-Action Alternative, low-income and minority populations in the Project Study Area would not have access to an improved transit system. As a result, these individuals may not benefit from growing social and employment opportunities that will occur in the area as other reasonably foreseeable projects come to fruition. The No-Action Alternative would not provide improvements for the area s transit-dependent population, meaning these individuals would continue to walk, ride bicycles, and/or utilize the existing bus system. Lack of LRT would result in less access to the Metro Region and all of the social and economic resources it offers. Without LRT stations, or related TOD, the No-Action would not provide the economic stimuli or greater accessibility to employment centers associated with the proposed stations. Cumulative Impacts The growth of the Anschutz/Fitzsimons Medical Campus has increased redevelopment pressure to adjacent minority and low-income neighborhoods. This sustained redevelopment coupled with increases in land values may push some minority and low-income residents out of some existing neighborhoods. The No-Action Alternative may slow this redevelopment trend as it would not induce TOD, which has potential to increase land values and possibly subject Social Impacts, Facilities and Environmental Justice Page 3-53
60 low-income and minority neighborhoods to redevelopment pressure. However, the projected redevelopment growth at the Anschutz/Fitzsimons Medical Campus and throughout the Project Study Area is also anticipated to provide over 68,000 additional jobs, which would benefit minority and low-income residents. Preferred Alternative The Preferred Alternative is described in detail in Chapter 2. Outreach to and Participation of Minority and Low-Income Populations Throughout the project development process involvement of minority and low-income communities was emphasized by using targeted outreach and ensuring accessibility to diverse communities. Since Hispanic populations were the most prominent minority in the project area, specific efforts to provide information and gain input from the Hispanic community were incorporated into the public involvement process. Specific strategies to involve minority and lowincome communities included: Coordination with leaders and stakeholders in minority and low-income communities to solicit insight, assistance, and involvement. Meeting with individuals and groups in comfortable and familiar locations and at convenient times utilizing formal and informal leaders as project team hosts. Spanish translation provided at public meetings and for meeting notifications, newsletters, fact sheets, and project website. Translation services for other (non-spanish/vietnamese) languages and assistance to the hearing impaired as needed. Conducted targeted Spanish media outreach - outlets included KNRV 1150 AM, KLVZ 810 AM, Radio en Victoria, Radio Luz, and Telemundo. Worked collaboratively with the International Cross Cultural Network of Aurora (ICCNA) that utilizes bilingual and multilingual residents, representing 25 countries, to provide translators and interpreters to facilitate communication within Aurora s diverse communities. Team members, reflecting the diverse community, directly engaged minority and lowincome residents and employees when hand delivering bilingual (Spanish and Vietnamese) meeting notifications door-to-door. This method was used to engage business owners along Peoria and residents of The Meadows neighborhood. Due to this method of outreach, team members were able to identify and meet the need for a Vietnamese translator. The targeted outreach summarized in Table was used during the alternatives development process to avoid, minimize, and mitigate adverse impacts while maximizing benefits to minority and low-income residents. As of December 2008, nearly 300 community members participated in the following outreach activities designed to engage minority and lowincome communities. This proactive outreach process will continue throughout the course of the project. Social Impacts, Facilities and Environmental Justice Page 3-54
61 Table Summary of Ongoing Outreach to Minority and Low-Income Communities Date October 12, 2007 October 19, 2007 October 19, 2007 October 24, 2007 October 30, 2007 November 14, 2007 January 3, 2008 January 7, 2008 January 9, 2008 January 9, 2008 January 14, 2008 January 15, 2008 January 16, 2008 January 24, 2008 January 24, 2008 January 30, 2008 February 12, 2008 February 21, 2008 February 27, 2008 March 11, 2008 April 1, 2008 May 21, 2008 July 10, 2008 August 27, 2008 September 5, 2008 Source: FasTracks I-225 Team, 2008 Group Guatemalan Consulate Presentation Councilman Michael Hancock & Community Leaders of the African American Ministerial Alliance and Far Northeast Business Association Annual Strengthening the Neighborhoods Program Stakeholder Meeting No.1 Iglesia Apostolica - Pastor Gilberto Juarez Mexican, Peruvian, Guatemalan & Costa Rican Consulates Pastor Adan Aguirre of Impacto de Fe Latino Ministerial Alianza of Denver at Confluence Ministries US Christian Chamber of Commerce Group of Denver Gilberto Guerra, Adminsitrator of Impacto de Fe Pastor Cesar Rodriguez, El Renuevo Church Impacto de Fe business Group Radio La Buena Onda Hispanic Group of the US Christian Chamber of Commerce Confianza Latino Group (Metro Denver Latino Leaders) Don Bain and Staff at La Voz Newspaper Carmel Partners Timberwood Apartments (Copper Flats) Far Northeast Business Association East Corridor-Peoria Station Neighborhood Meeting (Morris Heights) Hoffman Heights & Jewell Heights Neighborhood Meeting City Center Businesses Meeting Peoria Businesses Meeting Colfax Business Meeting Chambers Heights Neighborhood Association Sable Blvd. Apartment Owners Topaz I & II and Promanade While minority and low-income stakeholders identified many of the same issues as non-minority and non-low-income stakeholders; topics and issues expressed specifically during outreach with low-income and minority populations included: Concern for opening up opportunities to minority business owners at stations with TOD Desire for FasTracks to create future job opportunities for low-income and minority residents Desire for training and educational opportunities Social Impacts, Facilities and Environmental Justice Page 3-55
62 Request for RTD to translate employment opportunities into Spanish Latino residents in northern Aurora anxiously awaiting Opening Day Concern for impacts to businesses during construction A need for language diversity in messaging after line is built Interest in presence of security cameras at platforms Fear that security officers on trains will check for identification Benefits to Minority and Low-Income Populations As shown in Figures and 3.4.8, there is a high percentage of minority and low-income populations within the 0.5-mile of proposed stations. These populations would benefit from the enhanced transit system provided by the Preferred Alternative, along with the general population. Each station would provide better mobility and would enhance connectivity to the existing and planned RTD transit system in the Metro Region, which would benefit minority and low-income populations. Table summarizes minority and low-income, populations in Census block groups within 0.5-mile of each station who would directly benefit from improved transit access. Table Minority and Low-Income Populations Served within 0.5-Mile of Station 2000 Minority 2000 Low-Income Station Population Percent Households Percent Iliff % % Florida 2,684 46% % City Center 2,025 56% % 2nd/Abilene 1,419 52% % 13th Avenue 2,478 57% % Colfax 2,163 57% % Montview % 63 19% Peoria/Smith % 5 11% Total Served within 0.5-mile of Stations 12, , Source: Census 2000, FasTracks I-225 Team, Minority population does not include group quarters populations All populations, including minority and low-income populations, who are transit dependent and/or not do have access to a private vehicle would gain the most direct benefit from the Preferred Alternative. Within 0.5-mile of stations, approximately 1,000 household (nine percent) are considered no car households. Figure summarizes commuter modes within 0.5-mile of stations. Social Impacts, Facilities and Environmental Justice Page 3-56
63 Figure Commuter Modes within 0.5-Mile of Station Source: FasTracks I-225 Team, 2008; Census, 2000 Additionally, major community facilities that serve minority and low-income populations throughout the region are located within 0.5-mile of stations and would have improved access from the Preferred Alternative (Table 3.4.5). The Preferred Alternative would provide transit access to major medical and social service providers along the corridor. Table Local and Regional Community Facilities serving Minority and Low- Income Residents Station Iliff Florida City Center 2nd/Abilene 13th Avenue Colfax Montview Peoria/Smith Source: FasTracks I-225 Team, 2008 Community Facility Post Office (Gateway Station), churches Medical Center of Aurora (south), churches Aurora Municipal Center, Aurora Public Library, Arapahoe County Center, day cares Sixth Avenue Elementary, Columbia College, Anthem College, Regis University, Driver s License Office Medical Center of Aurora (north), church Children s Hospital, church Children s Hospital, University of Colorado Hospital Adams County Service Center for Social Services Minority and low-income populations and the general population would benefit equally from the new jobs created to build, maintain and operate the Preferred Alternative. Additionally, minority and low-income populations near proposed stations also would benefit from faster and more Social Impacts, Facilities and Environmental Justice Page 3-57
64 convenient transit access to employment opportunities and services throughout the Metro Region. The Preferred Alternative would have access for pedestrian, bicycle and bus connections at the stations, which would also benefit transit dependent populations. Access to transit facilities would be American with Disabilities Act (ADA) compliant, will include bike storage opportunity, and will be connected to adjacent to sidewalks and trails. Several stations would include enhanced sidewalks. The implementation of the Preferred Alternative may also benefit community cohesion by creating a community gathering point or a sense of place within minority and low-income neighborhoods. Potential for Disproportionate Impacts to Minority and Low-Income Populations The alternative development process included specific outreach to minority and low-income residents and efforts to avoid and minimize adverse impacts to these communities. Outreach opportunities are summarized in Table and minimization measures are discussed in Section The majority of the Preferred Alternative would be located in areas with concentrations of both minority and low-income populations. Table summarizes the potential for disproportionately high and adverse direct and indirect effects on minority and lowincome populations. Temporary Construction Impacts Residences within 300 feet of the project footprint would be most affected by temporary construction impacts; this includes approximately 2,800 minority residents and 528 low-income households. Throughout the study area, community impacts to minority and low-income residents would be similar in nature to those experienced by the general population and include visual changes, and temporary construction impacts (dust, traffic congestion, noise, and visual changes). Cumulative Impacts Additional transportation access associated with the Preferred Alternative and other reasonably foreseeable future actions would provide greater connectivity and regional employment access. Major planned developments and TOD at station locations would result in additional employment opportunities within existing neighborhoods. Although induced effects of TOD on land value and rents are not readily quantifiable, anecdotal evidence suggests that rents may increase as a result of TOD. While increases in residential property values are likely to represent a beneficial impact for property owners, they are also likely to result in an adverse impact on low-income renters if rents increase. Overall, the Preferred Alternative coupled with other local actions would provide better and more convenient travel options and employment opportunities for minority and low-income populations. Conclusion This benefits and burdens analysis shows that the implementation of the Preferred Alternative would not result in disproportionately high and adverse effects on minority and low-income populations. Approximately 12,000 minority residents, 1,900 low-income households, and 1,000 no-car households would directly benefit from increased access to rail transit in the Metro Region. While minority and low-income communities would experience the displacement of jobs and businesses, it is anticipated that this will be offset by new employment opportunities Social Impacts, Facilities and Environmental Justice Page 3-58
65 including: temporary construction jobs, permanent employment for the maintenance and operation of the new transit system, and indirect employment growth related to TOD. Table Impacts Analysis Land Use Resource Economic Considerations Right-of-Way and Relocations Social Impacts and Community Facilities Potential for Impacts None Yes Yes None Discussion of Impacts The Preferred Alternative would be compatible with zoning and land use plans. The effects would not exceed those of the general population. The Preferred Alternative would result in the displacement of businesses providing over 60 jobs within minority or low-income communities. These businesses may relocate in the area, or a more distant area, or may close depending on business owner decisions. The loss of some jobs is anticipated to be offset by new job opportunities created during construction, maintenance, and operation of the Preferred Alternative as well as additional employment opportunities associated with TOD. Impacts to property tax revenues are relatively small and would not exceed those of the general population. Low-income communities would be most sensitive to increased property values due to redevelopment pressure. In addition, neighborhoods and businesses in the areas of the 13th Avenue, Colfax, and Peoria/Smith Station would likely experience redevelopment pressure. The Preferred Alternative would displace 18 businesses within minority or low-income communities. Two business displacements would occur at the Colfax Station area; however, neither business is minority owned and/or predominantly serves minority or lowincome clientele as confirmed during the public involvement process. The remaining business displacements would occur on the west side of Peoria between Sand Creek and Smith Road. These businesses are minority owned and/or serve minority clientele as confirmed during observations during business hours. These businesses may relocate in the area, or a more distant area, or may close depending on business owner decisions. The Preferred Alternative would not bisect or displace any community facilities or minority or low-income neighborhoods. Approximately 12,000 minority and 1,900 low-income households and 1,000 no-car households would directly benefit from increased access to rail transit providing access to employment Social Impacts, Facilities and Environmental Justice Page 3-59
66 Resource Cultural Resources Parks, Recreational Facilities, and Open Space Public Safety and Security Visual and Aesthetic Resources Air Quality and Energy Noise and Vibration Electro-magnetic Fields/Electro-magnetic Interference Biological Resources Potential for Impacts None None None None None None None None Discussion of Impacts opportunities and services throughout the Metro Region. Community cohesion of all neighborhoods would benefit due to greater transit access and added sense of place. Potential direct and indirect impacts to Fitzsimons Army Medical Center Historic District would not adversely affect minority or low-income populations. The Anschutz/Fitzsimons Medical Campus is currently being redeveloped and there are no existing residences or neighborhoods to be affected. The Preferred Alternative would directly affect trails and parks and open space resources, but would not permanently change the function or use of these resources. The Preferred Alternative would also result in temporary construction impacts to trails and parks and open space resources. These impacts would be experienced at similar levels between minority and low-income communities and the general population. Safety and security issues at stations generally correlate to the current crime trends in the surrounding neighborhoods and are not impacted by transit projects. The effects would not exceed those of the general population. Visual impacts would be related to retaining walls, structures, stations, and other build elements of the project. These elements would be dispersed throughout the project area. Therefore, the effects would not exceed those of the general population. The air quality and energy analysis did not identify any adverse impacts. The effects would not exceed those of the general population. Potential noise and vibration impacts would occur to receptors within the Anschutz/Fitzsimons Medical Campus. This area is currently being redeveloped and there are no existing residences or neighborhoods to be affected. Potential EMF/EMI impacts would occur to receptors within the Anschutz/Fitzsimons Medical Campus. This area is currently being redeveloped and there are no existing residences or neighborhoods to be affected. Implementation of the Preferred Alternative would result in the loss of some habitat. Noxious weeds control would be implemented throughout the project. The effects would not exceed those of the general population. Social Impacts, Facilities and Environmental Justice Page 3-60
67 Resource Mineral Resources/Geology/Soils Paleontology Hazardous Materials Utilities Water Resources Floodplains Wetlands/Waters of the US Potential for Impacts None None None None None None None Source: FasTracks I-225 Team, 2008 Discussion of Impacts The construction of the Preferred Alternative would have the potential to affected slope stability; erosion and aggradation; and the potential loss of opportunity to extract mineral resources. These effects are anticipated to be minimized or mitigated during construction and would not exceed those of the general population. Paleontological resource impacts will be avoided. The effects would not exceed those of the general population. Hazardous materials would be impacted as a result of the Preferred Alternative. Any effects would not exceed those on the general population and appropriate safety measures would be used to protect bystanders. Utilities would be relocated or protected in place throughout the project area. Therefore, impacts would be similar regardless of population characteristics. The Preferred Alternative would result in additional impervious surfaces but is not anticipated to exceed water quality standards. The effects would not exceed those of the general population. The Preferred Alternative would result in additional impervious surfaces and slight increases to surface water elevations. The effects would not exceed those of the general population. The Preferred Alternative would result in impacts to wetlands and waters of the US. The effects would not exceed those of the general population Mitigation Measures Minimization efforts were identified during Preferred Alternative development to avoid or minimize disproportionate impacts to minority and low-income populations as discussed below. Mitigation measures for impacts that could not be avoided are discussed in Table Avoidance and Minimization Measures During a minimization meeting held December 15, 2008, potential measures to avoid and minimize impacts to minority and low-income populations in Sections 3 and 4 were evaluated. Along 13th Avenue, it was committed to maintain driveways and parking on both sides of 13th Avenue through The Meadows neighborhood. As illustrated in Appendix A, the Preferred Alternative alignment is west running along Peoria Street. Although the Peoria Street LRT alignment results in 16 potential business displacements, that alignment was sited based on consistency with local plans and on avoidance of Aurora s Fire Station No. 3, the Greater Wayside Church of God in Christ (minority community facility), the Morris Heights Neighborhood (with a minority population greater than 50 percent of the total population), and other environmental resources. While 16 businesses were identified as displacements along Peoria Street, the project team was able to avoid over 15 Social Impacts, Facilities and Environmental Justice Page 3-61
68 additional displacements, some of which predominantly serve minority clientele and/or are minority owned based on business hour observations. Mitigation Measures As discussed in Section 3.3, the acquisition of real property interests will comply fully with the Uniform Relocation Assistance and Real Property Acquisition Policies Act of 1970, as amended (Uniform Act) and the Fifth Amendment of the United States Constitution. The relocation process will include relocation analysis, relocation assistance advisory services, and relocation payments. A complete survey of business owners and employees will be conducted as part of the process. One of the goals of this process would include the successful relocation within the same community. Relocation resources are available to all residential and business relocatees without discrimination. Table summarizes impacts and mitigation measures for the Preferred Alternative. Table Summarization of Environmental Justice Impacts and Mitigation Measures Impacts Direct Impacts Improved accessibility to LRT transit for minority and low-income populations and the general community Job losses are anticipated to be offset by new direct, indirect, and temporary job opportunities Indirect Impacts Employment and land use changes near stations with TOD Visual and noise impacts due to presence of LRT Temporary Construction Impacts Minority and low-income residents within 300 feet would experience similar visual changes, dust, traffic congestion, noise and vibration, and as the general population. Source: FasTracks I-225 Team, 2009 Mitigation Measures See Section 3.3, Right-of-Way and Relocations, Table As the preliminary design is further refined, meetings will be held with impacted business owners and RTD right-of-way staff, engineers, and translators (if required). These meetings will allow for full disclosure of the Preferred Alternative alignment and provide opportunity for business owners to ask questions and to understand impacts specific to their establishment. See Section 3.8, Visual and Aesthetic Resources See Section 3.10, Noise and Vibration See Section 3.8, Visual and Aesthetic Resources See Section 3.9, Air Quality and Energy See Section 3.10, Noise and Vibration Continue coordination with minority and lowincome communities to develop construction management plan. Social Impacts, Facilities and Environmental Justice Page 3-62
69 3.5 Cultural Resources (Historic and Archaeological Resources) The I-225 FasTracks project is not required to formally evaluate the effects of the proposed undertaking on historic properties under Section 106 of the National Historic Preservation Act (NHPA) and implementing regulations (36 CFR 800), given that the project does not require a federal action nor is there federal funding for the project. However, historic and archaeologic resources are valuable community resources and must be considered in an impact analysis. This evaluation includes resources already listed on the National and State Registers of Historic Places (NRHP), and those that may be potentially eligible to be listed on the Registers. Research, survey and evaluation of cultural resources (historic and archaeological resources) were conducted for both the No-Action Alternative and the Preferred Alternative. Paleontological resources are discussed in Section Historic resources are buildings, structures, districts (groups of buildings or structures), sites and objects meeting the minimum age criterion of 45 years. Typically 50 years is used as an age threshold; however, a 45-year threshold is often applied in transportation projects to account for the lengthy process often required to complete these projects. Archaeological sites include ruins and remains associated with a wide variety of historical contexts, including settlement, agriculture, mining, transportation, military, and industrial enterprises. Archaeological resources are the physical traces of past human activity and may be either associated with prehistoric Native Americans or later historic non-indigenous peoples (e.g., Euroamericans, Asian emigrants and transplanted Africans). Prehistoric archaeological sites in the plains of Colorado may include surface scatters of lithic artifacts, remnants of hearths, stone circles/tipi rings, bison kill/processing sites, rock art, lithic material quarries, rockshelters, and (rarely) human burials. Analysis began by defining a study area that considered all potential impacts to cultural resources. A file review of previous surveys conducted for cultural resources, and a field survey was completed in order to determine the presence and significance of cultural resources. The following elements are considered when evaluating the presence of and assessing impacts to cultural resources in the study area: Significance in American History Association with historic figures or events Elements that are characteristic of a certain period of time Elements that contain important information about history A file search for the project was completed on April 23, 2008, in order to identify previously recorded historic and archaeological resources. Five previous cultural resource investigations have been completed in the project vicinity. These earlier surveys included inventories of the following four properties: Fitzsimons Army Medical Center completed by Powers Elevation Company Inc. (Tate, 1990) and Front Range Research Associates (Simmons, 1991), A corridor survey along I-225 for the proposed Adesta Communications fiber optic system by Centennial Archaeology (Sherman et al., 1999), Cultural Resources (Historic and Archaeological Resources) Page 3-63
70 A corridor survey for the planned Fitzsimons (Sand Creek) Parkway (McDonald, 2003), and A cultural resources inventory for the Interstate 225 (I-225) /Colfax Avenue Interchange (Marmor, 2004). Reconnaissance windshield surveys of the study area were completed in April and May 2008, to identify potentially historic resources and areas that would require a pedestrian archaeological survey. In addition, Adams and Arapahoe County Assessor s online property records were reviewed to determine dates of construction for buildings and structures identified as potentially historic. Properties with buildings erected in or before 1963 were evaluated for historic resources. Properties meeting this minimum age threshold were recorded onto CHS cultural resource inventory forms and considered in this impact assessment. An intensive-level survey of potentially historic buildings was conducted in January and February Pedestrian surveys of areas to identify potentially archaeological resources were conducted on February 5, Affected Environment The study area encompasses a portion of I-225 and traverses portions of the City of Aurora and the Fitzsimons Redevelopment Area. Previously recorded sites within the study area include the High Line Canal (5AH.388) and the Fitzsimons Army Medical Center Historic District (5AM.123). No new historical or archaeological resources were identified within the study area. Please note cultural resources which are determined to be eligible or potentially eligible for the NRHP are assigned numbers to track survey findings. A single previously unrecorded cultural resource was discovered within the study area during the survey. The archaeological find (5AH3028) is a multi-component historical dump/prehistoric artifact scatter situated on an alluvial terrace above Toll Gate Creek. The dense scatter of highly fragmented historical artifacts represents use of the dump between the early 20th century (pre.1920) and the 1950s/1960s. A residential house was located at 2800 Peoria Street (5AM.366). An inventory form was completed for this property in Additional research indicated that the house was demolished between 2000 and 2002, and no remnants remain of the structure. No further information was available on the house from either the Aurora Historic Sites and Preservation Office, or from assessor records Historic Properties Two historical resources, the High Line Canal (5AH.388) and the Fitzsimons Army Medical Center Historic District (5AM.123), were determined eligible for or are already listed on the NRHP, as shown in Table An intensive level survey was conducted for these two historic properties. Cultural Resources (Historic and Archaeological Resources) Page 3-64
; Destroyed/ total disturbance 5AH.388 High Line Canal Officially Eligible (1/24/2000) 5AH.388.5 High Line Canal segment Field Not Eligible (1/10/2000) 5AH.")
71 Table Historic Resources within the Study Area Site No. Identification NRHP-Eligibility 5AH.207 Smoky Hill Trail Northern Branch Field Not Eligible (11/12/1982); Destroyed/ total disturbance 5AH.388 High Line Canal Officially Eligible (1/24/2000) 5AH High Line Canal segment Field Not Eligible (1/10/2000) 5AH High Line Canal segment Field Not Eligible (5/12/2003) 5AM.1751 House 1640 Potomac Street Officially Not Eligible (2/9/2005) 5AM.1752 House 1851 Potomac Street Officially Not Eligible (2/4/2005) 5AM.1753 House 1861 Potomac Street Officially Not Eligible (2/4/2005) Vaughn Residence Evergreen 5AM.1754 Avenue Officially Not Eligible (2/4/2005) 5AM.1755 Hover Residence 1791 Wilderman Place Officially Not Eligible (2/4/2005) Villanueva-Zitalpopcati Residence AM.1756 Wilderman Place Officially Not Eligible (2/4/2005) Flores Residence 1731 Wilderman 5AM.1757 Place Officially Not Eligible (2/4/2005) 5AM.1758 Costillo Residence th Avenue Officially Not Eligible (2/4/2005) 5AM.1759 Saignaphone Residence th Avenue Officially Not Eligible (2/4/2005) Fitzsimons Army Medical Center National 5AM Register Eligible District Officially Eligible (7/2/1991) 5AM Peoria Street, Aurora Field Not Eligible (7/1/1985), buildings 5AM.1544 University of Colorado Health Sciences Center and Hospital at Fitzsimons Source: FasTracks I-225 Team, 2009 destroyed per field survey August 2009 Unevaluated, due to past SHPO approved documentation (US Army, Colorado SHPO, and Advisory council on Historic Preservation, 1998) High Line Canal (5AH.388) The canal segment originally extended from the I-225 right-of-way on the east to Potomac Street on the west. When re-evaluated for the I-225 FasTracks light rail project, Segment 5AH was extended in length eastward to include a stretch of open canal on the east side of I-225 all the way to Sable Boulevard. The High Line Canal is conveyed beneath I-225 via a concrete box culvert, and on the east side of the highway the culvert extends underneath Abilene Street. The earthen canal channel varies in size but is approximately 60 feet wide at the top, 20 feet wide at the bottom, and is approximately 10 feet deep. The canal banks are covered with a typical mix of plains and riparian vegetation, including bunch grasses and cottonwood trees. The concretepaved High Line Canal [bike] Trail closely parallels the north bank of the canal. Cultural Resources (Historic and Archaeological Resources) Page 3-65

72 The portion of the canal segment on the west side of I-225 is approximately 350 feet long and follows a relatively straight east-west trajectory. This short segment is surrounded by low density commercial development. It is flanked on the south by an auto repair facility, and on the north by a mortuary. The portion of the canal segment on the east side of I-225, between Abilene Street and Sable Boulevard, is approximately 1,750 feet (0.33 mile) long, and follows a serpentine course as it follows an elevation contour across a broad low ridge. Here, the High Line Canal passes a modern low rise brick office building, beyond which is a number of apartment or condominium complexes (some under construction in April of 2008). The only water control feature noted along the segment was a modern, standard-design water gate located on the north bank of the canal approximately feet east of the Abilene Street box culvert. This water gate allows water to flow into a poorly defined, vegetation-choked channel or swale in an undeveloped parcel north of the bike trail. Although the canal appears to retain integrity of location and design, the agricultural setting surrounding the segment has been altered by modern development. This early and extremely long irrigation canal was determined to be eligible for the NRHP in In the same year, Segment 5AH was evaluated as non-contributing to the eligibility of the entire linear resource due to diminished integrity. A longer segment was re-defined in 2008 for the I-225 LRT project and is re-evaluated as affirmatively supporting the eligibility of the entire linear site, since despite ongoing urban development, it retains elements to convey its association with historic agriculture practice in the greater Denver area. The previously recorded High Line Canal segment crossing I-225 (5AH.388.5) was re-evaluated and a site form prepared. As a result, the segment was extended in length from Potomac Street on the west to Sable Boulevard on the east. The open portions of the canal on both the east and west sides of I-225 were evaluated as supporting the eligibility of the entire linear resource. Fitzsimons Army Medical Center Historic District (5AM.123) The 595 acre Fitzsimons Army Medical Center opened in 1918 on the former site of the Gutheil Tree Nursery and for nearly 80 years served as a full-service hospital for U.S. Army personnel. More than 160 buildings and structures were erected on the property over the years, the centerpiece of which was the monumental ten-story masonry Main Building, erected in The medical center property was inventoried for historic resources in 1991 resulting in the delineation of a historic district designated 5AM.123. This district was determined to be officially eligible for inclusion on the NRHP. Cultural Resources (Historic and Archaeological Resources) Page 3-66
, and the Advisory Council on Historic Preservation (ACHP), identified specific military buildings selected for preservation and prescribed")
, the Army, the University of Colorado and the City of Aurora have resulted in planned preservation and re-use of eight")
73 After the permanent closure of the Fitzsimons Army Medical Center in the 1990s, a Programmatic Agreement (PA) executed in 1998 between the U.S. Army, the State Historic Preservation Office (SHPO), and the Advisory Council on Historic Preservation (ACHP), identified specific military buildings selected for preservation and prescribed mitigation measures for many others in the historic district slated for removal. Subsequent negotiations between the Fitzsimons Redevelopment Authority (FRA), the Army, the University of Colorado and the City of Aurora have resulted in planned preservation and re-use of eight historic elements of the former Fitzsimons Army Medical Center: 1. Administration Building 2. Peoria and Colfax Gatehouses 3. Commander s House/Gutheil Residence 4. Colonel s Row 5. Post Chapel 6. Red Cross Building 7. Waterfowl Preserve and General s Park 8. Post Theatre Two of these surviving resources occur within the study area, including the Red Cross Building and the Post Chapel, both of which are located along Montview Avenue. In 1999, the Red Cross Building, built in 1918, was established as a historic landmark within the City of Aurora. Redevelopment of the former Fitzsimons Army Medical Center by the Fitzsimons Redevelopment Authority has resulted in diminishment of the integrity of the historic district such that it would no longer qualify for the NRHP; however, the eight elements to be preserved, including the Red Cross Building and Post Chapel, retain sufficient integrity and historical importance to qualify as eligible for the NRHP. No new documentation was completed of historic properties within the Fitzsimons Army Medical Center Historic District. The district has been fully and extensively documented in the past and the preservation of a selected few structures was prescribed by a Programmatic Agreement (U.S. Army, Colorado SHPO, and Advisory Council on Historic Preservation [ACHP],1998) implemented by the Fitzsimons Redevelopment Authority, which is converting the former Army facility into a modern, multi-tenant regional civilian medical center. Cultural Resources (Historic and Archaeological Resources) Page 3-67
74 Archaeological Resources Archaeological resources located within the study area are shown in Table Table Archaeological Resources within the Study Area Site No. Identification NRHP-Eligibility 5AH.3028 Multicomponent historical dump/prehistoric artifact scatter Recommended Not Eligible 5AH.32 Isolated Find (worked camel bone) Officially Not Eligible* 5AH.283 Isolated Find (lithic debitage) Officially Not Eligible* (1/1/1985 ) 5AH.1015 Isolated Find Officially Not Eligible* (11/14/1996) 5AM.26 Open Camp N/A ( Destroyed/ total disturbance ) 5AM.987 Isolated Find Officially Not Eligible* (11/13/1996) 5AM.626 Open camp, historic, defense Officially Not Eligible (1/25/1991) Source: FasTracks I-225 Team, 2009 * By definition, Isolated Finds are officially Not Eligible for the NRHP Impact Evaluation This section describes the impacts of the No-Action Alternative and Preferred Alternative for each resource No-Action Alternative The No-Action Alternative is described in detail in Chapter 2. The No-Action Alternative would not result in direct impacts to cultural resources because no I-225 corridor LRT facilities would be constructed. Other transportation projects included in the No-Action transportation network may have impacts to cultural resources. The impacts of these other projects have been or will be considered in the NEPA process for each of these projects, and avoidance, minimization, and/or mitigation specified, as appropriate, in the specific NEPA decision documents for each project. Indirect Impacts No indirect impacts are expected under the No-Action Alternative. Cumulative Impacts Future projects included in the No-Action Alternative may result in cumulative impacts and effects to cultural resources. Projects encompassed in the jurisdiction of NEPA, NHPA, and the Archaeological and Historic Preservation Act would be subject to requirements of identifying potential cultural resources, surveying resources, determining eligibility, and evaluating potential effects of alternatives. The analyses for these future projects are unique and separate from this EE, and their impacts have been or will be addressed in environmental documents prepared for those projects. Cultural Resources (Historic and Archaeological Resources) Page 3-68
75 Reasonably foreseeable future developments in the Project Study Area are not necessarily subject to these same cultural resources requirements. Redevelopment of the Anschutz/Fitzsimons Medical Campus is addressed in a Programmatic Agreement for the Closure and Disposal of US Army Garrison, Fitzsimons. The agreement was signed in March, 1998 among the US Army, the Colorado SHPO, and the Advisory Council on Historic Preservation Preferred Alternative The Preferred Alternative is described in detail in Chapter 2. Impacts by section are discussed below. The analysis has been conducted and is commensurate with a no adverse effects resulting from implementation of the Preferred Alternative. Section 1 Nine Mile to Exposition No historic or archaeological resources would be impacted in this section, which includes the Iliff Station and Florida Station. Section 2 City Center No historic or archaeological resources would be impacted in this section, which includes the City Center Station. Section 3 Ellsworth to Fitzsimons/Montview One historic resource would be impacted in this section. The I-225 LRT project would impact the High Line Canal (5AH.388) by extending the box culvert from I-225 to the east and by relocating the sidewalk conveying the High Line Canal Trail north along Abilene Street approximately 50 feet east onto the Abilene Corporate Center property. A crossing of the LRT tracks would be provided, tying into the existing crossing of Abilene at 2nd Avenue (Figure 3.5.1). This will provide a safe and convenient route linking the portion of the High Line Canal Trail located east of Abilene Street with the crosswalk conveying the trail across Abilene Street at 2nd Avenue. Extension of the box culvert along the High Line Canal is not anticipated to impair the historic integrity of the canal. Section 4 Fitzsimons/Montview to Peoria/Smith This section includes the impacts to the former Fitzsimons Army Medical Center Historic District resources. Due to redevelopment of the former Fitzsimons Army Medical Center by the Fitzsimons Redevelopment Authority, the integrity of the historic district (5AM.123) has been diminished such that it would no longer qualify for the NRHP. Two historic elements, the Red Cross Building and the Post Chapel, retain sufficient integrity and historical importance to qualify for the NRHP under Criterion A. The Red Cross Building and the Post Chapel are located adjacent to the Preferred Alternative on the south side and north side of Montview Boulevard respectively. Neither of these buildings will be impacted by the Preferred Alternative; therefore, the integrity of these elements would not be diminished. The redevelopment project resulted in the execution of a Programmatic Agreement between the U.S. Army, Colorado SHPO, and ACHP (1998) that preserves selected buildings and features and provides mitigation for the remaining buildings and features. Procedures identified in the Programmatic Agreement have been implemented the Fitzsimons Redevelopment Authority. Cultural Resources (Historic and Archaeological Resources) Page 3-69

76 Figure High Line Canal Source: FasTracks I-225 Team, 2009 Cultural Resources (Historic and Archaeological Resources) Page 3-70
77 The Preferred Alternative alignment within this section would be constructed within the north side of the Montview Boulevard roadway envelope. Montview Boulevard is anticipated to be reconstructed south of its current location prior to the construction of the LRT. In order to accommodate the reconstruction of Montview Boulevard and the LRT access to the Post Chapel may need to be reconfigured. Indirect Impacts Indirect visual impacts may occur due to the introduction of catenary systems within the Fitzsimons Army Medical Center; however, because the integrity of the historic district has been diminished it is expected that this not adversely affect the area. Temporary Construction Impacts Although no archaeological resources or undisturbed areas requiring pre-construction archaeological surveys were identified, the possibility exists that buried archaeological materials may be unearthed during construction. Cultural resource properties within the study area could be subject to temporary impacts due to the noise, air quality, visual, and traffic-diverting effects of construction. These impacts would be temporary in nature and would not result in temporary adverse effects to the resources. Cumulative Impacts There are no known cumulative impacts to cultural resources from the Preferred Alternative. As noted, past and reasonably foreseeable future projects may be subjected to separate analysis Mitigation Measures Table summarizes impacts and mitigation measures with implementation of the Preferred Alternative. Table Summarization of Cultural Resource Impacts and Mitigation Measures Impacts Direct Impacts Extension of the High Line Canal (5AH.388) box culvert Landscaping impacts in the Fitzsimons Army Medical Center Historic district (5AM.123) Indirect Impacts Minor visual impacts within Fitzsimons Army Center Historic district (5AM.123) from catenary lines Temporary Construction Impacts Traffic diverting effects Visual, air, and noise Potential for archaeological remains to be encountered during construction Source: FasTracks I-225 Team, 2009 Mitigation Measures No mitigation measures for High Line Canal due to preservation of historic integrity No mitigation measures required No mitigation required See Chapter 4, Transportation Systems for mitigation measures See Chapter 3, Section 3.8, 3.9, and 3.10 respectively for mitigation measures If archaeological remains are encountered during construction, work will stop until remains are identified by a professional archaeologist and appropriate mitigation measures are developed Cultural Resources (Historic and Archaeological Resources) Page 3-71
78 3.6 Parks, Recreational Facilities, and Open Space The section identifies potential direct and indirect park impacts resulting from the Preferred Alternative and the No-Action Alternative. Figures through show the 300-foot buffer utilized to capture potential direct and temporary impacts Affected Environment Parks and recreational resources located throughout the community are owned and maintained by the following jurisdictions or entities: City of Aurora, Denver Water, City and County of Denver, Adams County, Park Creek Metropolitan District, and the Fitzsimons Redevelopment Authority. A review of adopted plans by each of these entities helped identify existing and planned parks, recreational, and open space facilities within the parks and recreation study area (City of Aurora, 2007a; City of Aurora, 2007b; CCD, 2000; CCD, 2003; CCD, 2005a; CCD, 2005b; Fitzsimons Redevelopment Authority, 2007). Details and characteristics of parks and recreational resources are described in Table and are depicted in Figures through Parks and recreational facilities for public usage are accessible by automobile, bicycle, and foot. The proposed trail through Aurora City Center and trail extensions to the Toll Gate Creek and Sand Creek Trails are conceptual, which means the trail alignment and design is subject to change. Trail connectors are considered small trails or sidewalks that provide connection between two major trails and are also discussed in Table Parks, Recreational Facilities, and Open Space Page 3-72
79 Table Parks and Recreational Resources within the Study Area Map Label Resource ID Name Nine Mile to Exposition Unnamed trail connector located between Westerly Creek T-1 Trail and Cherry Creek Trail T-2 City Center P-1 Unnamed trail connector along Yale Avenue Aurora Market Park Description & Location Size in Acres Multipurpose local trail Separated sidewalk and signed bike route on Ursula. Trail runs parallel to I-225 north of Parker Road and crosses under I- 225 south of Parker Road. NA Multipurpose local trail Sidewalk runs along Yale Avenue and spans I-225 with the Yale Avenue bridge. Park Aurora Market Park located west of Sable Boulevard and south of Exposition Avenue. Special use including amphitheater and trails NA 2.3 Owner City of Aurora City of Aurora City of Aurora Relationship to other Recreational Resources This trail serves as a connection between the Westerly Creek Trail to the north and the Cherry Creek Greenway Trail to the south. Westerly Creek and Cherry Creek Greenway Trails connect to Utah Park and Cherry Creek State Park respectively. The trail connects to an existing bike lane to the east and Westerly Creek Greenway Trail to the west. The park and trail network do not connect to any other existing recreational facilities. T-3 T-4 T-5 Aurora Market Park Trail Network Unnamed trail connector proposed from S. Sable Boulevard to E. Alameda Avenue Sable Bike Lane Multipurpose local trail Paved trail within Aurora Market Park This trail extends on sidewalk north and south of Aurora Market Park Proposed multipurpose local trail connector This proposed trail would connect existing sidewalk on Sable Boulevard through the planned Aurora City Center development to connect with sidewalks at E. Alameda Avenue and E. Alameda Drive. Bike Lane Bike lane along Sable from Exposition to High Line Canal Trail NA NA NA City of Aurora Proposed by City of Aurora City of Aurora This trail network does not connect to any other existing recreational facilities. The trail network would not connect to any other existing or proposed trails or recreational facilities. Provides north south bicycle connectivity to High Line Canal Trail. Parks, Recreational Facilities, and Open Space Page 3-73
80 Map Label ID Resource Name Description & Location Ellsworth to Fitzsimons/Montview T-6 T-7 T-8 T-9 High Line Canal Trail and Greenway 6th Avenue Trail Toll Gate Creek Greenway Trail (existing and proposed) 13th Avenue Trail Multipurpose regional trail Paved trail parallel the High Line Canal and sidewalk and shoulder bicycle route along Abilene Street and 2nd Avenue This trail crosses under I-225 along 2nd Avenue Multipurpose local trail This separated sidewalk crosses under I-225 at 6th Avenue. Multipurpose regional trail Existing location north of Montview Boulevard. Proposed north south connections in conjunction with Aurora s sewer interceptor development. Multipurpose local trail Signed bicycle route along 13 th Avenue from Sable Boulevard to the western edge of city limits Multipurpose bridge and trail over Toll Gate Creek under I-225 Montview to Peoria/Smith Municipal Fitzsimons golf course This resource will eventually be incorporated into the Colorado Science and Technology Park at Fitzsimons Golf Fitzsimons. (City of Aurora, 2003). G-1 Course The golf course closure date is unknown. Fitzsimons Golf Course is located at Peoria Street and Fitzsimons Parkway. OS-1 Park Creek Open Space Open space This open space facility is a designated prairie dog habitat and is open to the public. It is not maintained and is used for open recreational activities. This resource is located west of Peoria Street and north of Fitzsimons Parkway. Size in Acres NA NA NA NA Owner Owned by Denver Water, Managed by City of Aurora City of Aurora City of Aurora City of Aurora Owned by Fitzsimons Redevelopment Authority and managed by City of Aurora Park Creek Metro District Relationship to other Recreational Resources This trail connects to High Line Ballfields, Aurora Hills Golf Course, City Center park, Delaney Farm, and Toll Gate Creek Greenway Trail. This trail connects to Del Mar Park and Toll Gate Creek Greenway Trail. This trail will connect to High Line Canal Trail and Sand Creek Greenway Trail. This trail connects Freedom Park and Jewell Park Adjacent to Sand Creek Park and Sand Creek Greenway Trail. Adjacent to Sand Creek Park, Sand Creek Greenway Trail and Bluff Lake. Parks, Recreational Facilities, and Open Space Page 3-74
81 Map Label ID P-2 T-10 Resource Name Sand Creek Park Sand Creek Greenway and Trail (existing and proposed) Description & Location Park along Sand Creek Classified as a large urban park with multiple uses including nature preserve. Located east of Peoria Street and north of Fitzsimons Parkway. Located within/adjacent to the Sand Creek Greenway and Greenway Trail. Greenway and multiuse regional trail The existing trail is located north of Fitzsimons Parkway and east and west of Peoria Street. Proposed extension is across Park Creek Open Space from the existing Sand Creek Greenway trail to the future Martin Luther King Drive. Equestrian uses permitted which requires at least 10 of clearance. Size in Acres 86 NA Owner City of Aurora City of Aurora/ Park Creek Metro District Relationship to other Recreational Resources Access to Sand Creek Greenway. This park is adjacent to Fitzsimons Golf Course and Park Creek Open Space. This trail connects to Sand Creek Park, Park Creek Open Space, Bluff Lake, Fitzsimons Golf Course and Toll Gate Creek Greenway Trail. Source: City of Aurora 2007c, 2008a, and 2008b; DRCOG 2004 and 2006 Notes: These resources are located within a 300-foot buffer of the project footprint. The ID represents the resource labels in Figure through Figure (P-#: Parks; T-#: Trails; G-#: Golf Course; OS-#: Open Space) Parks and recreational resources do not include all sidewalks within the project footprint; however, sidewalks identified in Aurora and DRCOG Trail inventory are described in this table. Parks, Recreational Facilities, and Open Space Page 3-75

82 Figure Parks and Recreational Resources in Section 1 Source: City of Aurora, 2007c, 2008a, and 2008b; DRCOG, 2004 and 2006 Parks, Recreational Facilities, and Open Space Page 3-76

83 Figure Parks and Recreational Resources in Section 2 Source: City of Aurora, 2007c, 2008a, and 2008b; DRCOG, 2004 and 2006 Parks, Recreational Facilities, and Open Space Page 3-77

84 Figure Parks and Recreational Resources in Section 3 Source: City of Aurora, 2007c, 2008a, and 2008b; DRCOG, 2004 and 2006 Parks, Recreational Facilities, and Open Space Page 3-78

85 Figure Parks and Recreational Resources in Section 4 Source: City of Aurora, 2007c, 2008a, and 2008b; DRCOG, 2004 and 2006 Parks, Recreational Facilities, and Open Space Page 3-79
86 3.6.2 Impact Evaluation This section describes the impacts of the No-Action Alternative and Preferred Alternative for each resource No-Action Alternative The No-Action Alternative is described in detail in Chapter 2. The No-Action Alternative would not result in direct impacts to parks and recreational resources because no I-225 corridor LRT facilities would be constructed. Other transportation projects included in the No-Action transportation network may have impacts to parks and recreational resources. The impacts of these other projects have been or will be considered in the NEPA process for each of these projects, and avoidance, minimization, and/or mitigation specified, as appropriate, in the specific NEPA decision documents for each project. Indirect Impacts The No-Action Alternative would not result in indirect impacts to parks and recreational resources. Cumulative Impacts Population growth will place additional demands on vacant properties and open space. Development under the No-Action Alternative likely would be more dispersed than under the Preferred Alternative. Population increases would result in development of new housing and businesses on vacant lands and increased use of existing parks and open space. Consistent with local plans, additional parkland would be provided proportionately to new development Preferred Alternative The Preferred Alternative is described in detail in Chapter 2. Impacts from Preferred Alternative are described below for each of the four corridor sections. Some recreational resources would experience direct and construction impacts. Potential for indirect noise and visual impacts during LRT construction and operation are discussed in Sections 3.10 and Section 3.8 noted in the following tables as applicable. Section 1 Nine Mile to Exposition As noted in Table 3.6.2, this section contains two trails. No direct, indirect or temporary impacts are anticipated to T-1 from the Preferred Alternative. The following table summarizes impacts to resources in Section 1. Parks, Recreational Facilities, and Open Space Page 3-80


87 Table Section 1 Potential Parks and Recreational Impacts Resource Name Direct Impacts Temporary Construction Impacts T-2 Unnamed trail connector along Yale Avenue Source: FasTracks I-225 Team, 2008 Yes This trail connector will be relocated/reconstructed as part of the Yale Bridge reconstruction. The trail is currently detached on a structure separate from the Yale Bridge structure that will be replaced with attached sidewalks on both the north and south sides of Yale Avenue. Yes The existing structure would remain in place while the Yale Bridge structure is constructed. Once the structure is complete with the attached sidewalks, the separate trail structure would be removed. Connectivity during construction is expected to be maintained with final details to be defined during final design. Section 2 City Center Near City Center the park and recreation study area contains four resources. Aurora Market Park and trail network as well as the Sable bike lane would be subject to minor direct and temporary construction impacts as spelled out in Table The proposed connector (T-4) would be affected by temporary construction impacts. The following table summarizes impacts to resources in Section 2. Aurora Market Park Aurora Market Park Trail Network Parks, Recreational Facilities, and Open Space Page 3-81
88 Table Section 2 - Potential Parks and Recreational Impacts Resource Name Direct Impacts Temporary Construction Impacts P-1 Aurora Yes Yes Market Park Approximately 0.06 acres of this park would be within the project footprint. This area would be used for sidewalk improvements. No portion of the roadway reconstruction would extend into the park. The acquisition would not change the function of this park. Access from Exposition Boulevard would be restricted during construction, but park will remain accessible via Security Drive. Park visitors would experience construction congestion, noise, and dust. Noise impacts are not anticipated to affect the function of the park since the amphitheater is located over 350-feet T-3 Aurora Market Park Trail Network T-4 Proposed unnamed trail connector from Sable Boulevard to Alameda Avenue T-5 Sable Bike Lane Source: FasTracks I-225 Team, 2008 from LRT centerline. Yes Approximately 572 feet of trail (existing attached sidewalk on south side of Exposition Avenue) within the project footprint would be reconstructed. To meet the standards agreed with Aurora, the attached sidewalk would be replaced by a tree lawn and detached sidewalk. The new detached sidewalk and grading for the sidewalk would extend into the park parcel boundary. The trail would continue to cross Exposition Avenue at the signalized intersection for the mall entrance, this location will also provide for a safe LRT crossing. None The project would not preclude this connection to be built by others. Yes The existing bike lane would end on the south side of Centrepointe Drive where bicycle lane users would cross Centrepointe Drive and the LRT at the signalized intersection. The bicycle lane then becomes a 12-foot shared path on the east side of the LRT. The shared path would continue north across Alameda where it would become an attached sidewalk along Sable Boulevard. Yes The trail would be re-routed during construction of the LRT track or sidewalk improvements. Re-routes include sidewalk on Security Drive. Trail users would experience construction congestion, noise, and dust. Yes If constructed prior to the development of the Preferred Alternative, the trail would be closed or re-routed during construction of the City Center Station and park-n- Ride. Yes The bike lane would be re-routed on the parallel roadways during construction of the LRT track and sidewalk improvements. Bike lane users would experience construction congestion, noise, and dust. Parks, Recreational Facilities, and Open Space Page 3-82
89 Section 3 Ellsworth to Fitzsimons/Montview Within this section there are four park and recreation resources. Direct impacts would occur to the High Line Canal Trail and the 13th Avenue Trail. Temporary construction impacts would occur to all four of these resources as discussed in Table The following table summarizes impacts to resources in Section 3. Table Section 3 Potential Parks and Recreational Impacts Resource Name Direct Impacts Temporary Construction Impacts T-6 High Line Canal Trail and Yes Greenway T-7 6th Avenue Trail T-8 Toll Gate Creek Greenway Trail (existing and proposed) The sidewalk conveying the High Line Canal Trail north along Abilene Street would be relocated approximately 50 feet east onto the Abilene Corporate Center property. A safe and convenient crossing of the LRT tracks would be provided, with passive warning and/or new signalized intersection provided by developer tying into the existing crossing of Abilene at 2nd Avenue. Approximately 0.2 acres of the greenway would be affected as part of the project footprint. Aurora Parks and Open Space and Denver Water staff expressed no concern about this realignment and concur the route is appropriate and adequate. None The LRT alignment would cross over this trail and 6th Avenue on a bridge structure. None No impact to the existing Toll Gate Creek trail. LRT alignment is south of where the trail ties into to Fitzsimons Parkway. The Preferred Alternative would not preclude the southern extension of the proposed trail. Coordination with City of Aurora Parks Department regarding this trail is on-going. The proposed trail alignment could follow the new Aurora sanitary sewer interceptor line. Yes The trail would be re-routed during construction of the LRT track, but access would be maintained. Trail users would experience construction congestion, noise, and dust. Yes The sidewalk would be re-routed during construction of the LRT structure over 6th Avenue. Trail users would experience construction congestion, noise, and dust. Yes Trail users would experience increased construction congestion, noise, and dust on the existing portion of the trail near Montview Boulevard. Parks, Recreational Facilities, and Open Space Page 3-83
90 Resource Name Direct Impacts Temporary Construction Impacts T-9 13th Avenue Trail Source: FasTracks I-225 Team, 2008 Yes Portion of the trail east of Toll Gate Creek would be relocated, consistent with the City s station area planning process for the 13th Avenue Station, to maintain east-west connectivity and provide a safe LRT crossing. Yes The Unnamed Trail along 13th Avenue would be re-aligned during construction to provide continued access for users during construction. Detour details would be defined during preliminary design. Trail users would experience construction congestion, noise, and dust. Section 4 Fitzsimons/Montview to Peoria/Smith Within this section, there are four park and recreation resources. Impacts to these resources are discussed in Table Depending on final design, direct impacts would occur to the Park Creek Open Space and Sand Creek Greenway Trail. The Fitzsimmons Golf Course would be directly impacted if it is not redeveloped as part of the planned Colorado Science + Technology Park at Fitzsimons. The timeframe for redevelopment of this site is unknown at this time. The following table summarizes impacts to resources in Section 4. Table Section 4 Potential Parks and Recreational Impacts Resource Name Direct and Indirect Impacts Temporary Construction Impacts G-1 Fitzsimons Golf Course Yes 5.1 acres of golf course would be affected as part of the project footprint. This property presently is used as a public golf course but eventually will be used for the development of the Colorado Science + Technology Park at Fitzsimons (City of Aurora, 2003). Impacts are dependent based on redevelopment of this property. Yes Should the golf course be redeveloped after LRT is constructed, temporary impacts would occur to golf course users during construction due to staging of equipment, noise, dust etc. OS-1 Park Creek Open Space P-2 Sand Creek Park Yes Approximately 0.3 acres of open space along Peoria Boulevard would be incorporated into project right-of-way. None No direct property impacts since the park is located on the east side of the Peoria Street bridge. Yes Open space visitors would experience construction congestion, noise, and dust. The Park Creek Metro District has jurisdiction over this area and will be contacted to coordinate impacts and appropriate mitigation. Yes Park visitors would experience construction congestion, noise, and dust. Parks, Recreational Facilities, and Open Space Page 3-84
91 Resource Name Direct and Indirect Impacts Temporary Construction Impacts T-10 Sand Creek Greenway and Trail (existing and proposed) Source: FasTracks I-225 Team, 2008 Yes The trail would be realigned slightly to cross under the LRT bridge structure. The clearance would be approximately 20 feet from top of ballast (per Coordination Meeting with Aurora Parks and Open Space on 9/23/08). The project would not change the function of this resource or preclude proposed trail extensions. Approximately 1.6 acres of the greenway would be affected by the Preferred Alternative. Yes A detour would be provided during construction of the LRT structure over Sand Creek. Trail users would experience construction congestion, noise, and dust. Indirect Impacts The Preferred Alternative would not result in indirect impacts to parks and recreational resources. Temporary Construction Impacts Temporary construction impacts are addressed above in Table through Table Cumulative Impacts Cumulative impacts for the Preferred Alternative are essentially the same as for the No-Action Alternative. Implementation of the Preferred Alternative would provide a stimulus for development of land within 0.5-mile of stations, creating higher density mixed-use developments. This would result in a population shift toward TOD. Additional public spaces and recreation areas likely would be provided as part of these TODs Mitigation Measures The I-225 Project Team, including representatives of the environmental and engineering disciplines, met December 15, 2008 to review preliminary project impacts and to discuss specific minimization measures for parks and recreational resources. The team discussed potential minimization opportunities, which are summarized in Table Detailed information for impacts and appropriate mitigation measures are being developed with the owners and those with jurisdiction over the resources, including City of Aurora and Park Creek Metro District, regarding the use of the resource, the available access for the public (including minority, low-income, and transit dependent persons) to the resource, and the identification and review of management plans. Park and recreational impacts and mitigation were discussed with the City of Aurora Parks and Open Space staff at a meeting on April 13, 2009 at which they concurred with the impacts assessment and proposed mitigation measures. It was concluded that construction of the Preferred Alternative will not preclude the construction of the Toll Gate Creek Trail. Impacts to the Park Creek Metro District resource were discussed with their representatives at a meeting on October 15, Minutes from these meetings are in Appendix B. Further coordination with the City of Aurora and the Park Creek Metro District will occur after preliminary engineering has been completed. Parks, Recreational Facilities, and Open Space Page 3-85
92 Trail users would experience increased dust, noise, and construction congestion. Mitigation for these impacts is discussed in Section 3.9, Section 3.10 and Chapter 4, Section 4.8. Table Mitigation Feasibility Evaluation Resource Name Potential Avoidance or Minimization Considered Direct and Temporary Construction Impacts T-2 Unnamed trail Demolition of existing trail will occur after connector along the final Yale Bridge structure is complete Yale Avenue in order to keep continued access. P-1 Aurora Market Park T-3 Aurora Market Park Trail Network T-4 Proposed unnamed trail connector from Sable Boulevard to Alameda Avenue T-5 Sable Bike Lane T-6 High Line Canal Trail and Greenway T-7 Unnamed Trail along 6th Avenue from N. Potomac Street to Toll Gate Creek Greenway Trail Reconfigure alignment to avoid the 0.06 acre impact to the park. Re-configure alignment to avoid the trail network. Temporary construction impacts if trail is constructed prior to development of Preferred Alternative. Analyzed narrowing the LRT envelope from 36 feet to 32 feet, 32 feet was selected. Trail would be re-aligned prior to construction to connect to the existing crossing along 2nd Avenue. Temporary construction impacts during development of Preferred Alternative. Feasibility Evaluation Conclusion Minimization opportunity is reasonable and will be executed for mitigation. Connectivity during construction is expected to be maintained. Minimization opportunity is unreasonable based on LRT and roadway design needs along Exposition Avenue. Realignment to the north would result in additional business and economic impacts. Park will remain accessible via Security Drive. Minimization opportunity is unreasonable based on LRT and roadway design needs along Exposition Avenue. Realignment to the north would result in additional business and economic impacts. Trail will be rerouted during construction. Trail will be rerouted during construction. The on-street Sable bike lane between Centrepointe and Ellsworth Avenue will be replaced with a 12-foot shared use path on the east side of the LRT from Centrepointe to just north of Ellsworth Avenue. Minimization opportunity allows for reconstruction north of Sable is reasonable and will be executed for mitigation. Trail will be rerouted during construction (final plans will be submitted to Denver Water for concurrence per their policy). Trail will be rerouted during construction. Parks, Recreational Facilities, and Open Space Page 3-86
93 Resource Name T-8 Proposed Toll Gate Creek Greenway Trail T-9 Unnamed Trail along 13 th Avenue G-1 Fitzsimons Golf Course OS-1 Park Creek Open Space P-2 Sand Creek Park T-10 Sand Creek Greenway Trail Potential Avoidance or Minimization Considered Walls will provide more flexibility for proposed trail locations. Reconfigure alignment to avoid trail network. Minimization for this resource was not considered because the golf course is expected to be redeveloped in the near future. Additionally, a western alignment on Peoria Street would adversely affect North Middle School and traffic operations at the intersection of Montview Boulevard and Peoria Street. Walls will limit impacts to this resource. Consideration of an eastern alignment was eliminated due to impacts to habitat in Sand Creek Park and community resources further north on Peoria. Direct impacts avoided with west running alignment. Walls utilized to minimize trail relocation. Feasibility Evaluation Conclusion Minimization opportunity is not feasible based on engineering constraints and wall costs. Trail will be rerouted. Minimization opportunity is not feasible. A grade separation and other alignments were considered at this location (see Table 2.3). These alternatives were eliminated because they would not allow for a station and parkn-ride at the 13th Avenue and unreasonable costs. Minimization is not applicable because of approved development plans for the golf course expected to occur prior to construction of the LRT. If LRT is constructed prior to redevelopment, mitigation will be provided for both direct impacts to the recreation area (if required) and temporary construction impacts. Use of walls is a reasonable minimization opportunity and will be executed for mitigation. Prior to construction, an easement agreement will be established with the Park Creek Metro District. No additional mitigation required. Minimization opportunity is reasonable and will be executed for mitigation. Trail will be rerouted during construction and trail will be slightly realigned to accommodate walls. Indirect Impacts No impact No mitigation required. Source: FasTracks I-225 Team, 2008 Parks, Recreational Facilities, and Open Space Page 3-87
94 3.7 Public Safety and Security This section describes existing public safety and security conditions, including crime and accident data, and summarizes potential impacts of the Preferred Alternative on: safety at transit stations and on transit vehicles response times for public and emergency services pedestrian, bicycle, and vehicular safety in transit corridors In addition, appropriate mitigation measures to address safety concerns are identified to be incorporated into design of the project. The study area for safety and security included the LRT line, station area facilities and at-grade crossings Affected Environment Since the implementation of LRT in the Metro Region, studies have shown that crime in neighborhoods surrounding newly constructed transit stations has not increased. Instead, it directly correlates to existing crime rates of the neighborhoods (RTD, 2006). The majority of offenses on board vehicles and at transit stations have been non-violent crimes, which have included trespassing and disorderly conduct on transit vehicles and theft and vandalism of automobiles at stations. The RTD Safety and Security Manual (2005) defines measures the agency takes to ensure the safety and security of its rail transit patrons and those indirectly impacted by their operations. The measures include a Safety and Security department that provides vehicle on-board security staff during hours of rail operation and station area security staff. Emergency telephones are located in station areas and closed circuit television coverage is provided at designated stations, parking structures and lots, and in vehicles. The RTD security force works with the local police to control crime on-board vehicles, along the corridor, at station areas, and in parking facilities Station Area and On-board Safety and Security Evaluating local crime rates is important because crime in surrounding areas generally represents crime that is expected to occur in and around transit stations (RTD, 2006). Using that information, more intense security measures can be implemented as necessary. To determine crime rates at existing station areas, crime statistics were gathered from local law enforcement. The 2006 crime rate per 1,000 people for the City of Aurora was 56.0 (Aurora Police Department, 2006). All of the proposed park-n-rides are located within Aurora; therefore, crime statistics from the City and County of Denver are not applicable. The number of crime incidents on-board RTD s existing LRT vehicles for 2004 and 2005 is displayed in Table The majority of crimes at existing transit stations and park-n-rides involve disorderly conduct as the most common offense on LRT trains. Threats were the second most recorded offense during these two years. Public Safety and Security Page 3-88
95 Table Crime On-Board RTD Light Rail Vehicles Incidents On-board Light Rail Vehicles Alcohol offense 2 0 Arson 0 1 Assault 2 5 Disorderly conduct 11 5 Drug offense 3 0 Forgery/Counterfeit 0 0 Fraud 0 0 Sex offense 0 1 Theft 0 2 Transit-specific crime 2 1 Trespassing 1 0 Threats 7 5 Weapons offense 2 0 Vandalism 0 1 Total Crime Incidents Source: RTD, Public Services Police, Fire, and Emergency Response Table summarizes existing police, fire, and emergency service facilities. All of these facilities are located within the City of Aurora and are illustrated on Figure through Currently, emergency service providers use major street networks in the area including but not limited to I-225, Iliff Avenue, Potomac Street, Mississippi Avenue, Alameda Avenue, 6th Avenue, Colfax Avenue, Fitzsimons Parkway and Peoria Street Table Police, Fire, and Emergency Service Locations Police Location Aurora Police Department District East Montview Boulevard Aurora Police Department District East Alameda Avenue Aurora Police Academy East Montview Boulevard Source: I-225 FasTracks Team, 2008 Fire Location Aurora Fire Department Station Peoria Street Aurora Fire Department Station South Blackhawk Street Emergency Medical Services Locations Children s Hospital East 16th Avenue Medical Center of Aurora North North Potomac Street Medical Center of Aurora South South Potomac Street Rocky Mountain Urgent Care East Mississippi Avenue University of Colorado Hospital East 16th Avenue Public Safety and Security Page 3-89
96 Safety in Transportation Corridors A variety of transportation corridors, such as an interstate highway, secondary roadways, the Southeast LRT corridor, the Union Pacific railroad line, and bicycle and pedestrian trails are within proximity to the Preferred Alternative. Both I-225 and the Southeast LRT corridor, which is adjacent to or connects with the Preferred Alternative, are fenced with a combination of noise barriers, concrete barriers, and chain link fencing. Other corridors such as secondary roadways and the Union Pacific railroad have limited fencing or barriers within the Project study area. The only at-grade Union Pacific rail crossing within the Project study area is located north of Smith Road on Peoria and includes active warning devices (i.e. gates and flashing lights). The top five vehicle accident locations in Aurora are: I-225 at Parker Road; Arapahoe Road at Parker Road; I-225 at Mississippi Avenue; Parker Road at Quincy Avenue, and Mississippi Avenue at Chambers Road (Aurora Police Department, 2007). In 2007, these locations had between 70 and 90 accidents each, including at least two injury accidents at each location Impact Evaluation This section describes impacts of the No-Action and Preferred Alternatives. The crime index was calculated by multiplying the number of parking spaces per station by the crime rate for the surrounding area No-Action Alternative The No-Action Alternative is described in detail in Chapter 2. The No-Action Alternative would not result in direct impacts to safety and security because no I-225 corridor LRT facilities would be constructed. The No-Action Alternative would have no direct impacts on safety and security. Other transportation projects included in the No-Action transportation network may have impacts to safety and security. The impacts of these other projects have been or will be considered in the NEPA process for each of these projects, and avoidance, minimization, and/or mitigation specified, as appropriate, in the specific NEPA decision documents for each project. Indirect Impacts The No-Action Alternative would not result in indirect impacts to safety and security. Cumulative Impacts Future safety and security statistics by neighborhood would remain comparable to existing trends with implementation of the No-Action Alternative Preferred Alternative The Preferred Alternative is described in detail in Chapter 2. Potential impacts of the Preferred Alternative are described below. Station Area and On-Board Safety and Security Actual reported crimes at existing LRT park-n-ride locations in Aurora indicate that the incidence of crime is relatively low. Crime potential for the proposed LRT stations likely would be similar to existing LRT stations in Aurora due to existing RTD security measures. Table summarizes the crime index at each of the proposed station areas. Measures RTD uses to reduce crime and increase safety are identified in Section Public Safety and Security Page 3-90
97 Table Preferred Alternative Station Crime Index Station Number of Spaces 1 Crimes per 1,000 People Iliff Florida 0 n/a City Center nd/Abilene th Avenue Montview 0 n/a Peoria/Smith Source: FasTracks I-225 Team, Number of spaces is based on 2015 Opening Day parking estimates Public Services Police, Fire, and Emergency Response Existing emergency response routes are not anticipated to change as a result of the Preferred Alternative. Increased LRT vehicle frequency at any of the proposed at-grade crossings may slightly affect emergency response times. Based on continued coordination with emergency responders, emergency responses from Aurora Police District 1, Aurora Fire Station #3, and to the Anschutz/Fitzsimons Medical Campus (Children s Hospital and University of Colorado Hospital) would be most sensitive to additional delay resulting from the LRT at-grade crossings. Route changes are not expected as a result of implementing the Preferred Alternative. Measures RTD uses to reduce operational and construction impacts to emergency responders are described in Section Safety in Transportation Corridors The introduction of LRT and at-grade crossings would introduce the risk for accidents between LRT and pedestrians, bicyclists, and motor vehicle operators which are discussed in Chapter 4. Barriers and fencing, consistent with RTD s design guidelines, will be placed on both sides of the LRT to reduce the potential for collisions. Crossings of the LRT will only be allowed at intersection controlled, grade crossings. RTD provides a high degree of safety improvements at each grade crossing, including gates and signal improvements, leaving the potential for collisions with emergency vehicles small. However, it is possible that some additional congestion at these locations would be experienced by emergency vehicles. Indirect Impacts The Preferred Alternative would not result in indirect impacts to safety and security. Temporary Construction Impacts Impacts to police, fire, and emergency services can result during construction of a rail transit system due to a number of factors. These factors would include: Roadway closures due construction of LRT within existing roadways Roadway closures due to construction of bridges and other LRT facilities Detours that require out-of-direction travel and increased response times Public Safety and Security Page 3-91
98 Cumulative Impacts Past and future safety and security statistics by neighborhood would remain comparable to existing trends with implementation of the Preferred Alternative Mitigation Measures Table summarizes impacts and mitigation measures with implementation of the Preferred Alternative. Table Summarization of Public Safety and Security Impacts and Mitigation Measures Impacts Direct Impacts Crime potential at stations or on-board Impacts to police, fire, and emergency response times Risk for accidents between LRT and pedestrians, bicyclists, and motor vehicle operators Indirect Impacts No impacts Temporary Construction Impacts Impacts to police, fire, and emergency providers include roadway closures and detours Mitigation Measures Standard station area and on-board security measures will be implemented Coordinate with responders for impacts to response times Inclusion of barriers, fencing, and crossing measures to reduce conflict No mitigation required Provide service providers with adequate detour information, including advanced notice before construction Coordinate with Colorado State Patrol regarding operational issues as they relate to safety and security Programmatic Mitigation Measures Future development of the corridor will comply with all applicable laws, regulations, and codes to ensure protection of public health, safety, and welfare. The project team will work with police, fire, and transportation agencies during project design to ensure reliable emergency access is maintained and develop alternative plans or routes to avoid delays in emergency response times. RTD will work with the relevant Police/Sheriffs Departments to plan for appropriate security forces and will increase the number of private security guards on patrol within the corridor. The implementation of a Hazard Identification, Analysis and Resolution process is required for all transit engineering projects. Hazards are identified through a Preliminary Hazard Analysis (PHA) to document the description, factors and effects of the hazards. A safety certification process must be connected to verify that the system elements comply with a formal list of safety requirements for each mode of transportation. Fencing and Barriers Fencing and/or barriers will be provided along the alignment and surrounding station areas as appropriate and will be designed to: Be a safety barrier to prevent vehicles, trucks and other roadway users from accidentally entering the alignment Be of sufficient height to prevent trespass Be designed to prevent debris and roadway snow removal activity (snow plows throwing slush, ice and other debris) from entering railway and transit station areas Incorporate safety considerations on elevated sections with respect to fall protection and providing adequate space for maintenance workers Public Safety and Security Page 3-92
99 Emergency Access/Egress Stations will be designed to meet the requirements for stations as identified in National Fire Protection Association (NFPA) 130 guidelines. All stations will have a minimum of two access/egress points. Access/egress will be in a manner that facilitates safe and efficient evacuation from the station platform in four minutes or less. At-Grade Crossings Rail crossings should be designed to incorporate elements that minimize hazards and risks to vehicles, pedestrians, bicyclists, and the rail transit system. Recommended design elements include: Median barriers Proper gate mechanisms Warning bells and lights (unless otherwise restricted by noise mitigation requirements please refer to the Quiet Zone Guidance included in this volume) Clear signage and striping Surveillance Regular surveillance discourages criminal behavior. Surveillance will include both personal and video surveillance. Video surveillance systems will be capable of transmitting real-time video to RTD and Aurora Police Department via a fiber optic transmission backbone or other suitable transmission network. RTD will also evaluate the feasibility of sharing video with local police departments. Personal surveillance will include uniformed officers who sporadically inspect transit stations. Emergency Telephones Emergency telephones will be installed on-site. Emergency telephones will be consistent with existing RTD units and meet performance requirements of RTD s existing emergency telephone network. Emergency telephones will cover station platforms, elevator waiting areas, stairwell entries, parking structures, pedestrian tunnels and pedestrian bridges. Crime Prevention Through Environmental Design (CPTED) CPTED strategies will be incorporated in the entire design. The purpose of CPTED is to minimize potential threats and vulnerabilities to the transit system, facilities and patrons and maximize safety and security through engineering and design. CPTED strategies that will be included: Maximizing the visibility of people, parking areas, patron flow areas and building/structure areas Providing adequate lighting to minimize shadows Installing graffiti guards and remove graffiti when discovered Mylar shatter guard protection for glass windows Landscape plantings that maximize visibility Providing gateway treatments, decorative fencing, perimeter control, and a minimum number of parking structures access points Coordinate and co-operate with municipalities to promote transit friendly land uses. Avoid land uses that have links to crime e.g. liquor stores, taverns, pawnshops, pool halls, vacant lots, and abandoned building Establish maintenance programs that repair broken windows, pick-up litter, and manage streetscapes and public spaces Platform Safety Design elements and electronic technology may be used to ensure the transit platform area is safe and free of hazards. Representative measures may include: Active and passive warning devices that alert persons of risks and hazards; Light emitting diode (LED) flashing pedestrian warning signs that warn of an approaching train; Pavement coloring and texturing to notify pedestrians of hazards and/or risk areas; On platforms with poor sight distance, install pedestrian barriers such as swing gates, automatic pedestrian gates, or Z-crossings to prevent pedestrians from entering the railway An internet-based local information network will be created to serve a variety of needs. It will provide promotional opportunities; real-time transit information updates on construction, route closures, and alternative route information and other transportation information and services. The network would be coordinated with state and regional Intelligent Transportation Systems (ITS) projects. Public Safety and Security Page 3-93
100 Additional mitigation Additional safety and security measures will be undertaken during construction to reduce impacts on the public and emergency responders, including: Producing Traffic Management Safety Reports and Traffic Control Plans for each phase of construction. Maintaining at least one open lane of traffic on affected arterials during construction. Developing alternative plans or routes, if needed, to avoid delays in emergency response times. Keeping transit operating at existing stops where possible. Keeping bike and pedestrian facilities continuous. Ensuring the contractor obtains permits and approvals by local governments for all detours. Providing signing plans (sign continuity must be maintained and advance warning of any planned closure provided at least 7 days in advance). Providing pavement marking plans to maintain access and circulation in construction areas. Providing temporary signalization plans in coordination with RTD, local agencies, and utility providers. Source: FasTracks I-225 Team, 2008 Public Safety and Security Page 3-94
101 3.8 Visual and Aesthetic Resources Visual resources include those features that define the visual character of an area. These can be natural features, vistas, or viewsheds and can include urban or community visual characteristics that create a visual definition for an area. This section provides a visual quality inventory and assessment to determine possible impacts on aesthetic resources caused by the implementation of the Preferred Alternative. A visual study area was established that includes user views from the proposed facilities; and view of the facilities. This is referred to in this section as the visual study area Affected Environment A visual inventory was completed including landforms (or topography), water features (lakes, rivers), vegetation, and cultural features. The study area is primarily located adjacent to welldeveloped urban roadway corridors (I-225, and other collector streets and major arterials). Water features present include the High Line Canal and Toll Gate Creek, both of which are below grade and not visible from existing roadways. Vegetative features are typically urban, except for mature trees along the High Line Canal and Toll Gate Creek. In elevated areas, mountains are visible in the background to the west. Generally the viewshed is restricted to surface areas in the foreground/short-range. The City of Aurora Municipal Center stands out as a dominant feature in Aurora with a corridor view of the mountains preserved to the west along Alameda Avenue. Visual sensitivity is based on the number and types of primary viewers and sensitive receptors and their values, sensitivity, opinions, and preconceptions of visual resources. Sensitive receptors are those viewers that have a high visual sensitivity to changes in the visual environment. Generally viewers in parks and residential areas are assumed to be most sensitive to visual and aesthetic visual change, while viewers in industrial areas would be the least sensitive. A review of local plans indicates there are no protected viewscapes in the study area; however, the City of Aurora seeks to preserve and take advantage of Front Range mountain views and open vistas when possible. The visual study area can be broken down into distinct landscape character units that contain similar elements such as: existing road corridors, undeveloped land (open space, parks, recreation areas, and trails), commercial, municipal and light industrial, and residential areas. Table presents a visual quality summary. Visual and aesthetic resources were evaluated using the Federal Highway Administration (FHWA) Visual Impact Assessment for Highway Projects (1988) that identifies that in order for a view to be higher quality it must achieve varying levels of vividness, intactness, and unity. These three factors are considered effective indicators of low, moderate, or high visual quality. Low visual quality is indicated by a severely encroached upon landscape that is chaotic and lacking in strong visual unity. High visual quality is indicated with scenes that are strikingly vivid, highly intact with little to no trace of disturbance, containing harmony, balance, and integrity. Sensitive viewer types are considered those that are residential (i.e., houses, condos etc.) or recreational. Visual and Aesthetic Resources Page 3-95
102 Table Visual Quality Summary Section Overall Visual Quality Score Visual Elements Interstate highway features, sound walls, and berms; isolated and clustered Section 1 Nine Low to Moderately businesses and office Mile to Exposition Low buildings; some views of Rocky Mountains; electrical infrastructure Retail and serviceoriented businesses; Town Center at Section 2 City Moderately Low to Aurora; Aurora City Center Average Center; apartments and condos; large parking lots Open space and trails near the High Line Canal; Interstate Section 3 Highway features; Ellsworth to Low to Moderately retail businesses; Fitzsimons/ Low office buildings; Montview apartments; Toll Gate Creek; large parking lots; storage units, electrical towers Toll Gate and Sand Creeks; undeveloped land; school, medical and service-oriented buildings; large Section 4 parking lots; golf Fitzsimons/ Low to Average course, open space; Montview to restaurant, Peoria/Smith commercial, and industrial development; warehouses; electrical towers; heavy rail Source: FasTracks I-225 Team, 2008; FHWA 1988 Project Viewer Types Office, medical, and retail staff; commuters; tourists; and other travelers along I-225 Residents; office, medical, and retail staff; commuters; tourists; other travelers along I- 225; and shoppers Recreational users; residents; office, medical, and retail staff; commuters; tourists; other travelers along I-225 Office and industrial workers, medical professionals, medical patients, residents, shoppers, recreational users Sensitive Viewers Single and Multifamily housing units Multi-family housing units Multi-family housing units, parks/trails Recreational users along the High Line Canal, Toll Gate Creek, local residents (Copper Flats Apartments), and medical and office staff Visual and Aesthetic Resources Page 3-96
103 3.8.2 Impact Evaluation Determination of visual impacts is based on site visits, reviews of local planning documents, project drawings, and aerial photography of the Project study area. Impact analysis for visual resources was based on the potential for visual change throughout the corridor view. For this analysis, implementation of the Preferred Alternative would be considered to have an impact on visual resources if the project: Blocks or impedes scenic views Changes the existing visual character or quality of the site by adding inappropriate design elements Creates a new source of substantial light or glare No-Action Alternative The No-Action Alternative is described in detail in Chapter 2. The No-Action Alternative would not result in direct impacts to visual quality because no I-225 corridor LRT facilities would be constructed. Other transportation projects included in the No-Action transportation network may have impacts to visual resources. The impacts of these other projects have been or will be considered in the NEPA process for each of these projects, and avoidance, minimization, and/or mitigation specified, as appropriate, in the specific NEPA decision documents for each project. Indirect Impacts No indirect impacts to visual quality are expected under the No-Action Alternative. Cumulative Impacts The Project Study Area has transformed from being partially developed in the 1950s to almost entirely developed today. Over this period, the visual quality of the area has changed from rural and industrial to urban, suburban, and industrial. The No-Action Alternative and other reasonably foreseeable future actions would be consistent with existing visual conditions in the Project Study Area Preferred Alternative The Preferred Alternative is described in detail in Chapter 2. Project features of the Preferred Alternative that have potential to change visual conditions in the Project study area are discussed below. These features are consistent throughout all four sections of the project. Bridges over roadways would create a visual impact for sensitive viewers. There are six bridges over roadways associated with this project. These bridges would range from 25 to 30 feet higher than the existing ground elevation. In addition, one pedestrian facility would cross I- 225 at Florida Avenue. The bridges would be situated near clusters of office buildings, residences, and businesses. Depending on the height of these businesses, scenic views to and from the buildings could be inhibited. In particular, tenants in buildings situated east of the alignment would experience loss of partial or full views of the Front Range mountains. Visual and Aesthetic Resources Page 3-97
104 Visibility of business signage throughout the corridor may be reduced due to the introduction of LRT elements. Where the alignment is located at-grade, users of the proposed LRT facility would have a similar view of these signs. Some business signs may have slightly obscured views from roadway facilities depending on the location of the existing sign and the right-of-way barrier and fence height in that location. Grade separation structures at some locations could also reduce visibility of business signage. Electrical substations would be required as part of the Preferred Alternative throughout the entire Project study area to supply electricity for train operations. The typical autotransformer substation footprint is approximately 50 feet by 100 feet, and is the equivalent height of one story. The exact locations of electrical substations would be determined during final design. Some substations would be placed within station areas and others would be placed in available City of Aurora or CDOT right-of-way. Right-of-way barriers and fencing will be consistent with RTD s LRT Design Criteria. Barriers may range from a five-foot concrete wall with a seven-foot chain link fence (at Florida Station) to a 6-inch curb along Montview Boulevard through Anschutz/Fitzsimons Medical Campus. RTD s LRT Design Criteria specifies chain link as the standard fencing; however, the City of Aurora fence regulations apply to all LRT station areas. Fencing and enhancements may be considered based on site-specific hazard analysis, land use, visual context, City of Aurora regulations, and access needs. Trees within the project footprint would be removed to accommodate the Preferred Alternative. These trees would be relocated or replaced in accordance with the City of Aurora s Landscape Ordinance (2004) and the Landscape Manual and Tree Preservation Policy (2006). Approximately 840 trees are located within the permanent project footprint. Approximately 115 trees or shrubs are located in CDOT s right-of-way and within the permanent project footprint. These trees range in size from small to large and in age from young to mature. A summary of trees by section is included in Table Table Summary of Potential Tree Impacts Section Approximate Number of Trees Section Section Section 3 70 Section Total for all Sections 840 Source: FasTracks I-225 Team, 2009 Visual and Aesthetic Resources Page 3-98


105 Other elements that will change visual conditions include tracks, support beams, retaining walls, eight transit stations, and four park-n-rides. Additionally, impacts of LRT vehicles will be sporadic and based on the service schedule of the transit line. Catenary wires will be present throughout the entire project and will be consistent with the style currently present in the Southeast Corridor and at the Nine Mile Station. Section 1 Nine Mile to Exposition Sensitive viewers within this section include: multifamily housing units and lodging facilities. The Preferred Alternative would have negligible impact on visual quality within this section since this section currently contains numerous transportation features, noise barriers, and large electrical towers. For this reason, proposed LRT features track, catenary, retaining walls, stations, park-n-rides, and electrical substations would be consistent with the surrounding setting. The Iliff and Florida Stations would likely enhance and blend into the surrounding visual environment and would not contrast with the existing urban visual environment. Following relocation of I-225 westward, residents living west of the highway would have a closer view of I-225 with visual impacts being negligible. Section 2 City Center Sensitive viewers in the City Center section include condominiums, apartment complexes, and residences. The Preferred Alternative would have negligible impact on visual quality and would be compatible with the surrounding setting. The Preferred Alternative is at-grade through this reach, therefore having minimal potential to block scenic views, specifically the view from the Aurora City Center to the Front Range mountains. The City Center Station will be constructed adjacent to an existing RTD bus transfer facility. It would likely enhance and blend into the surrounding visual environment and would not contrast with existing transit and urban visual environment. Nine Mile to Exposition: Large electrical towers are visible throughout the I-225 corridor. This photograph was taken just north of the E Iliff Avenue Interchange. City Center: Current views of the Aurora City Center also include wide expanses of undeveloped land. Visual and Aesthetic Resources Page 3-99


106 Section 3 Ellsworth to Fitzsimons/Montview Even though recreational users and residents are present in this area, impacts would be negligible because dominant features in this viewshed already include I-225 fencing, noise barriers, signage, and berms. For that reason and even despite the presence of the High Line Canal, visual quality of the area is moderately low to average, which means the LRT would not have adverse visual impacts. Bridges over roadways within this section are located at East 6th Avenue and East Colfax Avenue. Building tenants east of I-225 who currently have scenic views of the Front Range mountains would experience temporary decreased visual quality as LRT moves through the visual shed. The 2nd/Abilene Station would be constructed in an area that contains some recreational viewshed components. The City of Aurora, through its station area planning process, is expected to consider the visual elements of this station. The 13th Avenue Station would likely enhance the surrounding visual environment with the inclusion of additional landscaping and other urban design elements. The elevated Colfax Station would not contrast with existing views due to the existing East Colfax bridge structure over I-225. Section 4 Fitzsimons/Montview to Peoria/Smith Sensitive receptors most likely to experience visual impacts within this section consist primarily of residences. Montview Boulevard, through the Anschutz/Fitzsimons Medical Campus, is an urban environment that is undergoing substantial visual change as campus development continues to evolve. The LRT track and catenary would stand out as a unique feature among the many medical buildings present along Montview Boulevard. Because numerous existing buildings block views of the Front Range Mountains, the Montview Station would not contrast with the existing urban visual environment. Ellsworth to Fitzsimons/Montview: Current views of the area just east of I-225, near E 13 th Avenue, include open space in the foreground and development in the background. Fitzsimons/Montview to Peoria/Smith: At present, areas along E Montview Boulevard are being developed actively to meet the needs of the Anschutz Medical Campus. Visual and Aesthetic Resources Page 3-100

107 The Preferred Alternative would have a negligible impact on visual quality in the area. Although LRT features would stand out against the park and golf course, they would not be incompatible as compared with the adjacent roadway. Furthermore the Peoria/Smith LRT Platform, which would be situated at the north end of the project, would not inhibit views of the Front Range Mountains due to its location and orientation. This station likely would improve local visual quality due to inclusion of additional landscaping and other urban design elements. Indirect Impacts The addition of stations and park-n-ride facilities associated with the Preferred Alternative may result in Fitzsimons/Montview to Peoria/Smith: Views northbound on N Peoria Street near Baranmor Parkway include restaurant and other commercial development in the foreground and warehouses in the background. a densification of land uses near stations. These areas may develop with taller buildings that would change the visual surroundings near the stations. The structures have the potential to contrast with the existing visual environment depending on the height, design, style, etc. of the structures. Temporary Construction Impacts Temporary visual degradation would occur during construction due to the presence of exposed soils, stockpiles of materials, construction equipment, and construction operations. Cumulative Impacts Preferred Alternative The Preferred Alternative in conjunction with other past and reasonably foreseeable future projects would be visually consistent with the suburban, urban, and industrial nature of Aurora, especially along the I-225 Corridor where transportation features already dominate the viewshed. Future development projects would be subject to Aurora s Municipal Code, which would give them a consistent look in relation to existing and other planned development. Visual and Aesthetic Resources Page 3-101
108 3.8.3 Mitigation Measures Table summarizes impacts and mitigation measures associated with implementation of the Preferred Alternative. Table Summarization of Visual and Aesthetic Impacts and Mitigation Measures Impact Mitigation Measure Direct Impacts During final design, care will be taken to address the visual compatibility Bridges over roadways of the project with surrounding areas. Special effort will be used in the design of bridges over roadways, retaining walls, stations etc. including Visibility of business signage the incorporation of reasonable and cost effective architectural elements. The City of Aurora, through their station area planning process (City of Electrical Substations Aurora, 2009) includes design options that would complement existing views. Right-of-way barriers and fencing RTD will continue to coordinate with the City of Aurora on design features including electrical substations and specific fencing/wall types Trees removal or located within the City s right-of-way and station areas. relocation Reasonable cost effective aesthetic treatment options to be considered Other elements during design include: Consider sensitive design of bridges over roadways, retaining walls, barriers and fence types Continued coordination with City of Aurora and affected businesses Trees will be relocated or replaced in conformance with the City of Aurora s standards and policies. Trees within CDOT right-of-way will be replaced according to CDOT s tree replacement policy Indirect Impacts No mitigation is required. No indirect impacts Temporary Construction material staging areas will be fenced and screened. Construction Impacts After project construction, the ground surfaces outside of the trackway Decreased visual quality due to construction activities will be restored to the original condition, and any vegetation that had been removed during the construction process will be replaced with likekind vegetation, where feasible. Source: FasTracks I-225 Team, 2009 Visual and Aesthetic Resources Page 3-102
109 3.9 Air Quality and Energy Air Quality This section discusses air quality with respect to the No-Action Alternative and the Preferred Alternative. The air quality study area includes both regional and local aspects within the Metro Region. The purpose of the air quality analysis is to evaluate potential air quality impacts from the project. Air quality is generally evaluated by comparing concentrations of air pollutants to National Ambient Air Quality Standards (NAAQS), which are set to protect human health and welfare. The Clean Air Act and its amendments required the United States Environmental Protection Agency (USEPA) to establish the NAAQS. NAAQS have been set for six criteria air pollutants (USEPA, 2008a): carbon monoxide, ozone (O 3 ); particulate matter, both with an aerodynamic diameter of 10 micrometers or less (PM 10 ) and with an aerodynamic diameter of 2.5 micrometers or less (PM 2.5 ); nitrogen dioxide; sulfur dioxide; and lead (Table 3.9.1). Carbon monoxide is an odorless, colorless gas that is dangerous because it interferes with the body s ability to absorb oxygen. Ground-level O 3 is a gas that is not typically emitted by any common sources; rather it is formed by chemical reactions between nitrogen oxides and hydrocarbons in the presence of sunlight. O 3 is a strong oxidizing agent and can damage cells in lungs and plants. Particulate matter (both PM 10 and PM 2.5 ) is a complex mix of very small solid particles and liquid droplets that can be inhaled deeply into the lungs and interfere with lung function or lead to other health effects. Nitrogen dioxide can contribute to O 3 formation, particulate matter formation and acid deposition and can damage cells in lungs and plants and damage water quality. Sulfur dioxide can cause respiratory illness and acid deposition. Lead is a metal that can adversely affect the kidneys, liver, nervous system or other organs. Areas that have violated the NAAQS were required to develop State Implementation Plans that would bring nonattainment areas into compliance with the NAAQS and then maintain compliance with the NAAQS. The affected areas must demonstrate that local transportation plans, transportation improvement programs, and transportation projects will conform to the relevant State Implementation Plans purpose of progressing toward compliance with the NAAQS or maintaining compliance with the NAAQS. As a whole, the region must conform to the State Implementation Plans emission budgets for air pollutants from mobile sources and projects must not: Cause or contribute to any new violation of a NAAQS Increase the frequency or severity of violations of a NAAQS Delay timely attainment of the NAAQS or any required interim emissions reductions The Denver Regional Council of Governments (DRCOG) is responsible for coordinating the transportation plans and improvement programs for the Metro Region, which includes Aurora. Each plan and program must demonstrate conformity to the State Implementation Plan at a regional level prior to implementation. Individual projects may also need to demonstrate conformity at a local (e.g., intersection) level. Air Quality and Energy Page 3-103
110 Table National Ambient Air Quality Standards Pollutant and Standard Averaging Time Concentration Carbon Monoxide Ozone Primary (no Secondary) 1-Hour a 35 parts per million (ppm) Primary (no Secondary) 8-Hour a 9 ppm Primary and Secondary 8-Hour b ppm (2008) Primary and Secondary 8-Hour b 0.08 ppm (1997) Particulates (PM 10 ) Primary and Secondary 24-hour c 150 µg/m3 (micrograms per cubic meter) Particulates (PM 2.5 ) Primary and Secondary Annual d 15 µg/m 3 Primary and Secondary 24-hour e 35 µg/m 3 Nitrogen Dioxide Primary and Secondary Annual ppm Sulfur Dioxide Lead Primary Annual 0.03 ppm Primary 24-hour a 0.14 ppm Secondary 3-hour a 0.5 ppm Primary and Secondary Calendar quarter 0.15 µg/m 3 Source: USEPA, 2008a a This concentration is not to be exceeded more than once per year. b The 8-hour Ozone standard is the 3-year average of the annual 4th highest 8-hour average concentration. c Not to be exceeded more than once per year on average over three years. d The annual arithmetic mean standard is a 3-year average. e The 24-hour PM 2.5 standard is based on the 98th percentile Affected Environment The project area is located on the eastern slope of the Rocky Mountain Front Range in a semiarid region. The mean elevation of the project is approximately 5,400 feet above sea level. Temperatures range from 27 to 100 degrees Fahrenheit, with a daily normal temperature change of 9 to 30 degrees Fahrenheit. Aurora has a climate typical of mid-latitude high elevations. Temperature, precipitation, and wind strength are highly variable throughout the region, affected by elevation and topographic relief. In general, Aurora experiences low relative humidity, light precipitation, and abundant sunshine. The Metro Region can experience atmospheric inversions where warm air aloft traps cooler air on the ground, causing the air to stagnate. This situation can lead to higher pollutant concentrations. Air Quality and Energy Page 3-104
111 The project corridor is in an urban environment without any current rail lines in Aurora. Much of the LRT corridor will abut I-225. In other areas, the LRT corridor will pass through residential, commercial and undeveloped areas. Land uses more sensitive to deteriorating air quality include homes, schools, medical facilities, and parks. Carbon monoxide, O 3 and PM 10 have historically been problems in Denver as the Region has been a NAAQS nonattainment area for all of them. But national and regional pollutant reduction actions over an extended period have improved the regional air quality situation (Table 3.9.2). Currently, Denver is a maintenance area for carbon monoxide and PM 10 but is a nonattainment area for the 8-hour O 3 NAAQS. In recent years, the O 3 violations have been in the western metropolitan area but not in Aurora. Carbon monoxide is emitted directly from vehicle tailpipes from incomplete fuel combustion. PM 10 is emitted from vehicle tailpipes and from road dust. O 3 is not emitted directly; rather O 3 comes from hydrocarbons and oxides of nitrogen reacting in the atmosphere under warm, sunny conditions. There are many sources for the O 3 precursors, but vehicles are major contributors. O 3 may not form where the precursor pollutants are emitted and consequently is a regional pollutant. The LRT itself would not be a major source of any of these air pollutants. Table Air Pollution Levels in the Metro Region (2007) Pollutant Averaging Time Highest Level Measured Station Location Carbon Monoxide 8 hrs 3.2 ppm Denver CAMP PM hrs 118 µg/m Commerce City PM hrs 75.5 µg/m Denver CAMP Ozone 8 hrs ppm Rocky Flats Sulfur Dioxide 24 hrs ppm Denver CAMP Nitrogen Dioxide Annual ppm Denver CAMP Source: CDPHE: Colorado Annual Data Report 2007 Section Impact Evaluation The air quality impact analysis that has been performed for the Preferred Alternative was developed through consultation with the Air Pollution Control Division (APCD). The analysis includes a quantitative assessment of carbon monoxide concentrations at congested intersections and a qualitative assessment of PM 10 (Wells, 2008). Conversely, O 3 precursor pollution is regional in nature and a project-level assessment is not necessary. Mobile source air toxic (MSAT) compounds are a class of pollutants of growing concern for which NAAQS have not been established but were evaluated for the project. Construction of the LRT may have air quality impacts and is discussed below. No-Action Alternative The No-Action Alternative is described in detail in Chapter 2. Total vehicle miles traveled (VMT) was analyzed and found to be very similar for the No-Action Alternative and the Preferred Alternative (Chapter 4, Table 4.4), with the No-Action Alternative resulting in slightly higher VMT. This slightly greater VMT for the No-Action Alternative would result in only slightly greater emissions of carbon monoxide, PM 10, and Nitrogen Oxide (NO) x relative to the Preferred Air Quality and Energy Page 3-105
112 Alternative. These slightly greater emissions would be unlikely to result in regional air quality impacts for the No-Action Alternative. At a local level, the congested intersections analyzed for the Preferred Alternative have similar or more traffic than the No-Action Alternative. Therefore, the absence of NAAQS violations for the Preferred Alternative would also apply to the No-Action Alternative. Table summarizes the No-Action maximum carbon monoxide concentrate. Indirect and Cumulative Impacts Regional modeling performed by DRCOG in support of its Regional Transportation Plan conformity determination is by its nature cumulative as it must consider all sources of air pollutants to the region. The modeling examines conditions well into the future and considers proposed changes within the modeling region, including the actions associated with the No- Action Alternative. This examination of cumulative regional air pollutant emissions has been shown to conform to the State Implementation Plans. Therefore, no adverse cumulative impacts to air quality are associated with the No-Action Alternative and other local actions. Preferred Alternative The Preferred Alternative is described in Chapter 2. The Preferred Alternative is included in the current RTP and therefore conforms to the State Implementation Plans at the regional level. In addition, the interagency consultation process for this project concluded that a signed concurrence letter from Colorado Department of Public Health and Environment (CDPHE) regarding the conformity determination is not required for this project because: It will be funded entirely with local funds There is no federal agency approval required Carbon Monoxide Evaluation A quantitative assessment of local carbon monoxide concentrations involved the modeling of congested intersections where concentrations are expected to be the highest. Intersections were selected based on traffic volumes, roadway cross-sections, and potential congestion. The results shown are for the more restrictive 8-hour carbon monoxide NAAQS; the highest carbon monoxide result for each section is shown in Table Table Maximum Carbon Monoxide Hot Spot Model Results Maximum 8-Hour Concentration (ppm) Project Section Intersection No-Action Preferred Alternative NAAQS Section 1 Nine- Abilene & Mile/Exposition Blackhawk Section 2 City Center Alameda & Sable Section 3 Ellsworth/Fitzsimons 6th & Sable Section 4 Peoria & Fitzsimons/Peoria Fitzsimons Source: FasTracks I-225 Team, 2008 Air Quality and Energy Page 3-106
113 The modeling results demonstrate that carbon monoxide concentrations will not exceed the NAAQS, so the Preferred Alternative would not have carbon monoxide impacts. Regionally, the Preferred Alternative is expected to reduce VMT by providing an alternative to automobiles, which would result in positive effects on regional air quality. PM 10 Evaluation A qualitative analysis of PM 10 impacts was conducted through the review of CDPHE monitoring and modeling for the region (CDPHE, 2005). Through the interagency consultation process, it was determined that the approved PM 10 Maintenance Plan for the Metro Region included a modeled demonstration of maintenance for the PM 10 NAAQS extending out to Violations of the PM 10 standard are not expected to occur in the study area for the following reasons: CDPHE model concentrations for the area are well below the NAAQS The I-225 LRT is part of the RTP used by CDPHE to model PM 10 levels The I-225 LRT system would not directly emit PM 10 Except for areas immediately next to park-n-ride lots, improved public transportation reduces vehicular traffic and thereby reduces emissions of PM 10 Therefore, the Preferred Alternative was found not to have PM 10 impacts. Mobile Source Air Toxics This project falls under Category # 1 no analysis for projects with no potential for meaningful MSAT effects because it is exempt under the Clean Air Act conformity rule under 40 CFR Therefore, the following description has been provided only for informational purposes. The I-225 LRT would not result in any meaningful changes in traffic volumes, vehicle mix, location of the existing facilities, or any other factor that would cause an increase in emissions impacts relative to the No-Action Alternative. As such, this project would have minimal air quality impacts for criteria air pollutants and has not been linked with any special MSAT concerns. Consequently, this effort is exempt from analysis for MSATs. Moreover, USEPA regulations for vehicle engines and fuels will cause overall MSATs to decline significantly over the next 20 years. Even after accounting for a 64 percent increase in VMT, Federal Highway Administration (FHWA) predicts MSATs will decline in the range of 57 percent to 87 percent, from 2000 to 2020, based on regulations now in effect. This reduces both the background level of MSATs as well as the possibility of even minor MSAT emissions from this project. Electricity to power the LRT would come from the grid and would likely come from a continually shifting network of coal plants, gas plants, wind farms or even nuclear power plants. It is assumed that the Preferred Alternative s power needs would not require additional power generation capacity. Therefore, a realistic quantification of the impacts cannot be accomplished. Greenhouse Gas Emissions - Carbon dioxide is used as a surrogate for greenhouse gas emissions in this analysis. Greenhouse gas emissions were calculated by multiplying energy British thermal units (BTUs) use by the conversion factors provided by FTA. The conversion factors are: Air Quality and Energy Page 3-107
114 Bus (compressed natural gas) = LRT and commuter rail (electric) = Passenger vehicle = Heavy-duty vehicle (truck) and bus (diesel) = The anticipated traffic reduction due to FasTracks ridership system-wide would slightly lower future automobile carbon dioxide emissions (RTD, 2007) thereby reducing impacts of global warming. Table shows that in both 2015 and 2035, the Preferred Alternative would produce slightly more carbon dioxide overall compared with the No-Action Alternative. However, the increase associated with the Preferred Alternative is negligible. Table Amount of Carbon Dioxide Produced No-Action Alternative Preferred Alternative No-Action Alternative Preferred Alternative Carbon dioxide produced (millions of tons) Difference from No-Action Alternative 13,037,754 13,039,595 18,052,746 18,060,761 N/A +1,841 N/A +8,015 Percent Difference N/A N/A One of the main strategies to reduce greenhouse gas emissions is to provide choices for travel so that options other than single occupant vehicle (SOV) travel are available. The I-225 LRT would provide a transit travel option that does not currently exist. In addition, RTD has committed to using the cleanest fuels that are reasonable, available, and practical in order to reduce all greenhouse gases, including nitrous oxides, a contributor to greenhouse gas emissions. Also, at transit stations, the I-225 LRT would support TOD development which has been found to reduce travel, and consequently, greenhouse emissions. Feeder bus service will be provided to encourage access by that mode rather than by an SOV Temporary Construction Impacts Construction of the Preferred Alternative could cause temporary air quality impacts. However, these emissions can be controlled through application of routine construction management practices. Construction activities are not expected to have a significant impact on air quality. The total suspended particulates are not expected to exceed 12-tons per month assuming no more than 10-acres of land are being worked at any one time (USEPA, 1995). PM 10 would only be a portion of that amount. These emissions would be temporary and are not anticipated to cause any air quality violations. Air Quality and Energy Page 3-108
115 Cumulative Impacts Regional modeling performed by DRCOG in support of its RTP conformity determination is by its nature cumulative as it must consider all sources of air pollutants to the region. The modeling examines conditions well into the future and considers proposed changes within the modeling region, including the Preferred Alternative. This examination of cumulative regional air pollutant emissions has been shown to conform to the State Implementation Plans. Therefore, no adverse cumulative impacts to air quality are associated with the Preferred Alternative and other local actions Mitigation Measures The Preferred Alternative was examined for potential air quality impacts in both regional and local terms. The analysis concluded that there would be no impacts to air quality. Table summarizes the impacts and mitigation measures associated with the Preferred Alternative. Although no impacts were identified during the analysis, minimization measures have been identified to reduce particulates during construction and operation of the LRT. These specific RTD programmatic mitigation measures are discussed in Table Table Direct Impacts No direct impacts Summarization of Air Quality Impacts and Mitigation Measures Impacts Mitigation Measures No mitigation required During operations specific measures to reduce particulates and MSAT will be implemented as discussed under Programmatic Mitigation Measures No mitigation required Indirect Impacts No indirect impacts, negligible greenhouse gas emissions Temporary Construction Impacts Monitoring of PM 10 during construction and Decreased air quality due to construction MSAT as discussed Programmatic Mitigation activities Measures Programmatic Mitigation Measures Construction Mitigation: Monitoring of PM10 During Construction - Monitoring and mitigation for pollutants will help ensure that the FasTracks program will comply with the NAAQS standards and reduce exposure to the citizens of the Metro Region. During the construction of the program, several measures will be implemented to control fugitive dust and emissions. CDPHE will require control of fugitive dust emissions during construction. Where construction materials will be delivered by truck and will be stored at staging areas, the following measures will be implemented. Specific measures that will be discussed with CDPHE for the control of fugitive dust emissions prior to any FasTracks construction are (for those cases in which construction materials and equipment are stored at major staging areas): Using water or a wetting agent in solution to manage dust on-site. Using wind barriers and wind screens to minimize spreading of dust from the site Having a wheel wash station and/or large-diameter cobble apron at egress/ingress areas to minimize dirt being tracked onto public streets Using vacuum powered street sweepers to control dirt tracked onto streets Covering all dump trucks leaving sites to minimize spilling onto streets Covering or wetting temporary excavated materials Using a binding agent for long-term excavated materials Air Quality and Energy Page 3-109
116 The Air Pollution Control Division of the Colorado Department of Public Health and Environment requires monitoring programs as part of their fugitive dust permitting process; and will be implemented during construction. Monitoring programs may include assessing sampling site selection to account for wind directions and sensitive abutters, such as hospitals or residences. The sampling timeframe could be configured to ensure capturing all time periods, by rotating the days of the week that were sampled. Monitoring programs will allow for the real-time modification or implementation of various dust control measures. Mobile Source Air Toxics (MSATs) - Although no MSAT impacts were identified during analysis, the following minimization measures will be considered during construction: During construction: prohibit unnecessary idling, diesel engines and motors should be located as far away as possible from residential areas, low-sulfur fuel should be used, locate staging areas away from residential uses, schedule work outside of normal hours for sensitive receptors or adjusting work to fit the use of adjacent facilities may be necessary only in extreme circumstances -- such as construction immediately adjacent to a health care facility, church, outdoor playground, school, etc During construction, RTD could require contractors to shut down equipment idling for a long period of time, as appropriate. For winter time construction, install engine pre-heater devices to eliminate unnecessary idling. Prohibit tampering with equipment to increase horsepower or to defeat emissions control devices effectiveness. Require construction vehicle engines to be properly tuned and maintained. Use construction vehicles and equipment with the minimum practical engine size for the intended jobs. Operations Mitigation: Specific measures can be taken during operations to reduce particulates can include: Prompt sweeping sand from paved surfaces (primarily at stations) This measure of routine street sweeping will reduce fugitive dust emissions, as well as sediment runoff. Programs to encourage use of alternate modes getting to the stations Providing good access to stations by bus, pedestrian access or by bicycle from nearby neighborhoods will encourage people not to drive, thereby reducing air emissions from automobiles. Programs can be created to encourage the use of shared bicycles. RTD currently sponsors DRCOG s Bike-to-Work Day. Idling Reduction Technologies During the contractor selection process, RTD could give priority (when there is no significant difference in cost) to contractor s that use these technologies on new equipment, or will retrofit older equipment. The EPA has a list of the available technologies, manufacturers and costs, which can be accessed at the following internet address: EPA does not make any claims as to the effectiveness or operation of these products. The listing is for informational purposes only. EPA does not certify idle reduction technologies. Costs are approximately $1500 to $7500 per vehicle for trucks and buses, and approximately $30,000 to $50,000 for locomotives. Emissions Reduction Strategies RTD could reduce emissions from its vehicles by purchasing and retrofitting its existing vehicle fleet with emissions equipment. For its bus fleet, devices can be installed for a cost of approximately $3,000 per vehicle, which would reduce vehicle emissions. RTD has modified approximately 500 buses with more efficient electronic engine controls and fuel injections. This modification has reduced emissions by approximately 90 percent. New buses (187) have been purchased that are equipped with particulate filters on the exhaust, and exhaust recirculators that reduce the combustion temperature, thus reducing NO x. Another strategy could be changing the fuel purchased for vehicles. Low-sulfur diesel is readily available, as well as additives for regular diesel. These diesel formulas significantly reduce pollutant emissions while slightly increasing fuel consumption. RTD is currently phasing in low-sulfur diesel fuel and soon all buses will be using low-sulfur diesel. RTD is also testing bio-diesel fuel (B20) in five buses. RTD currently implements a 3-minute bus idle limit; requiring all drivers to shut down the bus if it s idling more than three minutes. Air Quality and Energy Page 3-110
117 Another way to reduce idling would be to formulate maintenance and run schedules so that idling time is at the very minimum necessary to keep the trains in proper running condition. It could also include restricting locomotive idling to certain locations where there is minimal impact to residences or human activity. Mobile Source Air Toxics - During operation, in addition to the technology specific measures listed below, work with cities, counties and Transportation Management Organizations on programs to encourage the use of alternate modes to get to stations, work with cities and counties to implement appropriate signal timing on streets leading to stations to minimize idling time, establish buffer areas around high emitting locations, etc. Lessening the effects of mobile source air toxics should be considered for projects with substantial construction-related MSAT emissions that are likely to occur over an extended building period, and for postconstruction scenarios where the NEPA analysis indicates potentially meaningful MSAT levels. Such mitigation efforts should be evaluated based on the circumstances associated with individual projects, and they may not be appropriate in all cases. However, there are a number of available mitigation strategies and solutions for countering the effects of MSAT emissions. The EPA has listed a number of approved diesel retrofit technologies; many of these can be deployed as emissions mitigation measures for equipment used in construction. This listing can be found at: Source: FasTracks I-225 Team, Energy Transportation consumes a substantial amount of energy, so major changes to the transportation system can dramatically affect energy resources (increased transit use) Affected Environment The most common energy sources for transportation in the project region are petroleum fuels for on-road vehicles and electricity for LRT. Currently, approximately 90 percent of RTD buses operate on diesel fuel and 10 percent on compressed natural gas (CNG). All of the existing LRT system operates on electricity. There is an extensive infrastructure throughout the nation for producing and distributing petroleum fuels and CNG. About two dozen refineries operate in Colorado or nearby states. Recent federal legislation has mandated improved vehicle fuel economy, which could lessen fuel demand; however, this trend competes with an increasing number of vehicles overall. Colorado is one of the top ten producers of natural gas in the nation, which has extensive natural gas reserves. Electricity to operate RTD s LRT is from Xcel Energy. Xcel currently operates 11 combustion power plants in Colorado with additional wind farms and hydroelectric facilities (Xcel, 2009). Xcel produces approximately 75 percent of its electricity needs and purchases the other 25 percent from other suppliers. In 2007, Xcel s power generation was from four primary sources (Xcel, 2009): Low-sulfur coal 49 percent Oil and gas 31 percent Nuclear 11 percent Renewable sources 9 percent Air Quality and Energy Page 3-111
118 Renewable sources include solar, wind, hydroelectric, refuse-derived fuel and biomass Impact Evaluation This section summarizes an evaluation of the predicted differences in regional energy consumption between the No-Action Alternative and the Preferred Alternative based on traffic and ridership projections for 2015 and The evaluation assumes: VMT data from the DRCOG regional travel demand model. Energy consumption in BTU is based on changes in VMT. The corridor VMT was separated into passenger miles, heavy truck miles, bus miles and LRT to account for differences in energy consumption levels. The BTU consumption from each category of VMT (FTA, 2006) is: One passenger vehicle mile = 6,233 BTU One heavy-duty truck mile = 22,046 BTU One diesel or CNG bus mile = 41,655 BTU One LRT mile = 77,739 BTU No-Action Alternative The No-Action Alternative assumes that existing and committed improvements (Chapter 2) would be implemented by others as planned. Tables and list the 2015 and 2035 corridor energy consumption, respectively, for the No-Action Alternative. The No-Action Alternative would consume slightly less energy than the Preferred Alternative in 2015 and Table Energy Consumption for the No-Action and Preferred Alternatives 1 Vehicle Type No-Action Alternative (million BTU of miles) Preferred Alternative (million BTU of miles) Passenger Vehicles 154,515, ,467, Commercial Trucks 12,932, ,932, Bus (Diesel) 2,088, ,089, Bus (CNG) 14, , Light Rail 492, , Total 170,044, ,079, Difference in BTUs from No- Action Not applicable 34,816 Percent Change in BTUs from No-Action Not applicable Source: FasTracks I-225 Team, All numbers rounded to the nearest whole number. Air Quality and Energy Page 3-112
119 Table Energy Consumption for the No-Action and Preferred Alternatives 1 Vehicle Type No-Action Alternative (million BTUs) Passenger Vehicles 217,221, ,098,285 Commercial Trucks 15,737,689 15,737,689 Bus (Diesel) 2,060,243 2,166,109 Bus (CNG) 14,079 14,079 Light Rail 481, ,039 Total 235,514, ,634,201 Difference in BTUs from No-Action Not applicable 119,435 Percent Change in BTUs from No-Action Not applicable 0.05 Source: FasTracks I-225 Team, All numbers rounded to the nearest whole number. Preferred Alternative (million BTUs) Indirect Impacts Continued development and populations increases in the study area would result in additional demand for energy in several forms, including construction of new homes, electricity for utilities, and gasoline for automobiles. Cumulative Impacts Energy consumption has steadily increased over the last 50 years as a result of increased population in the Metro Region. This has resulted in construction of new power plants to meet these energy needs. The No-Action Alternative would require proportionate increases in energy to meet the 2035 population growth, meaning the difference in cumulative impacts between the No-Action and Preferred Alternatives would be negligible. Preferred Alternative As discussed previously, the Preferred Alternative is expected to result in slightly more regional energy consumption than the No-Action Alternative. There would be an increase in energy consumption of 6,641 million BTU and 119,535 million BTU in 2015 and 2035, respectively, or a negligible increase of 0.05 percent, compared to the No-Action Alternative (Tables and 3.9.7). Indirect Impacts Indirect impacts associated with the Preferred Alternative area generally the result of TOD related to planned stations. The regional energy requirements to serve this population may be slightly less than for the No-Action Alternative because of smaller residences in redeveloped neighborhoods, decreased dependence on automobiles, and increase in transit use. Temporary Construction Impacts Energy used for construction activities is generally in the form of fossil fuels for construction equipment. The construction projects considered for the No-Action Alternative analysis are listed in Table and for the Preferred Alternative analysis in Table Air Quality and Energy Page 3-113
120 Table Energy Consumed during the Construction of the No-Action Alternative 1 Miles of New No-Action Component Roadway or Rail 2 Total BTU (millions) 3 I-225 Widening Parker Road to 6 th Avenue 6 141,737 I-225/Colfax Avenue Interchange 2 62,826 Reconstruct Montview Boulevard 1 13,885 Build RTD Transit System 112 1,378,075 Martin Luther King Boulevard Extension 1 13,885 I-70 Scheduled Improvements 1 72,312 Total ,682,720 Source: FasTracks I-225 Team, All numbers in millions. 2 Assumed miles based on approximate project limits, not on design documents. 3 Numbers have been rounded to the nearest whole number, calculation is based on actual numbers. Table Energy Consumed during the Construction of the Preferred Alternative 1 Construction Component Track Miles 2 BTU per Track Mile (millions) Total BTU (millions) LRT At-Grade 8 12,290 98,320 LRT On Retained Fill , ,587 LRT On Aerial Structure ,460 44,368 Roads At-Grade ,885 44,432 Total Energy ,707 Source FasTracks I-225 Team, The energy estimate assumes that 70 percent of the project energy (in BTU) would be for guideway construction, with the remaining 30 percent for systems. 2 Approximate miles of double track. 3 Assumes that construction on retained fill uses more energy then at-grade construction but less than construction on aerial structures. Cumulative Impacts Implementation of the Preferred Alternative and the No-Action Alternative would result in comparable, regional energy consumption increases as population continues to grow. Nevertheless, possible TOD associated with the Preferred Alternative may result in smaller, more energy efficient homes and more efficient uses of public infrastructure. The Preferred Alternative would result in a negligible increase in energy, but overall the entire FasTracks Plan would result in an energy use reduction (RTD, 2007). Air Quality and Energy Page 3-114
121 Mitigation Measures Mitigation techniques to reduce energy usage are described in Table Table Summarization of Energy Impacts and Mitigation Measures Impacts Direct Impacts Increase in energy consumption of 0.02 percent in 2015, and 0.05 percent in 2035 compared to the No-Action Alternative Indirect Impacts No indirect impacts Temporary Construction Impacts Use of energy resources during construction and operations Source: FasTracks I-225 Team, 2009 Mitigation Measures Design efforts to reduce energy consumption and overall VMT, including: Creating multiple access points for parking lots, where possible. Carefully designing kiss-n-ride drop-offs to maximize efficiency and minimize number of vehicles idling. Positioning stations to be more easily accessible by pedestrians and bicyclists. park-n-ride improvements to decrease energy consumption consistent with RTD s sustainability policy. Require RTD drivers to shut down during periods of long idling where appropriate. No mitigation required No mitigation required Air Quality and Energy Page 3-115

122 3.10 Noise and Vibration This section describes the analyses performed to assess impacts from noise and vibration from rail transit to properties (i.e., receivers ) near the project corridor. The purpose of the analyses is to determine whether any receivers near the corridor would be impacted by either noise or vibration from the Preferred Alternative according to RTD or FTA guidelines. The analyses were based on noise levels in A-weighted decibels (dba) and on vibration levels in vibration decibels (VdB). This noise assessment was performed in accordance with FTA s Transit Noise and Vibration Impact Assessment (2006) Noise This section provides an assessment of existing noise levels and sensitive receptors, and predicts noise levels and impacts as a result of the Preferred Alternative. Transit noise exposure, vibration exposure, and level of impact are determined by the transit system operations and its proximity to sensitive sites (called noise sensitive receptors). The metrics most commonly used to express noise levels are the Hourly Equivalent Sound Level (L eq [h]) and the day-night average sound level (L dn ). The L eq (h) measure describes the average cumulative exposure experienced at a location from all noise producing events over a 1-hour period. The Ldn is the weighted average noise level over a 24-hour period. Noisesensitive land uses are described below. The LRT noise analyses were carried out in conformance with procedures prescribed by FTA (FTA, 2006) for a General Noise Assessment. The LRT analyses consisted of a combination of field measurements of existing conditions and calculations of future conditions with the LRT in place. Overall, the General Assessment is a conservative evaluation used to identify potential impacts, followed by a detailed analysis in final design. Figure shows the three categories considered for FTA noise-sensitive land uses: Category 1 Buildings or parks where quiet is an essential element of their purpose Category 2 Residences and buildings where people normally sleep, including hospitals and hotels where nighttime sensitivity is assumed to be of utmost importance Category 3 Institutional land uses with primarily daytime and evening use, such as schools libraries, churches, and active parks Figure FTA Noise Impact Criteria for Transit Projects Noise and Vibration Page 3-116
123 Ldn is used to characterize noise exposure for residential areas (Category 2), while the 1-hour Leq is used to evaluate noise levels for Categories 1 and 3. Following FTA s Transit Noise and Vibration Impact Assessment (2006), only sensitive receiver sites located within 350-feet of the centerline of the proposed LRT track were evaluated for possible impacts. This distance was reduced to 175-feet for locations where there is an existing noise wall located between the proposed track and the receivers. The noise level thresholds that determine transit noise impacts are variable, depending on existing noise exposure and the project s predicted future noise exposure. There are two levels of impacts possible with the FTA noise criteria: Moderate Impact: In this range of noise impact, the change in the cumulative noise level is noticeable to most people but may not be sufficient to cause strong, adverse reactions from the community. In this transitional area, other project-specific factors must be considered to determine the magnitude of the impact and the need for mitigation. Severe Impact: Project-generated noise in the severe impact range can be expected to cause a significant percentage of people to be highly annoyed by the new noise and represents the most compelling need for mitigation. Noise mitigation would normally be specified for severe impact areas unless there are truly extenuating circumstances which prevent it. There are also separate FTA criteria for ground-borne noise, i.e., the rumble that can be radiated from room surfaces in buildings due to ground-borne vibration. Because airborne noise often masks ground-borne noise for above ground rail systems, ground-borne noise criteria are primarily important with subway operations where airborne noise is not a factor, which is not the case with this project. Finally, when noise impacts are identified for a project, the consideration and adoption of mitigation measures are based on site characteristics such as the number of receivers, the noise sensitivity of the property, the increase over existing noise levels, the effectiveness of mitigation measures, the effect of mitigation measures on the community view, special protection provided by law, and cost (RTD, 2008) Affected Environment The project corridor is varied in existing noise levels, land use types, and topography. Existing conditions for each corridor section are given below. Section 1 Nine Mile to Exposition The proposed LRT alignment is within the east side of the I-225 right-of-way. I-225 traffic is the dominant noise source in this section. On the west side there are existing noise walls present from Parker Road to Yale Avenue. There is also a berm from just north of Yale Avenue to approximately 2550 South Xanadu Way. Another noise barrier starts just north of Iliff Avenue and continues just past Jewell Avenue, while another extends from Mississippi Avenue to Alameda Avenue. On the east side of the highway, noise barriers begin at approximately 3100 South Heather Gardens Parkway to Yale Avenue. The land uses in this section primarily include residences, hotels, offices, medical buildings, and retail space. Eleven locations were monitored for 24-hours each to obtain L dn values and another 15 locations were monitored for one hour each to obtain L eq noise levels. The measured Noise and Vibration Page 3-117
124 ambient noise levels range from 58 dba at residential properties on the west side of I-225 to 72 dba at office buildings on the east side of I-225. The lowest noise levels occur at sites that do not have direct exposure to I-225 traffic due to a noise barrier, an earth berm or the depressed elevation of I-225, while the highest noise levels are at sites directly exposed to I-225. Section 2 City Center The proposed LRT line will be at grade within the rights-of-way of Exposition Avenue, Sable Boulevard, and Ellsworth Avenue. Street traffic is the dominant noise source in this section. There are no noise barriers in this section. Land uses along these streets include residences, retail shops, the Town Center at Aurora and offices. Three sites were monitored for L dn values and another four sites were monitored for L eq values. The lowest ambient noise level measured was 63 dba at a site along Ellsworth Avenue and the highest noise levels were 70 dba at two sites near I-225. Section 3 Ellsworth to Fitzsimons/Montview The proposed LRT line will be on the east side of I-225 until it crosses under I-225 near 13 th Avenue. The proposed alignment then turns north along the west side of I-225 to Fitzsimons Parkway. I-225 traffic is the dominant noise source for most of this section. There are no noise barriers along this section. Land uses in this area include residences, hotels, vacant land and office buildings. L dn values were obtained from six locations within this section and L eq values were measured at another six sites. The ambient noise levels ranged from 59 dba to 72 dba. Section 4 Fitzsimons/Montview to Peoria/Smith The proposed LRT line will run along the east side of Fitzsimons Parkway before turning west within the Montview Boulevard right-of-way to Peoria Street. The proposed LRT line will run along the Peoria Street right-of-way to the Peoria/Smith Street Station of the East Corridor FasTracks project. Street traffic is the dominant noise source in this section. There are no existing noise barriers. Along this section, the land uses consist of residences, offices, medical facilities, a library, a school and parks. This area is planned for extensive redevelopment. Four sites were monitored overnight for L dn levels and two locations were monitored for L eq levels. The lowest noise level for this section was 57 dba and the highest noise level was 73 dba Impact Evaluation The LRT noise impact evaluation was performed according to the FTA General Noise Assessment. For the analyses, noise levels are measured at various locations along the corridor to determine existing noise conditions within the study area and corresponding project-specific noise levels from the Preferred Alternative are calculated for these areas for comparison to determine impacts (Figure ). Each location was selected to represent a cluster of potential receivers with similar characteristics. Following FTA guidelines, only sensitive receiver sites located within 350-feet of the centerline of the proposed LRT track were evaluated for possible impacts. This analysis distance was reduced to 175-feet for locations where there is an existing noise wall located between the proposed track and the receivers. Noise and Vibration Page 3-118
125 Calculations of noise levels from the project are based primarily on train frequency and speed, but also include other operating characteristics such as horns and train size. Based on RTD s proposed operating plan, horn and bell use at signalized intersections will be for emergency situations only, per the discretion of the train operator. Receivers close to the Iliff Avenue, 13 th Avenue and Montview Boulevard stations were modeled for noise levels that included warning bells for approaching trains. No-Action Alternative The No-Action Alternative is discussed in detail in Chapter 2. The No-Action Alternative would not result in direct impacts to noise because no I-225 corridor LRT facilities would be constructed. Other transportation projects included in the No-Action transportation network may have impacts to noise. The impacts of these other projects have been or will be considered in the NEPA process for each of these projects, and avoidance, minimization, and/or mitigation specified, as appropriate, in the specific NEPA decision documents for each project. Indirect Impacts The No-Action Alternative would not result in indirect impacts to noise. Cumulative Impacts No cumulative noise impacts would occur as a result of the No-Action Alternative. Preferred Alternative The Preferred Alternative is discussed in detail in Chapter 2. Noise levels for the LRT were predicted for multiple receivers within each section according to FTA procedures. Noise levels produced from development of park-n-ride locations would be determined by the detailed development plans for each site. As design progresses, additional detailed noise analysis will be performed, including wheel squeal analysis, to determine if mitigation is warranted. Section 1 Nine Mile to Exposition Twenty-seven locations were modeled for potential LRT noise impact. The predicted project noise levels from the LRT ranged from 48 dba to 62 dba which results in no impacts to any of the receivers. Section 2 City Center Thirteen locations were modeled for potential LRT noise impact. The predicted project noise levels from the LRT ranged from 36 dba to 60 dba, which results in no impacts to any of the receivers. Section 3 Ellsworth to Fitzsimons/Montview Seven locations were modeled for potential LRT noise impact. The predicted project noise levels from the LRT ranged from 42 dba to 53 dba with no impact to any of the receivers. Section 4 Fitzsimons/Montview to Peoria/Smith Eighteen locations were modeled for potential LRT noise impact. The predicted project noise levels from the LRT ranged from 43 dba to 59 dba. Impacts (moderate) were predicted only for receivers R55 (future hotel) and R56 (library), on the Fitzsimons Campus (Figure ). Because the impacts would be moderate, FTA mitigation guidance for severe impacts does not apply in this case (less than 65 db). Noise impacts designated as moderate require consideration and adoption of mitigation measures when it is considered reasonable. According to RTD policy, noise mitigation is not Noise and Vibration Page 3-119
126 considered feasible if the noise impact is not within the top 50 percent of the moderate impact range. Since R55 and R56, were in the lower half of the range, mitigation was not recommended at this time. Figure Noise Modeled Locations, Fitzsimons Campus Source: Fastracks I-225 Team, 2009 Train Wheel Squeal The FTA General Assessment does not account for train wheel squeal. FTA guidance indicates that wheel squeal should be evaluated through detailed assessment to be conducted based on detailed design information. Wheel squeal occurs around sharp curves and may impact receivers near sharp curves. Curve squeal is highly variable depending on curve radius, train speed and weather conditions. In general, a standard steel wheel on a steel rail system will tend to squeal at curves with radii less than 100 times the truck wheelbase (the distance between axels on the truck at either end of the LRT vehicle). In the case of RTD LRT vehicles, the truck wheelbase is approximately six feet; therefore, wheel squeal may occur on curves with radii of 600 feet or less. Based on initial conceptual design, there may be 27 locations along the LRT alignment with curve radii of 600 feet or less, of which 5 locations are adjacent to Category 1 or Category 2 noise sensitive land uses. Noise and Vibration Page 3-120
127 The Preferred Alternative includes a number of tight curves, thus, wheel squeal is a concern for the corridor warranting detailed assessment. Wheel squeal will, therefore, be analyzed as part of the FTA Detailed Analysis conducted at the 65 percent and 90 percent design submittals, or equivalent submittals as part of the design-build process. Where impacts from curve squeal are identified in the detailed assessment, mitigation measures will be evaluated and included in the final design, as appropriate. Indirect Impacts The Preferred Alternative would not result in indirect impacts to noise. Temporary Construction Impacts Construction noise would present the potential for short-term impacts to those receptors located along the corridor, near station locations, and along designated construction access routes. It is possible that some construction could occur at night to minimize disruption to traffic. The primary source of construction noise is expected to be diesel-powered equipment such as trucks and earth moving equipment, as well as shorter-term but intense activities such as bridge demolitions, bridge foundations, wall construction and trackwork construction. Construction presents the potential for increased noise for area residents and businesses. Cumulative Impacts No cumulative noise impacts would occur as a result of the as a result of the Preferred Alternative. As urbanization continues, increased traffic, and to some extent traffic congestion, will continue to have an impact on perceived noise levels Mitigation Measures Table summarizes the noise mitigation measures. Table Summarization of Noise Impact and Mitigation Measures Impact Direct Impacts Two moderate impact locations Indirect Impacts No indirect impacts Temporary Construction Impacts Noise impacts associated with construction Mitigation Measures Mitigation not considered feasible because not within top 50 percent of moderate impact range. Additional detailed noise analysis will be completed at 65 and 90 percent design, or equivalent submittals as part of the design-build process. No mitigation required. Minimize nighttime construction in residential neighborhoods. Locate stationary construction equipment as far as possible from noise-sensitive sites. Construct noise barriers, such as temporary walls or piles of excavated material, between noisy activities and noise-sensitive receivers. Re-route construction-related truck traffic along roadways that will cause the least disturbance to residents. Noise and Vibration Page 3-121
128 Programmatic Mitigation Measures Construction Mitigation Construction noise will be controlled through a Best Management approach. First, construction activities will need to comply with local noise ordinances. Also, routine and economical steps can be taken to minimize the effect of construction noise on neighbors and sensitive receivers while not affecting construction schedules. These may include could: Communicate early on with the general public to reduce the number of noise complaints. Inform the public of any potential construction noise impacts and the measure that will be employed to reduce these impacts. Also, establish and publicize a responsive complaint mechanism for the duration of the construction. Construct sound barriers required for mitigation of noise impacts by the corridor s final decision document or environmental evaluation prior to transit line construction (where possible from a construction staging perspective). Minimize construction duration in residential areas, as much as possible. Minimize nighttime activities in residential areas, as much as possible. Re-route truck traffic away from residential streets, where possible. Combine noisy operations to occur in the same time period. Use well-maintained equipment equipped with modern mufflers. Noise blankets on equipment and/or quiet-use generators. Noise blankets (also called acoustic wraps ) are removable and reusable sound barriers made from compost materials like Teflon impregnated cloth. The blankets are custom-fit to encapsulate the noisy equipment and block sounds at the source. These are commonly used on equipment such as fans and blowers, compressor housings, hydraulic pumps, etc. They are very effective because they block the source of the noise. Use alternative construction methods, such as sonic or vibratory pile driving in noise sensitive areas. Pile driving and other high-noise activities during daytime construction (generally 7am to 7pm), where possible. When construction time is restricted to certain daytime hours, the overall duration of project construction would likely increase. Each municipality adjacent to the corridor (i.e. City of Aurora, City and County of Denver) will be contacted during final design to determine if they have noise ordinances or maximum permissible sound pressure levels emitted from construction equipment and to what hours the guidelines apply. The contractor will be required by contract agreement, to submit a work plan outlining work schedules, traffic control, access provisions, and intended mitigation measures prior to initiating construction. Potential mitigation strategies may include: Operation Mitigation at the Source: Stringent vehicle and equipment noise specifications Operational restrictions Resilient or damped wheels Vehicle skirts Undercar absorption Spin-slide control (prevents flats) Wheel truing (eliminates wheel flats) Turn radii greater than 1,000 feet Rail lubrication on sharp curves Movable-point frogs Operation Mitigation along the Path: Sound barriers close to vehicles Sound barriers at right-of-way line Alteration of horizontal and vertical alignments Acquisition of buffer zones Ballast on at-grade guideway Ballast on aerial guideway Resilient track support on aerial guideway Source: I-225 FasTracks Team, 2009 Noise and Vibration Page 3-122
129 Vibration This section describes the analyses performed to assess potential future LRT vibration at properties (i.e., receivers ) near the Preferred Alternative. The purpose of the analyses is to determine whether any receivers near the corridor may be impacted by the Preferred Alternative Vibration is a fine movement or low rumble that is radiated through the ground and is felt in the motion of room surfaces. The unit of measure is VdB, which is used to measures vibrationrelated decibels. Typical background vibration is about 52 VdB. By comparison, a bulldozer would cause vibration of approximately 92 VdB. The limit of vibration-sensitive equipment is about 65 VdB, and the planning threshold for residential annoyance is 72 VdB. Human sensitivity to vibration typically corresponds best to the amplitude of vibration velocity within the frequency range 4 to 80 Hertz (Hz). Therefore, velocity is the preferred measure for evaluating potential ground-borne vibration impact from transit projects. Figure illustrates typical ground-borne vibration levels for common sources as well as human response to ground-borne vibration. As shown, the range of interest is from approximately 50 to 100 VdB, from imperceptible background vibration to the threshold of building damage. Although the approximate threshold of human perception is 65 VdB, annoyance is usually not significant unless the vibration exceeds 70 VdB. Figure Typical Ground-Borne Vibration Levels and Responses Human/Structural Response VELOCITY LEVEL* Typical Sources (50 ft from source) Threshold, minor cosmetic damage fragile buildings 100 Blasting from construction projects Difficulty with tasks such as reading a VDT screen 90 Bulldozers and other heavy tracked construction equipment High speed rail, upper range Residential annoyance, infrequent events (e.g., commuter rail) Residential annoyance, frequent events (e.g., rapid transit) Rapid transit, upper range High speed rail, typical Bus or truck over bump Limit for vibration sensitive equipment. Approx. threshold for human perception of vibration 60 Bus or truck, typical 50 Typical background vibration * RMS Vibration Velocity Level in VdB relative to 10-6 inches/second Source: FTA, 2006 Noise and Vibration Page 3-123
130 The FTA ground-borne vibration impact criteria are based on land use and train frequency (Table ). Some buildings may not fit into these categories and may warrant special attention during the impact evaluation process, as is the case at the Anschutz/Fitzsimons Medical Campus. For this, FTA has also established procedures for conducting detailed vibration analyses in terms of one-third octave band frequencies, which were used for this project. For residential buildings at night, the applicable criterion is 72 VdB (Table ), but in one-third octave bands from 8 to 80 Hz. There are also criteria for several vibration categories (VC) of sensitive equipment (Table ). Table Ground-Borne Noise and Vibration Impact Criteria by Land Use Category Land Use Category Frequent Events 1 Vibration Impact Criterion Occasional Events 2 Infrequent Events3 Category 1: Buildings where vibrations would interfere with 65 VdB 4 65 VdB 4 65 VdB 4 interior operations. Category 2: Residences and buildings where people normally 72 VdB 75 VdB 80 VdB sleep. Category 3: Institutional land uses with primarily daytime use. 75 VdB 78 VdB 83 VdB Source: FTA, 2006 Notes: 1 More than 70 vibration events of the same source per day. Most rapid transit projects fall into this category. 2 Between 30 and 70 vibration events of the same source per day. 3 Fewer than 30 vibration events of the same kind per day. 4 Based on levels that are acceptable for most moderately sensitive equipment such as optical microscopes. Vibrationsensitive manufacturing or research requires detailed evaluation. Table Criteria for Detailed Vibration Analysis Category Residential- Day Residential- Night Maximum Level (VdB) VC-A 66 VC-B 60 VC-C 54 VC-D 48 Description and Application Barely felt vibration. Also adequate for computer equipment and low-power optical microscopes (up to 20X). Vibration not felt, but ground-borne noise may be audible inside quiet rooms. Suitable for medium-power optical microscopes (100X) and other equipment of low sensitivity. Adequate for medium-to high-power optical microscopes (400X), microbalances, optical balances, and similar specialized equipment. Adequate for high-power optical microscopes (1000X), inspection and lithography equipment to 3 micron line widths. Appropriate for most lithography and inspection equipment to 1micron line width. Suitable in most instances for the most demanding equipment, including electron microscopes operating to the limits of their capability. VC-E 42 The most demanding criterion for extremely vibration-sensitive equipment. Source: FTA, 2006 Noise and Vibration Page 3-124
131 Affected Environment The potential sensitive receivers for LRT vibration essentially mirror those for LRT noise, i.e., the Category 1, 2 and 3 properties along the proposed corridor. Of these, only residential properties within about 50 feet from LRT have the potential for vibration impacts. A special consideration for transit vibration is the Anschutz/Fitzsimons Medical Campus. A number of sophisticated and potentially vibration-sensitive instruments may be installed at the Campus. For this reason, a detailed FTA vibration analysis was performed for this portion of the project corridor. None of these instruments are currently known to be within range of vibration impacts from the proposed LRT alignment, but as the Anschutz/Fitzsimons Medical Campus develops, ongoing coordination will be important for avoiding conflicts. Existing vibration sources in the project corridor include cars, trucks and buses on the streets and highways. However, vibrations from street traffic generally would not be perceptible at receivers along the alignment unless there are major bumps or other uneven surfaces nearby. FTA vibration impact criteria do not depend on existing vibration levels, but instead focus on the vibration generated by the new transit source. Therefore, measurements of existing vibration levels along the proposed corridor are not necessary. However, in recognition of the potential for vibration-sensitive equipment at the Anschutz/Fitzsimons Medical Campus, an ambient vibration measurement and an outdoor-to-indoor vibration measurement were performed Impact Evaluation The FTA methodology predicts potential vibration impacts through vibration propagation data from on-site field measurement and measured force densities of the proposed transit source (existing RTD LRT vehicles). Vibration propagation tests were performed at eight sites along the corridor. Force density was measured at an LRT site between the current Dry Creek and County Line Road stations. Predicted impacts are based on these inputs. Potential vibration impacts were assessed in accordance with the FTA manual (FTA, 2006). No-Action Alternative The No-Action Alternative is discussed in detail in Chapter 2. The No-Action Alternative would not result in direct impacts to vibration because no I-225 corridor LRT facilities would be constructed. Other transportation projects included in the No-Action transportation network may have impacts to vibration. The impacts of these other projects have been or will be considered in the NEPA process for each of these projects, and avoidance, minimization, and/or mitigation specifies as appropriate in the specific NEPA decision documents for each project. Indirect Impacts No indirect vibration impacts are projected for the No-Action Alternative. Cumulative Impacts No cumulative vibration impacts would occur as a result of the No-Action Alternative. Preferred Alternative The Preferred Alternative is discussed in detail in Chapter 2. Impacts were assessed based on a comparison of the predicted project vibration level with the FTA impact criterion. These results indicate that for LRT speeds up to 55 mph, the residential vibration criterion would be met (i.e.; vibration impacts would not occur) at residences more than 25 feet from the centerline of the Noise and Vibration Page 3-125
132 nearest rails. No residential uses are known or expected to be within 25 feet of the LRT rails. Therefore, no residences are expected to be impacted by transit vibration. Impacts are only expected in Section 4. Section 4 includes the Anschutz/Fitzsimons Medical Campus, which currently has, or as part of their redevelopment is planning to host, medical research activities that involve sensitive equipment. Once construction is complete, sensitive equipment on the Anschutz/Fitzsimons Campus should be located outside areas of identified vibration impact for sensitive equipment (Figure ). If the equipment is located farther from the rails than the impact distance, no impacts are expected. If the equipment is located within the impact distance, impacts are possible and a detailed analysis specific to the site in question would be needed. The distances to various impact criteria are presented in Table These impacts could vary as the train speed utilized in the vibration model could be less than the actual speed on Opening Day therefore reducing the potential vibration impacts. Table Distances to Potential Vibration Impacts for Sensitive Equipment FTA Impact Criterion Distance from the Near Track Centerline to Vibration Impact for Sensitive Equipment at Train Speeds of 30 mph (feet) Site V-4 Site V-5 PPS a Site V-7 Site V-8 Average Residential-Night < VC-A VC-B VC-C VC-D b Source: FasTracks I-225 Team, 2009 a Future Pharmacy and Pharmaceutical Sciences Building b This result is not included in the average due to low coherence in the data Noise and Vibration Page 3-126
133 Figure Vibration within Anschutz/Fitzsimons Medical Campus Source: FasTracks I-225 Team, 2009 Indirect Impacts No indirect vibration impacts are projected for the Preferred Alternative. Temporary Construction Impacts Temporary vibration impacts under the Preferred Alternative may result from construction activities associated with utility relocation, grading, excavation, track work and installation of structures or systems components. Such impacts may occur in residential areas and at other vibration-sensitive land uses near the proposed alignment. The potential for vibration impact would be greatest at locations near pile driving for bridges and other structures and at locations close to vibratory compactor operations. Cumulative Impacts No cumulative vibration impacts are expected to occur as a result of the Preferred Alternative. Noise and Vibration Page 3-127
134 Mitigation Measures Mitigation measures should be considered for Section 4 only. Vibration mitigation for the Preferred Action would only be necessary if sensitive equipment at the Anschutz/Fitzsimons Medical Campus is found to be impacted. There are mitigation options available for both the sources and the receivers. Mitigation will be determined in coordination with the Anschutz/Fitzsimons Medical Campus once locations of sensitive equipment are established. Table summarizes vibration impacts and mitigation measures from the Preferred Alternative. Table Summarization of Vibration Impacts and Mitigation Measures Impacts Direct Impacts Potential for vibration impacts depending on the future location of sensitive equipment within Anschutz/Fitzsimons Medical Campus Indirect Impacts No indirect impacts Temporary Construction Impacts Vibration level from construction activities Mitigation Measures Vibration mitigation measures will include continued coordination with stakeholders within vibration impact areas or who own sensitive equipment No mitigation required Minimize nighttime construction in neighborhoods Explore alternative construction methods to minimize the use of impact and vibratory equipment such as pile drivers and compactors Re-route construction truck traffic along roadways that will create the least disturbance to residents Programmatic Mitigation Measures Vibration Mitigation at the Source -It is expected that the LRT vehicle wheels and track will be maintained in good condition with regular wheel truing and rail grinding. Beyond general good maintenance measures, source mitigation options that RTD has identified for programmatic vibration mitigation include: Maintenance Rail grinding to avoid corrugated surfaces Wheel truing to re-contour the wheel, provide a smooth running surface and remove wheel flats Implement a vehicle reconditioning program for components such as suspension system, brakes, wheels, and slip-slide detectors Install wheel-flat detection systems to identify vehicles in need of wheel truing Planning and Design of Trackwork Re-locate special trackwork to a less sensitive area, when possible to do so without impeding operations Review crossover and turnout locations during preliminary engineering stage Use special devices at turnouts and crossovers that incorporate mechanisms to close the gap between running rails (especially frogs with spring loaded mechanisms and frogs with moveable points) Special Track Support Systems Ballast Mats Consists of a pad made of rubber or rubber line material placed on an asphalt or concrete base with the normal ballast, ties and rail on top. Floating slabs Thick concrete slabs supported by resilient pads on a concrete foundation. These are Noise and Vibration Page 3-128
135 typically used for subway treatments or when ballast mats are ineffective and are extremely expensive. Resilient fasteners Special direct-fixation fasteners (fastening the rail to concrete track slabs) with vertical stiffness of 30,000 lb/inch will reduce vibration by as much as 5 to 10 db at frequencies above 30 to 40Hz Resiliently supported ties Concrete ties supported by rubber pads, use resiliently supported ties to reduce low-frequency vibration in the 15Hz to 40Hz range. Shredded tires or tire derived aggregate Consists of 12 inches of tire shreds or chips wrapped with filter fabric and then covered with sub ballast and ballast. The vibration attenuation characteristics of this treatment are midway between that of ballast mats and floating slab track (described below). Building Modifications Property Acquisition or Easements Residences that are likely to be impacted by vibration or noise could be purchased or easements could be required by paying the homeowner to accept the future train vibration conditions. These mitigation measures should only be used in isolated cases. Support the building foundation on elastomer pads similar to bridge bearing pads (usually only possible for new construction) Operational Changes Reduce the speed Use the equipment that generates the lowest vibration levels only during the nighttime hours Adjust nighttime schedules to minimize movements in the most sensitive hours Vibration Mitigation at the site within Anschutz/Fitzsimons Medical Campus After site specific vibration analysis the following mitigation measures were deemed appropriate for the I- 225 LRT. These options for mitigating vibration impacts at the site could be implemented by property owners as facilities are developed on the Anschutz/Fitzsimons Medical Campus including: Equipment siting Locating sensitive equipment within research facilities is an important part of planning and many vibration sources (e.g., LRT, pedestrian traffic, rotating machinery) should be considered. It is advisable to site vibration-sensitive equipment as far away from these sources as possible. Placing sensitive equipment in larger masonry buildings can also provide vibration reduction. When possible, sensitive equipment should be located on slab floors or in the basement to avoid resonances associated with span floors. Vibration isolation pads Installing vibration isolation pads underneath sensitive equipment can be helpful in damping vibrations. Isolation should be specified to provide the optimal reduction at the frequencies of interest. This mitigation is usually effective for higher-frequency vibrations. Inertia blocks Sensitive equipment can be placed on inertia blocks, which are large concrete blocks isolated from the floor with a resilient material. The mass of the concrete is helpful in damping low-frequency vibrations. Inertia blocks are only feasible on slab floors on ground where such a block can be installed. Floating floors Floating floors are essentially a second floor supported by springs atop the original floor. Floating floors have the benefit of reducing vibration to the entire space, so that many pieces of equipment can benefit. Low-frequency vibration attenuation can be achieved with this mitigation option. Source: FasTracks I-225 Team, 2009 Noise and Vibration Page 3-129
136 3.11 Electro-magnetic Fields/Electro-magnetic Interference This section discusses existing conditions related to electro-magnetic fields (EMFs) within the study area and describes applicable regulations pertaining to the EMFs. An analysis of potential effects and mitigation measures related to EMFs is also included in this section. The electromagnetic field is a physical field produced by electrically charged objects. It affects the behavior of charged objects in the vicinity of the field. EMF/EMI was evaluated using an area extending 1,000 feet on either side of the LRT alignment plus a 0.5-mile radius from each station. Electro-magnetic Interference (EMI) occurs as unwanted disturbance generated by stray voltage affects electrical circuits, including systems and equipment reliant on electrical circuits. There is potential for sensitive electrical equipment to be affected by EMI. There is no threat from EMI to humans or other living things. Early in the EE scoping process, a concern was raised about potential EMI generated by the operation of the LRT system (i.e., the Preferred Alternative). Low frequency EMI, comprised of both electric and magnetic fields is generated by LRT and tends to have a large magnetic field component. The EMI is caused by direct current (DC) magnetic fields generated by the operation of the LRT, which are proportionate to the amount of propulsion power. As the train slows down and speeds up, there will be a corresponding change in the magnetic field level. This change of the magnetic field level can cause EMI to sensitive electrical equipment. Location of the sensitive electrical equipment in relation to the LRT is also important since the magnetic fields decrease quite rapidly with distance from the tracks Affected Environment Magnetic fields from the operation of the LRT were measured in the Spring of 2008 on an existing RTD LRT system. Tests were run to determine the amount of EMF generated from the trains and how the magnetic field varies as a function of distance from the track. Measurements were conducted to simulate the conditions of the Preferred Alternative with two LRT trains consisting of three cars each accelerating in opposite directions from a stopped position. The results are shown in Table Table Electromagnetic Field (EMF) Measurements adjacent to Operating LRT Distance from track centerline in feet Field strength in milligauss (mg) Sources: Front Range Systems Consultants, Project Field Data milligauss is the unit of measurement used to describe magnetic field fluctuations The effects of the EMI associated with the Preferred Alternative were assessed based on the results of the field measurements. Potential impacts were calculated by identifying sensitive receptors (i.e. locations of sensitive electrical equipment) within 2000 feet of the LRT alignment that may experience EMI. Electro-magnetic Fields/Electro-magnetic Interference Page 3-130
137 Impact Evaluation This section describes the impacts of the No-Action Alternative and Preferred Alternative for with regard to EMI No-Action Alternative The No-Action Alternative is described in detail in Chapter 2. The No-Action Alternative would not result in direct impacts to EMF/EMI because no I-225 corridor LRT facilities would be constructed. Other transportation projects included in the No-Action transportation network may have impacts to EMF/EMI. The impacts of these other projects have been or will be considered in the NEPA process for each of these projects, and avoidance, minimization, and/or mitigation specified, as appropriate, in the specific NEPA decision documents for each project. Indirect Impacts The No-Action Alternative would not result in indirect impacts from EMF/EMI. Cumulative Impacts No cumulative EMF/EMI impacts would occur as a result of the No-Action Alternative Preferred Alternative The Preferred Alternative is described in detail in Chapter 2. The Preferred Alternative would result in additional sources of EMF generation, including the electrically-powered LRT trains and traction power system and substations. The electro-magnetic environment would include elements such as conducted and radiated emissions, voltages, currents, power frequencies, electrical surges, switching, lighting and magnetic fields. Impacts are only anticipated in Section 4. Within Section 4 only one area has been identified as having sensitive receptors which could potentially be impacted by the proposed LRT operations. The Fitzsimons Life Science District and University of Colorado Denver Anschutz/Fitzsimons Medical Campus, located on the former Fitzsimons Army Medical Center, includes several organizations that comprise a stakeholder group. Organizations within the stakeholder group include: University of Colorado Denver, University of Colorado Hospital, Fitzsimons Redevelopment Authority, The Children s Hospital, and U.S. Veterans Health Administration. There are a number of buildings on the campus that are currently hosting or proposing to host medical research activities involving sensitive equipment. These buildings were identified by the Anschutz/Fitzsimons Stakeholder group during a series of meetings held to address the EMI issue. Information shows that only a limited variety of research equipment is sensitive to EMI below 5 mg, with the most sensitive instruments, Nuclear Magnetic Resonance (NMR) and electron Microscopes, susceptible to EMI of 0.1 mg. Existing conditions at the Anschutz/Fitzsimons Medical Campus demonstrate that the ambient background EMF measures approximately 1.0 to 2.0 mg, therefore the most sensitive instruments would be affected regardless of the proposed LRT. Sites identified by the Anschutz/Fitzsimons stakeholder group that house sensitive equipment are located north of 17th Avenue and south of Montview Blvd. The proposed Pharmacy Building is located approximately 300 feet south of the Preferred Alternative, and is planned to operate some of the most sensitive research equipment, making it a special concern. Electro-magnetic Fields/Electro-magnetic Interference Page 3-131
138 Modeling the worst case scenario (three-car consists, accelerating at maximum speed in opposite directions) reveals that generally if all of the sensitive equipment was located south of 19th Avenue, it would not be affected by EMI from the LRT operations. In addition, most of the equipment located more than 300 feet away from the LRT would not experience EMI (FMS, 2008). Sensitive equipment located within 100 feet of the Preferred Alternative would be most susceptible to EMI (FMS, 2008) Even though the risk is generally low, there is one piece of research equipment planned for the proposed Pharmacy Building that could be impacted. This equipment is sensitive to EMI over 2mG. Impacts to other equipment were not identified at this time, however; for future expansion and planning of additional research facilities it is recommended that sensitive equipment be located south of 19th Avenue or greater than 300 feet from the LRT alignment. Indirect Impacts The Preferred Alternative would not result in indirect impacts from EMF/EMI. Temporary Construction Impacts Construction of the Preferred Alternative would not be expected to generate any significant EMI at any of the sensitive locations. Cumulative Impacts No cumulative EMF/EMI impacts are expected to occur as a result of the Preferred Alternative Mitigation Measures Table summarizes EMF/EMI impacts and mitigation measures from the Preferred Alternative. Electro-magnetic Fields/Electro-magnetic Interference Page 3-132
139 Table Summarization of EMF/EMI Impacts and Mitigation Measures Impacts Direct Impacts Impacts in Section 4 from additional EMF generation Indirect Impacts No indirect impact Temporary Construction Impacts No temporary construction impact Source: FasTracks I-225 Team, 2009 Mitigation Measures Operational standards for LRT an effective way to reduce EMI is to incorporate standing operating rules for the light rail trains, including slow acceleration from the stations and prohibiting simultaneous starts of two trains from the station. These rules which can be incorporated into RTD operating standards will reduce EMI. Split power supply - this source mitigation method reduces the strength of the magnetic field by moving positive and negative power feeds closer together to promote natural cancellation of electrical fields. This is done by burying an underground supply cable close to the rails (which is the negative return to the substation). RTD will implement a split power supply method technique along Montview Blvd. from east of the Montview Station to Peoria Street to provide mitigation for the proposed pharmacy building and to help minimize long term impacts from EMI to equipment in buildings which have not yet been constructed. Install empty conduit that could be used in the future to carry the underground supply cable for future EMI mitigation along Peoria Street from Montview Blvd north to Fitzsimons Parkway. During the studies, no impacts were identified in these areas but if future development identifies the need for some additional protection of sensitive equipment, the conduit would be available for implementation of the split power supply at a lower cost. No mitigation required No mitigation required EMF/EMI Mitigation within Anschutz/Fitzsimons Medical Campus Equipment siting by property owners by locating the potentially affected equipment farther from the source is the most cost effective way to mitigate the impact from EMI. Magnetic fields decrease with distance from the source. Locating the most sensitive equipment south of 19th or a minimum of 300 feet away would eliminate most of the EMI impact. Electro-magnetic Fields/Electro-magnetic Interference Page 3-133
140 3.12 Biological Resources This section describes biological resources in the vicinity of the Preferred Alternative, and describes the impact of the No-Action Alternative and the Preferred Alternation on these resources. Biological resources include: vegetation, noxious weeds, wildlife, and special status species. Biologic resources were evaluated using a 300 foot buffer extending on either side of the LRT alignment and from each station. Coordination with the Colorado Division of Wildlife (CDOW) and the U.S. Fish and Wildlife Service (USFWS) has been on-going throughout the development of the Preferred Alternative. Correspondence with the CDOW and USFWS is located in Appendix B Vegetation The term vegetation typically defines the collective plant cover. Vegetation communities are classified as distinct groupings of individual species that occur in areas with similar physical environmental characteristics Affected Environment The project is situated within Colorado s Eastern Plains, a portion of the Central Shortgrass Prairie (CSP) ecoregion, which covers one-third of the state of Colorado, from approximately I-25 east to the Kansas border (Bailey, 1995). Climate has been the primary driver affecting the vegetation and landscape within the CSP; however, urban expansion and frequent disturbances now dictate the vegetation and landscape. There are four vegetation community types for the project as described below. Shortgrass Prairie: The shortgrass prairie community includes a mixture of perennial and annual, native and non-native species, which have developed from long-term natural succession or seeding of former agricultural lands. The shortgrass prairie primarily consists of grasses that grow to approximately two feet tall. Both introduced and native species of forbs occur and are common throughout and dominant as patches. Riparian and Wetland: Riparian and wetland areas are associated with streams, flowing ditches, stormwater management features, and low areas where water pools. Wetlands are addressed specifically in Section This community type is present within each section of the project, primarily located adjacent and/or within unnamed stormwater drainage ditches, such as the High Line Canal, Toll Gate Creek and Sand Creek. Riparian and wetland areas are dominated by sandbar willow (Salix exigua), Baltic rush (Juncus balticus), broadleaf cattail (Typha latifolia), and sedges (Carex sp.). Overstory species common to this community are Russian olive (Elaeagnus angustifolia), eastern cottonwood (Populus deltoides), and Siberian elm (Ulmus pumila). Vegetation within prairie dog colonies: The vegetation within prairie dog colonies is controlled by populations of black-tailed prairie dogs (prairie dogs) (Cynomys ludovicianus) and is dominated by weedy forb species that are either eaten or cut short by the prairie dogs. Common vegetation species within prairie dog colonies include field bindweed (Convolvulus arvensis), Russian thistle (Salsola tragus), kochia (Kochia scoparia), and hoary cress (Cardaria draba). Prairie dog colonies occur on undeveloped lands, upland roadsides, and open space areas throughout all sections. Biological Resources Page 3-134
141 Urban: This community includes commercial and residential areas with lawns, horticultural trees, and shrubs. The vegetation in this community is frequently mowed, irrigated and possibly managed with herbicide treatments. Common vegetation species include Kentucky blue grass (Poa pratensis), common dandelion (Taraxicum officinale), green ash (Fraxinus pennsylvanica), and eastern cottonwood Impact Evaluation No-Action Alternative The No-Action Alternative is described in detail in Chapter 2. The No-Action Alternative would not result in direct impacts to vegetation because no I-225 corridor LRT facilities would be constructed. Other transportation projects included in the No-Action transportation network may have impacts to vegetation. The impacts of these other projects have been or will be considered in the NEPA process for each of these projects, and avoidance, minimization, and/or mitigation specified, as appropriate, in the specific NEPA decision documents for each project. Indirect Impacts There are no indirect impacts expected to vegetation. Cumulative Impacts Under the No-Action Alternative, some natural vegetated areas would be developed to accommodate the other local actions expected to occur. Although TOD would not occur around stations and given the urban and suburban nature of the area, this land likely would still be developed at some point in the future. Preferred Alternative The Preferred Alternative is described in detail in Chapter 2. Impacts to vegetation generally include the removal of vegetation due to construction activities, such as grading, heavy equipment operation, materials storage, and equipment staging. A large portion of the impacts to riparian vegetation would occur during the construction of bridge crossings. Disturbed soils may also be favorable for the spread of noxious weed species. Impacts would generally be limited to the project footprint and adjacent roadsides along I-225, median areas within the I-225 corridor, areas adjacent to auxiliary roads, and where stations would be constructed. Due to the human controlled (i.e. mowing, herbicide application) and constant changing nature of urban vegetation communities, quantification is difficult and is not shown below. Impacts expected to vegetation communities as a result of implementing the Preferred Alternative are presented in Table Biological Resources Page 3-135
142 Table Summary of Permanent Vegetation Impacts Shortgrass Prairie Impacted Area (Acres) Vegetation with Prairie Dog Colonies Alternative Riparian or Wetlands Nine Mile to Exposition No-Action Preferred City Center No-Action Preferred Ellsworth To Fitzsimons/Montview No-Action Preferred (0.28 riparian; 0.08 wetland) Fitzsimons/Montview to Peoria/Smith No-Action Preferred (0.55 riparian; wetland) Total (0.83 riparian; 0.12 wetland) Source: FasTracks I-225 Team, 2008 Indirect Impacts Increased TOD due to the presence of the Preferred Alternative would likely convert natural vegetated areas to developed land uses. Temporary Construction Impacts During construction of the Preferred Alternative, vegetation would be temporarily disturbed to accommodate equipment staging areas. Cumulative Impacts Increased development resulting from the Preferred Alternative and other local actions would convert natural vegetated areas to developed land uses. Nevertheless, the Preferred Alternative would encourage TOD around stations. This higher density development would help preserve vegetation resources at the fringe of Aurora where greenfields still exist Mitigation Measures Table summarizes vegetation impacts and mitigation measures of the Preferred Alternative. Biological Resources Page 3-136
143 Table Summarization of Vegetation Impacts and Mitigation Measures Impacts Direct Impacts Permanent impacts to vegetation Indirect Impacts Increased TOD and the conversion of natural areas Temporary Construction Impacts Disturbance to vegetation as a result of construction activities Source: FasTracks I-225 Team, Noxious Weeds Mitigation Measures Landscaping, such as trees, shrubs, lawns, perennials, and in some cases, native grasses, will be replaced in kind where it is removed in accordance with City of Aurora adopted standards and policies. Restoration of disturbed riparian habitat will include planting of native trees and shrubs, as well as seeding and regrading, in accordance with SB 40 requirements Native grasses and forbs will be seeded in riparian areas Trees within CDOT right-of-way will be replaced according to CDOT s tree replacement policy No mitigation required Installation of silt fences, erosion logs, temporary berms, and other Best Management Practices (BMPs) will be used to prevent degradation of habitats adjacent to the construction area by transport of eroded sediment Areas of temporary disturbance within the rightof-way will be seeded with an appropriate mixture of native grasses and forbs; and shrubs will be planted, where appropriate During construction, vehicle operation will be limited to the designated construction area, and the limits of the construction area will be fenced where they are adjacent to sensitive habitats including riparian areas, wetlands, and upland trees and shrubs The construction contractor must be trained and have previous experience in avoidance and the proper use of BMPs Affected Environment Noxious weeds are plant species not native to Colorado and are regulated under state law because they have negative impacts on crops, native plant communities, livestock, and/or the management of natural or agricultural areas. Fifteen state and/or county-listed noxious weeds were observed. Noxious weeds occur throughout all sections of the project; however, they rarely dominated vegetation communities. Biological Resources Page 3-137
144 Impact Evaluation No-Action Alternative The No-Action Alternative is described in detail in Chapter 2. The No-Action Alternative would not result in direct impacts to noxious weeds because no I-225 LRT facilities would be constructed. Other transportation projects included in the No-Action transportation network may have noxious weed impacts. The impacts of these other projects have been or will be considered in the NEPA process for each of these projects, and avoidance, minimization, and/or mitigation specified, as appropriate, in the specific NEPA decision documents for each project. Indirect Impacts The No-Action Alternative would not result in indirect impacts to noxious weeds. Cumulative Impacts During construction of other local actions, there is potential for the spread of noxious weeds to occur if Best Management Practices (BMPs) and local permitting requirements are not followed. Preferred Alternative The Preferred Alternative is described in detail in Chapter 2. Impacts from noxious weeds are similar for all project sections and are mostly related to construction activities as discussed below. Indirect Impacts The Preferred Alternative would not result in indirect impacts to noxious weeds. Temporary Construction Impacts During construction of the Preferred Alternative, there is the potential for the spread of noxious weeds to occur if BMPs are not appropriately implemented. Project-related construction may introduce new noxious weeds or increase the abundance of existing noxious weeds. Construction activities include mobilization of construction vehicles; excavation, and transport of borrow material and topsoil, land clearing, and reclamation. Removal of existing vegetation and disturbance of soils encourages germination and spread of weed seeds and roots. Airborne seeds from noxious weeds present in areas adjacent to the project may germinate in areas where vegetation has been removed. Without the implementation of a noxious weed management plan during and after construction, noxious weeds can persist or become established in reclaimed areas. Impacts from noxious weeds are primarily an issue when they have the potential to spread to open space, sensitive areas, or riparian and wetland areas. Cumulative Impacts During construction of the Preferred Alternative and other actions, there is potential for the spread of noxious weeds to occur. Private development projects would be expected to abide by local permits and BMPs, transportation projects would carry out mitigation as needed, and the Preferred Alternative would comply with the mitigation measures defined below Mitigation Measures Table summarizes noxious weed impacts and mitigation measures of the Preferred Alternative. Biological Resources Page 3-138
145 Table Summarization of Noxious Weed Impacts and Mitigation Measures Impacts Direct Impacts Potential for spread or introduction of noxious weeds Indirect Impacts No indirect impacts Temporary Construction Impacts Spread of/or introduction of noxious weeds Source: FasTracks I-225 Team, 2009 Mitigation Measures An Integrated Noxious Weed Management Plan will be developed during final design and will be implemented during construction and will include identification of noxious weeds, weed management goals and objectives, and preventive and control methods. Contractors vehicles will be inspected before they are used for construction to ensure they are free of soil and debris capable of transporting noxious weed seeds or roots. Noxious weeds observed in and near the construction area at the start of construction will be treated with herbicides or physically removed to prevent seeds from blowing into disturbed areas during construction. Periodic surveys will occur during the construction period to identify and treat noxious weed populations that have developed. Potential areas of topsoil salvage will be assessed for presence and abundance of noxious weeds prior to salvage. Topsoil from heavily infested areas will either be treated by spraying, taken offsite, or buried during construction. Areas of temporary disturbance will be reclaimed in phases throughout construction and seeded using a permanent native seed mixture. If areas are complete and permanent seeding cannot occur due to the time of year, mulch and mulch tackifier will be used for temporary erosion control until seeding can occur Only certified weed-free mulch and bales will be used. Weed control will use the principles of integrated pest management to treat target weed species efficiently and effectively by using a combination of two or more management techniques (biological, chemical, mechanical, and/or cultural), both during and after construction. Weed control methods will be selected based on the management goal for the species, the nature of the existing environment, and the methods recommended by Colorado State University, County Weed Boards, and other weed experts. The presence of important wildlife habitat or threatened and endangered species will be considered when choosing control methods. No mitigation required Same mitigation as direct impacts Biological Resources Page 3-139
146 Wildlife Wildlife resources are comprised of both native and introduced animal species including mammals, birds, reptiles, amphibians, and fish Affected Environment The vegetative communities in the vicinity of the project generally support species that are adapted to urban and disturbed habitats. Common mammals found include: coyote (Canis latrans), red fox (Vulpes vulpes), mule deer (Odocoileus virginianus), raccoon (Procyon lotor), and black-tailed prairie dog (prairie dog), and many different bird species, including raptors. The majority of bird species, including raptors are protected under the Migratory Bird Treaty Act (MBTA) and are discussed in Section The highest quality habitat for the greatest diversity of wildlife species in the study area include protected open space, parks, and riparian areas associated with the High Line Canal, Toll Gate Creek, and Sand Creek. However, wildlife species also rely on many different areas throughout the study area including the urban areas, prairie and upland roadway right-of-way, and large undeveloped parcels. Common fish, reptiles, and amphibians dependent on High Line Canal, Toll Gate Creek, and Sand Creek that are likely present include the fathead minnow (Pimephales promelas), common carp (Cyprinus carpio), and white sucker (Catostomus commersoni), snapping turtle (Chelydra serpentine), painted turtle (Chrysemys picta), Northern leopard frog (Rana pipiens), and common garter snake (Thamnophis sictalis). Reptiles may use both the open water areas and adjacent riparian habitat. Shore birds and waterfowl likely include mallard duck (Anas platyrhynchos), spotted sandpiper (Actitis macularia), Canada geese (Branta canadensis), great blue heron (Ardea herodias), and double-crested cormorants (Phalacrocorax auritus). Numerous aquatic invertebrates likely occur in the High Line Canal, Toll Gate Creek, and Sand Creek, a well as other wetland and open waters (i.e. Baranmor Ditch). These species are an important source of food for fish, birds, and reptiles. Aquatic invertebrates include crustaceans, such as crayfish, and insects, such as mayflies. Existing wildlife habitat has been highly fragmented by existing roads and commercial development, and is subject to effects from traffic and traffic noise. As such, the amount of habitat is limited, and movement or migration between different habitat areas is limited for some species, especially those with large ranging movement requirements. However, small remnants of functional prairie habitat (CDOT, 2000) and riparian areas exist. The riparian areas associated with the High Line Canal, Toll Gate Creek, Sand Creek, and parks facilitate movement of some urban wildlife, including mule deer (Odocoileus hemionus), muskrat (Ondatra zibethicus), coyote, beaver (Castor canadensis), king fisher (Alcedininae sp.), blue heron, and many other species (Fitzgerald et al., 1994). Species are also dependent on riparian areas and protected open space to meet a multitude of other needs (e.g. nesting, roosting, foraging). For instance, trees suitable for nesting birds, including raptors, are present in many of these areas. There is also a large undeveloped area adjacent to Toll Gate Creek and east of I-225 that provides suitable cover and forage for deer and larger mammals. Biological Resources Page 3-140
147 In urban areas, strips of shrubs, trees, or even grass along the banks of rivers and streams reduce the impact of adjacent land use. As part of the transitional area between terrestrial and aquatic systems, riparian buffers are structurally complex ecosystems that provide wildlife habitat and improve the wetland and aquatic communities they shelter. Riparian impacts are recognized as having serious implications to water quality and habitat. A total of five areas were identified as having riparian buffers and encompass approximately 8.05 acres, including riparian buffers surrounding the High Line Canal, Toll Gate Creek and Sand Creek Impact Evaluation No-Action Alternative The No-Action Alternative is described in detail in Chapter 2. The No-Action Alternative would not result in direct impacts to wildlife because no I-225 corridor LRT facilities would be constructed. Other transportation projects included in the No-Action transportation network may have impacts to wildlife. The impacts of these other projects have been or will be considered in the NEPA process for each of these projects, and avoidance, minimization, and/or mitigation specified, as appropriate, in the specific NEPA decision documents for each project. Indirect Impacts Movement through the area may be restricted due to the construction of other projects. Cumulative Impacts The projected population increases would place additional demands on vacant properties and open space. Urban development would be more dispersed under the No-Action Alternative than under the Preferred Alternative as there would be no TOD. These population increases would result in development of new housing and businesses on vacant lands and increased use of existing parks and open space. Over time, less property would be available for wildlife habitat, and wildlife would be forced farther to the fringes of development. Preferred Alternative Construction of the Preferred Alternative would reduce the quantity of wildlife habitat, primarily as a result of vegetation removal. These impacts would primarily be associated with the removal of riparian vegetation due to the culvert extension at the High Line Canal, and bridge crossings at Toll Gate Creek, and Sand Creek. Revegetation and tree replacement after construction would minimize the long-term effects due to loss of habitat. However, the construction of stations, new track, and parking lots result in a permanent loss of vegetation and habitat. The construction of the new LRT track and fencing/concrete barrier would further fragment the habitat, and would also cause additional visual and noise disturbance due to LRT activity. High Line Canal includes a culvert extension which would alter stream flow and water turbidity. Bridge piers would not be added in the Toll Gate Creek channel at either bridge crossings. The addition of two bridge piers within the Sand Creek channel would permanently affect aquatic habitat by altering streamflow, and water turbidity. Also, the construction of the bridge structures over Toll Gate Creek and Sand Creek would cause shading of aquatic habitat and altered water temperatures. Both shading and changes in water temperature directly affect the quality of aquatic habitat. Biological Resources Page 3-141
148 Potential impacts to fish and wildlife will be minimized through the implementation of BMPs and SB 40 requirements (Table ). SB 40 requires a certification from the CDOW when certain streams are impacted. The requirements are designed to protect riparian areas and replace them, as necessary, during construction. Indirect Impacts Increased TOD due to the presence of the Preferred Alternative would likely decrease connectivity of open space areas and land used for wildlife movement. Temporary Construction Impacts Construction activity is likely to temporarily displace animals from the construction zone and adjacent areas due to noise, human presence, and heavy equipment. Impacts would be temporary and would not affect long-term use of the areas by wildlife. Direct wildlife mortality of small terrestrial and burrowing animals could occur during construction-related ground clearing and earth-movement. Direct wildlife mortality due to collisions with vehicles of both large and small species could also occur during both construction and operation. The quality and quantity of aquatic habitat may be affected by construction activities associated with the Preferred Alternative. The Preferred Alternative would involve construction of three new bridges at Toll Gate Creek and Sand Creek. The crossing of the High Line Canal will involve the expansion of an existing culvert. Fish and other aquatic organisms would be affected by construction activities, including the temporary loss of habitat during the construction of the bridges and culvert, and other work within Toll Gate Creek and Sand Creek. Construction activities may cause direct mortality to low-mobility species, such as some reptiles and amphibians, due to heavy equipment. During construction, the removal of riparian vegetation would temporarily reduce stream bank stability, which could accelerate erosion and sedimentation into the Toll Gate Creek and Sand Creek, alter the in-stream aquatic habitat, and affect in-stream water temperatures. Cumulative Impacts The cumulative impact of the Preferred Alternative would be similar to the No-Action Alternative. Vacant land that now serves as generally marginal wildlife habitat would continue to be developed as the population increases through the year However, TOD stimulated by the Preferred Alternative would slightly modify this trend because some percentage of the new development would occur at higher densities. This would have a modest positive effect on wildlife as some vacant land would not be developed during the planning period Mitigation Measures Avoidance and Minimization Minimization efforts to help alleviate impacts to riparian and aquatic habitat included spanning Toll Gate Creek and Sand Creek. Common wildlife species that use the riparian corridors for daily or seasonal movements will benefit from the spanned bridge design at Toll Gate Creek and Sand Creek. Per Section 404 of the Clean Water Act (CWA), impacts to wetlands and water features must be avoided, minimized, or mitigated (in order of preference). The project team has worked to minimize wetland impacts early on in the environmental evaluation process. Later in Biological Resources Page 3-142
149 the process the design and environmental teams met twice to further discuss avoiding and minimizing impacts. Since most of the biological avoidance and minimization was related to wetlands and Waters of the U.S., this information is presented in Section 3.19, Table which summarizes the avoidance and minimization measures for the I-225 Corridor. Additionally, wildlife impacts resulting from the loss of vegetation will be minimized by implementing the mitigation measures described for vegetation in Table A summarization of impacts and mitigation measures relating to wildlife are discussed below in Table Table Summarization of Wildlife Impacts and Mitigation Measures Impacts Direct Impacts Impacts to wildlife and wildlife habitat, such as wetlands and riparian vegetation. Altered stream flow and turbidity in Sand Creek and High Line Canal. Indirect Impacts Increased TOD converting natural areas. Temporary Construction Impacts Temporary displacement of animals. Impacts to wildlife and wildlife habitat, such as wetlands and riparian vegetation. Source: FasTracks I-225 Team, 2009 Mitigation Measures Implement mitigation measures for loss of vegetation described in Table Implement appropriate BMPs to prevent altered stream flow or turbidity (i.e. rip rap) See Section 3.19, Wetlands/Waters of the US Colorado Senate Bill 40 (SB 40) requires any agency of the state to obtain wildlife certification from CDOW when the agency plans construction in...an SB 40 jurisdictional stream or its bank or tributaries.... The segment of Toll Gate Creek crossed by the Preferred Alternative is within CDOT right-ofway and therefore is the only area requiring SB 40 consideration. Although SB 40 emphasizes the protection of fishing waters, it does acknowledge the need to protect and preserve all fish and wildlife resources associated with streams in Colorado. The Preferred Alternative meets the jurisdictional site criteria under SB 40. CDOW will, most likely, determine that an application for SB 40 will be required. It is anticipated that a formal certification would be warranted for the Preferred Alternative. Spanned bridge design at Toll Gate Creek and Sand Creek will help maintain daily and seasonal movements for wildlife species using the riparian corridors to travel. No mitigation required. See SB 40 mitigation above. Biological Resources Page 3-143
150 Special Status Species Special status refers to species that have been listed by the USFWS as being either endangered (FE), threatened (FT), or a candidate for listing (FC) (under the Endangered Species Act [ESA]), or the CDOW as endangered (SE), threatened (ST), or special concern (SC) at the state level (under the authority of the Colorado Revised Statutes and Colorado Wildlife Commission regulations). Special status species also include bird species protected under the MBTA. Most wild birds, including raptors, are protected under the MBTA, except for non-native species that include house sparrow, rock dove, and European starling. The USFWS identified threatened and endangered species with the potential to occur in Denver County, Adams County, and Arapahoe County (USFWS, 2008). Species with the highest potential to occur in the study area are described in Table Biological Resources Page 3-144
151 Table Special Status Species that may occur within Study Area Common Name Birds 1 Bald eagle 2 Burrowing owl Ferruginous hawk Mammals Black-tailed prairie dog Species Haliaeetus leucocephalus Athene cunicularia Federal Status Protected NA State of Colorado Status ST SE Buteo regalis NA SC Cyomys ludovicianus Reptiles and Amphibians 1 Common garter snake Northern Leopard Frog Yellow Mud Turtle Thamnophis sirtalis NA NA SC SC Rana pipieus NA SC Kinosternon flarescens NA SC Habitat Prefers open water near tall trees and prairie dog colonies Grasslands, usually in association with prairie dog colonies Grasslands and shrublands; wintering birds prey on prairie dogs Grasslands and urban/disturbed areas throughout eastern Colorado Aquatic, wetland, and riparian habitats in marshes, ponds, and stream edges Aquatic, wetland, and riparian habitats in marshes, ponds, and stream edges Aquatic, wetland, and riparian habitats in marshes, ponds, and stream edges Potential for Occurrence in Study Area Potentially present; visual sightings at Sand Creek and Cherry Creek Reservoir Potentially present; frequently commensal with prairie dog colonies Likely present in open areas in winter, especially near prairie dog colonies Present; documented throughout study area Likely present in study area in suitable habitat along High Line Canal, Toll Gate and Sand Creek, and around drainages, riparian and wetlands Likely present in study area in suitable habitat along High Line Canal, Toll Gate and Sand Creek, and around drainages, riparian and wetlands. Likely present in study area in suitable habitat along High Line Canal, Toll Gate and Sand Creek, and around drainages, riparian and wetlands Sources: USFWS, 2008; CDOW, 2008; as indicated in federal and state databases October Status: FT = federally-listed as threatened NA = not applicable SE = listed as endangered by CDOW ST = listed as threatened by CDOW SC= State Species of Concern 1 In a letter received from the USFWS April 8, 2009 four additional species were identified with the potential to occur in the City and County of Denver, and Arapahoe County. It was determined that these species occur downstream of the project area and would not be impacted; therefore, these species are not included in this table. The USFWS letter is included in Appendix B. 2 The bald eagle, once listed on the federal FT/FE list, has been federally delisted as endangered, but remains a state threatened species. The bald eagle is also protected under the Migratory Bird Treaty Act and the Bald and Golden Eagle Protection Act. Bald eagles do not forage regularly along the I-225 corridor, but are expected to occasionally forage north of the corridor along Sand Creek. The urban setting and isolated nature of the prairie dog colonies make the presence of either ferruginous hawks or bald eagles unlikely (CDOT, 2000). Biological Resources Page 3-145
152 Habitats associated with the High Line Canal, Toll Gate Creek, and Sand Creek represent the highest quality habitat for wildlife and nesting raptors. Species that may nest in the study area include red-tailed hawks (Buteo jamaicensis), Swainson s hawk (Buteo swainsoni), American kestrel (Falco sparverius), great-horned owl (Bubo virginianus), and burrowing owl (Athene cunicularia). The red-tailed hawk, Swainson s hawk, and great-horned owl nest primarily in trees. Wintering and migrating raptor species include bald eagles (Haliaeetus leucocephalus), ferruginous hawk (Buteo regalis), rough-legged hawks (Buteo lagopus), northern harrier (Circus cyaneus), red-tailed hawk, and prairie falcon (Falco mexicanus) (Kingery, 1998). Several overpasses and culverts, as well as abundant shrubs, trees, and grassland areas exist in the study area that may be nest sites for migratory birds protected under the MBTA Impact Evaluation No-Action Alternative The No-Action Alternative is described in detail in Chapter 2. The No-Action Alternative would not result in direct impacts to special status species because no I-225 LRT facilities would be constructed. Other transportation projects included in the No-Action transportation network may have impacts to special status species. The impacts of these other projects have been or will be considered in the NEPA process for each of these projects, and avoidance, minimization, and/or mitigation specified, as appropriate, in the specific NEPA decision documents for each project. Indirect Impacts Less potential for TOD in the No-Action Alternative would likely decrease preservation of open space areas and land that provides special species habitat. Cumulative Impacts The projected population increases would place additional demands on vacant properties and open space. Urban development would be more highly dispersed under the No-Action Alternative than under the Preferred Alternative as there would be no TOD. These population increases would result in development of new housing and businesses on vacant lands and increased use of existing parks and open space. Over time, these land use conversions could result in habitat reductions for FE/FT species. All local transportation and development actions in the Project Study Area would be required to comply with the ESA to protect listed species. If special species were found on a property, the developer or contractor would follow steps under the ESA to ensure compliance is achieved. Habitat conservation plans under the ESA allow private economic development to proceed while promoting listed species conservation. Preferred Alternative The Preferred Alternative is described in detail in Chapter 2. An increase in traffic and noise could also affect the use of adjacent habitats during operation, although the raptor species that nest in urban areas are likely to become habituated to this environment. Direct loss of foraging habitat would decrease the availability of important prey species, but reduction in prey populations would be localized and is unlikely to affect raptor populations. Biological Resources Page 3-146
153 Vegetation clearing, earth-moving, and other construction activities have the potential to destroy nests of bird species protected under the MBTA. Existing vegetation is likely to provide nesting habitat for a relatively limited number of ground nesting birds because the affected habitats consist primarily of low-growing herbaceous vegetation that is managed with frequent mowing, and only limited amounts of trees and shrubs would be affected. The project would affect relatively few trees that could be nesting sites for tree-nesting raptors. If a pair of nesting raptors was present at the time of construction, they potentially could be directly impacted by removal of nests within the construction area, disturbance to the nesting pair or young at nests occurring in adjacent areas, and by disturbance or displacement of individuals from foraging and/or nesting areas (CDOW, 2008). Roadway overpasses and bridges, as well as culverts and areas with shrubs, grassland habitat, or located in urban areas, roadsides, and medians may be potential nest sites for migratory birds. The impacts to birds from construction and operation would include direct loss of habitat, displacement during construction, and mortality from vehicle collisions. Table presents potential direct, indirect, and temporary construction impacts to special status species and/or their habitat. Direct impacts to vegetation with prairie dog colonies is in Table Cumulative Impacts The cumulative impact of the Preferred Alternative would be similar to the No-Action Alternative. Vacant land that now serves as generally marginal special status species habitat would continue to be developed as the population increases through the year However, TOD stimulated by the Preferred Alternative would slightly modify this trend because some percentage of the new development would occur at higher densities. This would have a modest positive effect on habitat as some vacant land would not be developed during the planning period. In addition to complying with the ESA, as other projects would, the Preferred Alternative would carry out appropriate mitigation measures. Biological Resources Page 3-147
154 Table Potential Impacts to Special Status Species Section Direct Impacts Indirect Impacts Section 1 Nine Mile to Exposition Section 2 City Center Section 3 Ellsworth to Fitzsimons/ Montview Section 4 Fitzsimons/Montview to Peoria/Smith Source: FasTracks I-225 Team, 2009 Impacts to raptor foraging areas including foraging areas that contain prairie dogs at proposed Iliff Station. Impacted prairie dog colonies have the potential to decrease burrowing owl habitat. Potential disturbance to likely raptor nesting habitat located along the High Line Canal. Potential disturbance to raptor foraging areas with limited perch trees within vacant lands adjacent to Sable Boulevard including the proposed location of the Aurora City Center Station and RTD Transfer Facility. Impacted prairie dog colonies have the potential to decrease burrowing owl habitat. Potential disturbance to raptor nesting and foraging habitat located along High Line Canal and Toll Gate Creek. Many of the trees in these areas are above 30 feet tall and are adjacent to water features or foraging areas such as prairie dog colonies. Impacted prairie dog colonies have the potential to decrease burrowing owl habitat. Potential disturbance to raptor nesting and foraging habitat located along Toll Gate Creek and Sand Creek. Impacted prairie dog colonies have the potential to decrease burrowing owl habitat. Increased TOD due to the presence of the Preferred Alternative would likely convert prairie dog habitat to developed land uses. Increased TOD due to the presence of the Preferred Alternative would likely convert prairie dog habitat to developed land uses. Increased TOD due to the presence of the Preferred Alternative would likely convert prairie dog habitat to developed land uses. Increased TOD due to the presence of the Preferred Alternative would likely convert prairie dog habitat to developed land uses. Temporary Construction Impacts The decrease in foraging raptors primarily due to construction noise, human activity, and a decrease in winter prey. The decrease in foraging raptors primarily due to construction noise, human activity, and a decrease in winter prey. The decrease in foraging raptors primarily due to construction noise, human activity, and a decrease in winter prey. The decrease in foraging raptors primarily due to construction noise, human activity, and a decrease in winter prey. Biological Resources Page 3-148
155 Mitigation Measures A summarization of impacts and mitigation measures relating to special status species are discussed below in Table Table Summarization of Special Status Species Impacts and Mitigation Measures Impacts Mitigation Measures Direct Impacts Implement appropriate Programmatic Impacts to raptor nesting and foraging habitat Mitigation Measures discussed below Impact to prairie dog colonies with potential to impact burrowing owl habitat Indirect Impacts No mitigation required Increased TOD converting prairie dog habitat to developed land uses Temporary Construction Impacts Implement appropriate Programmatic Decrease in foraging raptors due to Mitigation Measures discussed below construction noise, human activity, and decrease in winter prey Programmatic Mitigation Measures Under the MBTA, construction activities in grassland, wetland, stream, and woodland habitats, and those that occur on bridges (e.g. which may affect swallow nests on bridge girders) that would otherwise result in the take of migratory birds, eggs, young, and/or active nests should be avoided. Although the provisions of MBTA are applicable year-round, most migratory bird nesting activity in eastern Colorado occurs during the period of April 1 to August 31. However, some migratory birds are known to nest outside of the aforementioned primary nesting season period. For example, raptors can be expected to nest in woodland habitats during February 1 through July 15. If the proposed construction project is planned to occur during the primary nesting season or at any other time which may result in the take of nesting migratory birds, the Service recommends that the project proponent (or construction contractor) arrange to have a qualified biologist conduct a field survey of the affected habitats and structures to determine the absence or presence of nesting migratory birds. Surveys should be conducted during the nesting season. In some cases, such as on bridges or other similar structures, nesting can be prevented until construction is complete. It is further recommended that the results of field surveys for nesting birds, along with information regarding the qualification some of the biologists(s) performing the surveys, be thoroughly documented and that such documentation be maintained on file by the project proponent (and/or construction contractor) for potential review by the Service (if requested) until such time as construction on the proposed project has been completed. The Service Colorado field office should be contacted immediately for further guidance if a field survey identifies the existence of one or more active bird nests that cannot be avoided by the planned construction activities. Adherence to these guidelines will help avoid the unnecessary take of migratory birds and the possible need for law enforcement action. RTD has established the FasTracks Prairie Dog Policy (RTD, 2007) guidelines for projects that impact black-tailed prairie dog colonies. RTD requires that projects are designed and constructed to avoid and minimize impacts to prairie dog colonies greater than two acres in size. This policy, described below, lists guidelines that will be applied to the project. Policies for Colonies less than two acres If a colony is less than two acres, but has the potential to expand into areas that are currently inactive (i.e., not constrained), the available and accessible habitat will be the determining size of the area to be considered. Projects involving towns less than two acres in area will be designed and constructed to avoid and minimize impacts, which may include the relocation of prairie dogs, so long as doing so will not Biological Resources Page 3-149
156 increase the impacts to other resources (e.g. wetlands, historical properties, environmental justice issues, archaeological sites, etc.) and is not cost prohibitive. The area of prairie dog towns that will be affected by a project will be calculated before construction begins. Policies for colonies greater than two acres Relocation efforts for prairie dog towns greater than two acres shall be conducted in accordance with CRS , as well as any other applicable laws or regulations. If a relocation site cannot be located for towns larger than two acres, the prairie dogs will be captured and donated to raptor rehabilitation facilities, or turned over to the USFWS for the black-footed ferret reintroduction program; At no time will RTD authorize earth-moving activities that result in the burying of living prairie dogs. If needed, humane techniques for the killing of prairie dogs within towns < 2 acres in size will be obtained from CDOW. Coordination with the CDOW District Wildlife Manager whose area the project is in will be initiated before any manipulation of prairie dogs or their colonies begins. All relocation of prairie dogs is to be done in compliance with the CDOW Permit to Capture and Relocate Prairie Dogs. This permit is to be acquired prior to any relocation activities. Various local jurisdictions also have ordinances or regulations that regulate actions associated with disturbance of prairie dogs. FasTracks corridor teams need to research the requirements of local jurisdictions prior to preparing a plan for prairie dog town disturbance. The plans will be reviewed with the FasTracks Environmental Resource Group. Non-profit groups, such as Prairie Dog Specialists, Inc., will relocate prairie dogs free of charge within the Metro Region. All necessary permits and approved release sites must be secured prior to relocation. In addition to the RTD mitigation listed below, those areas of impact that fall within the CDOT right-ofway will apply the Policy on Black Tailed Prairie Dogs (CDOT, 2009).. Surveys will be conducted prior to construction to evaluate whether there are active burrowing owl nests present in the study area. If identified, appropriate mitigation measures will be taken to prevent the loss of nesting habitat and disturbance to individuals. Source: FasTracks I-225 Team, 2009 Biological Resources Page 3-150
157 3.13 Mineral Resources/Geology/Soils This section summarizes existing geology and soils in the study area and describes the consequences of the No-Action Alternative and Preferred Alternative. Mineral resources, geology, and soils were evaluated using an area extending 1,000 feet on either side of the LRT alignment plus a 0.5-mile radius from each station. The impact evaluation is based on analysis of maps, reports, documents, and databases from the U.S. Geological Survey (USGS), U.S. Department of Agriculture/Natural Resources Conservation Service (USDA/NRCS), Colorado Geological Survey (CGS), Colorado Division of Minerals and Geology, Colorado Oil and Gas Commission, Colorado Department of Transportation, and geotechnical engineering reports, as well as a general field reconnaissance Affected Environment Geology and soils characteristics and challenges in the vicinity of the project have been identified using existing information sources. These are summarized in Table Conditions in the sections of the corridor are generally in accordance with those described above. Fine-grained wind-laid surficial deposits with low shear strength that are highly susceptible to settlement when wetted or loaded are common across the study area. In the underlying bedrock, the interbedded shale, sandstone, claystone, siltstone, and conglomerate layers include thin discontinuous beds of coal and carbonaceous material. Very weakly cemented sandstone layers in the bedrock are common. The uppermost bedrock layers are commonly heavily weathered, fractured, and iron stained. Depth to bedrock varies greatly. Shallow bedrock would exist over much of the study area if extensive excavation and fill had not occurred. Depth to the water table also varies widely. The water table occurs in bedrock, natural unconsolidated deposits, or artificial fill Impact Evaluation Impacts related to geology and soils for the No-Action Alternative and the Preferred Alternative are discussed below No-Action Alternative The No-Action Alternative is discussed in detail in Chapter 2. The No-Action Alternative would not result in direct impacts to soils and geology because no I-225 corridor LRT facilities would be constructed. Other transportation projects included in the No-Action transportation network may have impacts to geologic resources. The impacts of these other projects have been or will be considered in the NEPA process for each of these projects, and avoidance, minimization, and/or mitigation specified, as appropriate, in the specific NEPA decision documents for each project. Mineral Resources/Geology/Soils Page 3-151
158 Table Generalized Geologic and Soil Characteristics of the Project Study Area Characteristic Description Gently rolling uplands Greatest slopes into Sand Creek and Toll Gate Creek drainages Topography Total relief along the project alignment is nearly 400 feet from a maximum at Yale Avenue to minimal at the proposed Peoria/Smith Station site and where Peoria Street crosses Sand Creek Fine-grained wind-lain deposits on uplands Alluvial sand and gravel in significant drainages Unconsolidated Fine grained deposits may have low shear strength and are susceptible to Surficial Deposits settlement when wetted or loaded Fine grained deposits may have moderate to high shrink-swell potential Artificial fill of varying nature greater than 30 feet deep at some locations Denver Formation consisting of interbedded layers of shale, sandstone, claystone, siltstone and conglomerate Clay-dominated layers exhibit high shrink-swell potential Bedrock Depth to bedrock typically varies from less than 2 feet to more than 20 feet; may be greater than 30 feet in areas of artificial fill Even where shrink-swell potential is low in surficial deposits, underlying bedrock may have high shrink-swell potential Water table typically 5-20 feet below ground surface The water table may in surfical deposits, artificial fill or bedrock Water Table Seasonal water table may be less than 5 feet below ground surface in major drainages Localized shallow perched water tables may exist in some locations Landslide No mapped landslides identified Potential Small rotational landslides possible following excavation of on natural slopes Seismic Risk Colorado considered moderate in terms of seismic risk Area dominated by loamy soils with varying proportions of clay, silt, sand and gravel Soils Soils tend to be corrosive, have low shear strength and susceptible to wind and water erosion Clayey soils may have high to very high shrink-swell potential No active or abandoned mining operations known within the project area Mineral No oil or gas production within the project area Resources Project area has not been undermined for coal Some historic sand and gravel pits along Sand Creek and Toll Gate Creek Source: FasTracks I-225 Team, 2008 Mineral Resources/Geology/Soils Page 3-152
159 Indirect Impacts The No-Action Alternative is not expected to have impacts to geologic resources. Cumulative Impacts The No-Action Alternative would not result in cumulative impacts to geology, soils, or mineral resources Preferred Alternative The Preferred Alternative is discussed in detail in Chapter 2. Direct impacts generally relate to slope stability; erosion and aggradation; ground surface settlement; structure foundation construction; relationship between topography and design; seismic risk; and the potential loss of opportunity to extract mineral resources. Potential direct impacts related to geology and soils are summarized in Table Table Summary or Potential Direct Impacts Geology and Soils Potential Impact Description Loss of stability is triggered by excavation, loading, wetting, and/or devegetation. Caving also occurs in excavations in clayey soils and bedrock and in loose sandy soils or weakly cemented sandy bedrock. Slope stability Excavation can expose susceptible deposits or bedrock. Cut or fill processes can change groundwater flow or water tables and therefore affect slope stability. Can be prompted by cut or fill, exposure of erodible soil or bedrock, Erosion and aggradation devegetation, changes in flow direction or volume of surface water. Interacts with slope stability. Occurs in fine-grained low-strength soils or windblown deposits and in undercompacted artificial fill. Triggered by wetting or loading, enhanced Ground surface settlement by vibration. Can develop suddenly or over weeks or months following construction. Influences structure foundation design. Adverse substrate or groundwater conditions influence design. Adverse Structure foundation conditions in soils, unconsolidated deposits, and bedrock include: high construction shrink-swell potential; corrosivity; collapsibility; erodibility; shallow depth to bedrock; high water tables; soil flooding. Alignment placement and design is influenced by topographic relief, range and distribution of elevations, bedrock exposure, drainages. Relationship between Design can lead to alteration of the natural topography. Cut and fill topography and design procedures change depth to bedrock and may change the flow of surface water and groundwater, tying into other direct impacts. Structural design is influenced by long-term cumulative risk and Seismic risk probable maximum magnitude of a seismic event. Mineral rights are independent of surface rights. Location and value of a mineral resource can influence alignment location and design. Value of Potential loss of opportunity a resource depends on on-site quantity, quality, and accessibility, as to extract mineral resources well as availability of the resource elsewhere, demand for the resource, and its current and projected economic value. Source: FasTracks I-225 Team, 2009 Mineral Resources/Geology/Soils Page 3-153
160 Indirect Impacts The Preferred Alternative is not expected to have impacts to geologic resources. Temporary Construction Impacts The success of construction projects depends on consideration of the conditions of the construction site. This is particularly true of the geologic conditions that would provide support for the new facility. Geology and soils are evaluated with a focus on their ability to withstand and support the project during construction and operations. Temporary construction impacts can result from instability of slopes or the ground surface and from susceptibility to erosion in bedrock, soil, and surficial deposits. These impacts are similar across the sections and proposed station sites, and include slope instability triggered by devegetation, excavation, loading, or changes in water content; erosion or aggradation triggered by decreased slope stability, by cut or fill procedures, by exposing or devegetating soils, or by temporarily changing the direction or volume of surface water flow; and settlement triggered by wetting or loading low-strength soils or surficial deposits or by emplacing loose uncompacted fill. Settlement can occur in native materials or in pre-existing undercompacted artificial fill on or adjacent to the construction site. Cumulative Impacts The Preferred Alternative would not result in cumulative impacts to geology, soils, or mineral resources. Mineral Resources/Geology/Soils Page 3-154
161 Mitigation Measures Mitigation measures to address the impacts described in Table should follow best engineering practices that have been developed for the Front Range over time. Mitigation of a particular impact may employ one or more appropriate measures. The list of mitigation measures included here represents typical responses to the impacts described but does not necessarily include all possibilities that could be employed to address each situation that could arise in construction and operation of the project. Table Summarization of Geology and Soils Impacts and Mitigation Measures Impact Direct Impacts Slope stability Erosion and aggradation Ground surface settlement Structure foundation construction Relationship between topography and design Seismic risk Potential loss of opportunity to extract mineral resources Indirect Impacts No indirect impacts Temporary Construction Impacts Slope stability Erosion and aggradation control Ground surface stability in low-strength materials Structure foundation construction for adverse substrates or groundwater Topography and design Opportunity to extract mineral resources Seismicity Source: FasTracks I-225 Team, 2009 Mitigation Measures Mitigation is similar to construction mitigation below, and is not expected to be needed during operations, unless construction mitigation is not properly implemented. No mitigation required. Appropriate design and development of the slope profile and slope cuts, limited devegetation, slope cover during construction, prompt revegetation of slopes, temporary or permanent dewatering systems, retaining walls, appropriately engineered fill. Slope design, drainage systems, slope cover during construction, prompt revegetation, removal of adverse substrate, appropriately engineered fill. Pre-flooding and/or dewatering, removal of adverse substrate, engineered backfill, geotextiles or geogrids. Appropriate design and development, coated and resistant steel and concrete, subsurface drainage and dewatering systems, specialized piers and footings, deep foundation systems, overexcavation, appropriately engineered backfills. Appropriate structural designs for existing topography, engineered cut and fill to appropriately alter topography. Legal analysis of mineral rights within construction footprints, constructing within existing ROWs. Construction design and development in conformance with guidelines for stability in seismic events of expected magnitude. Mineral Resources/Geology/Soils Page 3-155
162 3.14 Paleontology Paleontological resources, or fossils, are the remains, imprints or traces of once-living organisms preserved in rocks and sediments. These include mineralized, partially mineralized, or unmineralized bones and teeth, soft tissues, shells, wood, leaf impressions, footprints, burrows, and microscopic remains. These non-renewable resources are protected by the Colorado Historical, Prehistorical, and Archaeological Resources Act of Paleontological resources were evaluated using the project footprint. The purpose of the paleontological assessment was to evaluate the paleontological sensitivity of the geologic units within the project footprint by researching their known fossil potential and paleontological significance, and by determining the number and significance of fossil localities within the project footprint and elsewhere in the same geologic units. The study included a review of relevant scientific literature, geologic maps, museum records (Denver Museum of Nature and Science and the University of Colorado Museum of Natural History), and a field survey. The paleontological evaluation procedures for this study were conducted in accordance with Society of Vertebrate Paleontology (1995) guidelines by qualified and permitted paleontologists (State of Colorado Paleontological Permit ) Affected Environment Geologically, the project footprint is underlain by late Cretaceous or Paleocene rocks of the Denver Formation, Pleistocene Broadway Alluvium, Pleistocene to Holocene loess, Pleistocene to Holocene eolian sand, Piney Creek and Post-Piney Creek Alluvium, and unmapped imported artificial fill. No fossils or exposures of potentially fossiliferous bedrock were observed within the project footprint during the field survey, no reports of fossils from within the project footprint were found in the literature reviewed for this study, and no records of fossils from within the project footprint were found during the museum record searches conducted for this study. However, there are numerous reports of fossils from the Denver Formation and Pleistocene-age surficial deposits in the scientific and technical literature, and museum records list numerous localities where fossils have been discovered in these units in the Denver area Impact Evaluation This section describes the impacts of the No-Action Alternative and Preferred Alternative on paleontological resources within the project footprint No-Action Alternative The No-Action Alternative is described in detail in Chapter 2. The No-Action Alternative would not result in direct impacts to paleontological resources because no I-225 corridor LRT facilities would be constructed. Other transportation projects included in the No-Action transportation network may have impacts to paleontologic resources. The impacts of these other projects have been or will be considered in the NEPA process for each of these projects, and avoidance, minimization, and/or mitigation specified, as appropriate, in the specific NEPA decision documents for each project. Paleontology Page 3-156
163 Indirect Impacts The No-Action Alternative is not expected to have indirect impacts to paleontological resources. Cumulative Impacts There are no expected cumulative impacts expected under the No-Action o Alternative to paleontological resources Preferred Alternative The Preferred Alternative is described in detail in Chapter 2. It is likely that the deeper excavations associated with the Preferred Alternative could encounter bedrock Denver Formation which underlies the entire project footprint at varying depths, and adverse impacts to paleontological resources could result through breaking and crushing of scientifically important fossils. Although most excavations are anticipated to occur at or just below existing grade, impacts are still possible within footprint of the I-225 FasTracks Project. Indirect Impacts The Preferred Alternative is not expected to have indirect impacts to paleontological resources. Temporary Construction Impacts There are no expected temporary construction impacts to paleontological resources. Cumulative Impacts There are no expected cumulative impacts expected under the Preferred Alternatives to paleontological resources Mitigation Measures Table summarizes paleontological impacts and mitigation measures of the Preferred Alternative. Paleontology Page 3-157
164 Table Summarization of Paleontological Impacts and Mitigation Measures Impacts Direct Impacts No direct impacts expected Indirect Impacts No indirect impacts Temporary Construction Impacts Construction activities within CDOT right-ofway Source: FasTracks I-225 Team, 2009 Mitigation Measures Paleontological resource impacts will be avoided or minimized by implementing standard mitigation measures, which follow the guidelines of the Society of Vertebrate Paleontology and meet the standards of federal agencies and the state of Colorado. No mitigation measures The CDOT Staff Paleontologist should examine portions of the Project Study Area that fall within the Colorado Department of Transportation (CDOT) right-of-way to determine the extent of impact to bedrock Denver Formation, and the scope of paleontological monitoring, if any, which is required. The review by the CDOT Staff Paleontologist should occur in coordination with preliminary design plans. If any subsurface bones or other potential fossils are found anywhere within the Project Study Area during ground disturbance, for portions of the Project Study Area that fall within the CDOT right-of-way, the CDOT Staff Paleontologist should be notified immediately to assess their significance and make further recommendations. Paleontology Page 3-158
165 3.15 Hazardous Materials This section provides an overview of sites with recognized or potential soil and groundwater contamination. The identification of contaminated sites is necessary so that they can be avoided when reasonably possible, or appropriate mitigation measures can be implemented. The presence of hazardous materials is a liability concern for any potential right-of-way acquisition and can affect the project in terms of worker health and safety, cost, schedule, and agency and public relations, particularly if these sites are not identified prior to construction. Therefore, an assessment of potential contamination in the study area is an integral part of the RTD project planning process. Areas of contaminated soil and groundwater must be identified to evaluate several aspects of the proposed improvements, including: responsibility and management of contaminated soil and groundwater engineering options to minimize and mitigate impacts activities associated with right-of-way acquisition worker health and safety during construction In support of this EE, a Modified Phase I Environmental Site Assessment (MESA) (Walsh, 2008a; 2008b; 2008c) was performed to identify properties (sites) with the presence of potential or known (recognized) soil and groundwater contamination (i.e., potential or recognized environmental conditions) from hazardous materials. The term hazardous materials is an allinclusive term for materials that are regulated as a solid waste, hazardous waste, or other wastes contaminated with hazardous substances, radioactive materials, petroleum fuels, toxic substances, and pollutants. The methodology used to identify sites with recognized and potential environmental conditions included: Limited visual inspection of properties adjacent to the project corridor to locate activities that could potentially result in hazardous materials contamination Review historical information for the project corridor Review agency environmental records to identify known contaminated sites and regulated sites Screening and ranking of potential and recognized environmental conditions along the corridor Hazardous materials sites were assigned a ranking (high, moderate, low), which characterizes the potential of each site to impact the project. The methodology is further discussed in the MESA. Hazardous Materials Page 3-159
166 Affected Environment A total of 326 listings were identified as having potential and recognized environmental conditions within 1,000 feet from the centerline of the LRT or 0.5-mile from proposed station locations. Of these listings, 72 were ranked as having high potential to affect the project, and 86 were ranked as having a moderate potential to affect the project. The remaining 168 listings were ranked as low and deemed unlikely to affect the project. Individual properties (i.e., parcels) may have multiple listings. For instance, a property would be counted as two listings if it had both an underground storage tank (UST) and an aboveground storage tank (AST) on site. The complete results of the screening and ranking process and discussion of these sites is included in the MESA. Most of the Preferred Alternative is located in areas that do not have a history of prior industrial or commercial development. Only in the northern-most portion of the corridor, in the vicinity of Smith Road south to approximately Sand Creek, is there a significant history of wide-spread industrial development dating back to the 1970s. Overall, the areas with higher numbers of properties with potential and recognized environmental conditions are generally found in the vicinity of: Peoria/Smith Station Properties along the LRT from Smith Road to Sand Creek Properties in the vicinity of the Colfax Station and the proposed LRT overpass structure at Colfax/I Impact Evaluation To determine the consequences of the Preferred Alternative, the properties within the project footprint from which right-of-way would potentially be acquired were compared with the high and moderate- ranked sites identified in the MESA. The number of properties with potential or recognized environmental conditions within the project footprint is smaller than the number of properties with potential or recognized environmental conditions within the study area. Sites to be potentially acquired for right-of-way that have potential or recognized soil and groundwater contamination are considered direct hazardous materials impacts (Table and Figure ) No-Action Alternative The No-Action Alternative is described in detail in Chapter 2. The No-Action Alternative would not result in direct impacts to hazardous materials because no I-225 corridor LRT facilities would be constructed. Other transportation projects included in the No-Action transportation network may have hazardous materials impacts. The impacts of these other projects have been or will be considered in the NEPA process for each of these projects, and avoidance, minimization, and/or mitigation specified, as appropriate, in the specific NEPA decision documents for each project. Hazardous Materials Page 3-160

167 Figure Sites of Concern within the Project Footprint Source: Walsh, 2008b and 2008c Hazardous Materials Page 3-161
168 Indirect Impacts No indirect impacts are expected under the No-Action Alternative. Cumulative Impacts Under the No-Action Alternative, hazardous materials likely would be encountered during construction of other future projects. These materials would be removed from the site and properly disposed. Based on strict control by state and federal agencies, these projects would not produce lingering hazardous material problems in the Project Study Area Preferred Alternative The Preferred Alternative is described in detail in Chapter 2. A total of 47 high and moderateranked sites are present within the project footprint (Table and Figure ). Eight sites are located within Section 1, six within Section 2, 12 within Section 3, and 21 within Section 4. Low-ranked sites were not discussed because they have minimal indications of an existing release, past release or material threat of release of any hazardous substance. As such, these sites are not expected to impact the project. Table Summary of Sites with Potential or Recognized Environmental Conditions Map ID A A 235B Iliff Station A 246B Florida Station 211 Site Address/ Location Description Ranking Section 1 Nine Mile to Exposition 1501 Potomac (Medical Center of Aurora) 2150 Abilene St. (Plumbing and Heating Repair) 2500 Abilene St. (Gateway Station) E. Harvard Avenue Adjacent and east of I-25/Iliff northbound off-ramp 13851/13981 Harvard Avenue (SE Corner of Iliff and Blackhawk) 1400 Abilene St. (Sam s Club) Closed leaking underground storage tank (LUST), open underground storage tanks (USTs) (Eight containing diesel fuel), Current Federal Resource Conservation and Recovery Act (RCRA) small quantity generator (SQG) 1 Current RCRA conditionally exempt small quantity generator (CESQG) 2, no record of release Open UST (One containing gasoline) Operating tanks Vacant property with a detention basin in the northwest corner. I-225/Iliff intersection drains into this basin. Historical industrial land use several hundred feet upgradient from this property, redeveloped as commercial & residential. Open RCRA corrective action (CORRACT) 4 at upgradient dry cleaner. Former disturbed land and excavation or fill material observed in aerial photos. Redeveloped as retail. Current CESQG, no record of release High Moderate High High Moderate High High Hazardous Materials Page 3-162
169 Map ID Site Address/ Location Description Ranking 1600 Abilene Specialty Drum of Dyna-Kleen: potassium hydroxide, ethylene Cleaning Services, glycol, monobutyl ether observed outside cleaning Sears Parts and service facility. Service High Section 2 City Center Exposition Avenue (Walmart) Current CESQG - no record of release Moderate 291 Sable Blvd. Gas Station. Open LUST, Open USTs (Six (Diamond Shamrock) containing gasoline) High Alameda Operating dry cleaners and gas station. Open LUST, High 164 Avenue (Conoco) 155 Property west of Ellsworth Avenue Ellsworth Avenue (Target) City Center Station Alameda Avenue (Vacant) 1402 Potomac Street (Power substation) Colfax Avenue 2075 Potomac Street Parking lot 81 Fitzsimons redevelopment 2nd/Abilene Station Blackhawk Street (Vacant) 13th Avenue Station th Avenue 113 (Vacant) 113A 99A th Avenue (Vacant) Open USTs (Four containing gasoline) Upgradient from this property there are open tanks and open tank leaks Current CESQG - no record of release Former man-made pond observed on this property. Pond assumed to be for stormwater runoff, but no longer present. Two gas stations, a dry cleaner, and a former landfill on adjacent properties. Section 3 Ellsworth to Fitzsimons/Montview Land disturbance with storage of unknown materials observed in aerial photos. Former gas station and auto service. Site also formerly used by an oil company. Closed LUST, multiple spills - oil spill with no cleanup documented, Open USTs (34 containing gasoline & diesel fuel), above ground storage tanks (ASTs) (Six containing used oil), Former RCRA Large Quantity Generator (LQG) 3, Current CESQG The area was reported to be a former landfill associated with Fitzsimons. It has reportedly been remediated. No potential environmental conditions immediately on site, but two auto maintenance facilities are potentially upgradient from this station location. Fill dirt from unknown source observed during site reconnaissance. Fill dirt from unknown source observed during site reconnaissance. Former storage of unknown material, oil spill with no clean-up documented, operating tanks, and closed LUSTs Moderate Moderate Moderate High High Moderate Moderate High High Hazardous Materials Page 3-163
170 Map ID Colfax Station Site Address/ Location Description Ranking 13750/13700 Colfax Avenue (Altura Sinclair) 1590 Fitzsimons Parkway (Vacant) Colfax Avenue (U Haul) Colfax Avenue (Aurora Auto Clinic II) Potomac Street Fitzsimons Parkway (Bioscience east) 2075 Potomac Street (Vacant) 2088 Wheeling Street (District Police, Office) th Avenue (University Hospital, Police) Montview Boulevard (Health Sciences Library) Station located in the area of several former Fitzsimons landfills. Recently redeveloped retail center, formerly a gas station. Closed USTs (Ten containing gasoline & diesel fuel) Station located in the area of several former Fitzsimons landfills. The specific area was reported to be a former landfill associated with Fitzsimons. It has reportedly been remediated. Station located in the area of several former Fitzsimons landfills. Moving van rental business with closed USTs (11 containing gasoline, diesel fuel, & used oil), Closed LUST Station located in the area of several former Fitzsimons landfills. Gas station with open USTs (10 containing gasoline & diesel fuel) Station located in the area of several former Fitzsimons landfills. Storage units insufficient information to determine whether hazardous materials have been stored on the property. Section 4 Fitzsimons/Montview to Peoria/Smith Hazardous materials sign indicates that hazardous materials are present at this laboratory. Fitzsimons redevelopment historic contamination and remediation. Fitzsimons redevelopment historic contamination and remediation. Fitzsimons redevelopment large pile of fill dirt from unknown source. Fitzsimons redevelopment historic contamination and remediation Ursula Street Fitzsimons redevelopment historic contamination and remediation Montview Fitzsimons redevelopment historic contamination Boulevard (Building T- and remediation. 524) Montview Boulevard (Bioscience lab/office) E. 25th Avenue (Golf course) 2800 Havana Way (Vacant) Peoria Street Fitzsimons redevelopment historic contamination and remediation. Pipeline Pipeline, former industrial land use Pipeline, former industrial land use, former auto repair and gas station, storage units Moderate Moderate Moderate High High High Moderate Moderate Moderate Moderate Moderate Moderate Moderate High High High Hazardous Materials Page 3-164
171 Map ID Site Address/ Location Description Ranking 2801 Peoria Street 50 (Open space/ Pipeline, sand pit High recreation area) th Avenue Unknown material formerly stored on site, redeveloped as commercial land use. High Peoria Street Former dry cleaners High Peoria Street Auto maintenance High Peoria Street Former gas station. Two closed USTs containing (Circle K) gasoline. Closed LUST. Moderate Peoria Street (Vacant) Fill dirt from unknown source High Peoria Street Former printing facility; Drums were illegally dumped (Vacant) (1992) in this area; confidence in location is low. Moderate Peoria Street Auto maintenance, records of former gas station and (Hearts Jiffy Stop) closed gasoline USTs; closed LUST High 11 Former landfill. Pipeline, historic land disturbance 12050/11600 Smith with storage of unknown materials Former LQG, Road (Smith Road Jail current CESQG - no record of release, records of Site) operating tank. Potential illegal dumping. High Moline Street Pipeline, auto maintenance High Montview Station East Montview Boulevard (Building T-215, Army Steam Plant) Structure was formerly the Army steam plant. It was decommissioned by the Army and then demolished during redevelopment. The building footprint area and surrounding areas have been remediated (historic contamination and remediation). Source: Walsh, 2008a, b, and c 1 Generate between 100 kilograms (kg) and 1,000 kg of hazardous waste per month 2 Generate less than 100 kg of hazardous waste or 1 kg of acutely hazardous waste per month 3 Generate over 1,000 kg of hazardous waste or over 1 kg of acutely hazardous waste per month 4 Sites identified as needing Corrective Action after a release of a hazardous waste Moderate Several high and moderate-ranked sites are not directly within the project footprint (107 sites) and will likely not be acquired for right-of-way. These sites still have potential or recognized environmental conditions that could affect the project in terms of materials management or worker health and safety. As such, these sites could also have a direct impact on project activities due to potential migration of contamination. One site, located north of Sand Creek and west of Peoria Street ( miles from LRT centerline), is an open CORRACT site. This site was historically used as a dumping ground and has known groundwater contamination with chlorinated hydrocarbons. The remaining sites are generally associated with industrial land use, open/closed USTs/ASTs, the Fitzsimons redevelopment, or SQG operations. Detailed information regarding these sites is included in the MESA. Hazardous Materials Page 3-165
172 Indirect Impacts The Preferred Alternative may pose health and safety concerns to the public and construction workers if sites are indirectly impacted. Indirect impacts could occur from existing site remediation being disrupted, or flow of contamination being altered due to the presence of the Preferred Alternative. Temporary Construction Impacts The Preferred Alternative may pose health and safety concerns to the public and construction workers during construction, if hazardous materials sites become exposed during construction and release hazardous materials into the soil or groundwater at the sites or existing site remediation is disrupted. The possibility for these effects to occur is a function of the number of sites encountered during construction and the location and amount of contamination remaining at a site. It is expected that there would be excavation and drilling for caissons for bridges and retaining walls. These activities could cause exposure to soils or groundwater containing hazardous waste and could potentially impact human health and safety. Cumulative Impacts Under the Preferred Alternative, hazardous materials would be encountered. These materials would be removed from the site and properly disposed. Implementation of all other future projects, including the FasTracks corridors, would result in exposure to and remediation of unknown quantities of hazardous waste. As a result, these materials would no longer represent a potential threat to human health and the environment. Furthermore hazardous waste generation resulting from operation of future projects is strictly controlled by state and federal regulation, meaning operation of such projects would not produce future problems Mitigation Measures Mitigation techniques to reduce identified impacts to hazardous materials sites are included in Table Hazardous Materials Page 3-166
173 Table Summarization of Hazardous Materials and Mitigation Measures Impact Direct Impacts Existing hazardous material sites within or adjacent to area of proposed excavation and acquisition of property Indirect Impacts Disruption of site remediation or flow Temporary Construction Impacts Protection of Construction Workers Water Quality Protection Source: FasTracks I-225 Team, 2008 Mitigation Measure for the Preferred Alternative Conduct individual site-specific Phase I Environmental Site Assessments of properties before acquisition. Complete site-specific Phase II Environmental Site Assessments with subsurface investigation (soil and groundwater) for sites that may have been contaminated or affect final design, as documented by the Phase I Environmental Site Assessments, where appropriate. Prepare a Health and Safety Plan and a Materials Handling Plan to address contaminated soil and groundwater. Determine engineering controls to minimize quantity of contaminated materials. Determine cost recovery of hazardous material sites where removal actions and long-term maintenance is required. Prepare an asbestos survey for any building acquisition or demolition. If contamination is suspected or encountered within CDOT right-of-way, preparation of a Materials Management Plan is required per the CDOT Standard Specifications for Road and Bridge Construction.. No mitigation measures required. Compliance with Occupational Safety and Health Administration (OSHA) requirements for construction workers who may be exposed to hazardous materials, including preparation of Health and Safety and Emergency Response Plans, air monitoring (if necessary), and provision of personal protective equipment. Implement construction Best Management Practices (BMPs) in accordance with Stormwater Pollution Prevention Plan. BMPs may include secondary containment areas for refueling construction equipment, berms or ponds to control runoff, and a monitoring program to test stormwater for contaminants prior to discharge from the construction site. As part of the mitigation, specific sites and areas have been recommended for further Phase II sampling and analysis based on the MESA (Table ). Additional sites may be recommended for Phase II sampling and analysis after additional Phase I Environmental Site Assessment work has been completed on properties that will be acquired for the project. The following recommendations for potential Phase II Environmental Site Assessment work and sampling locations are based only on the findings of the MESA, and are not intended to comprehensively cover all of the potential sampling and analysis needs prior to acquisitions or construction activity on the project. Therefore, some medium and high-ranked sites within the project footprint may not be included in initial recommendations included in Table Hazardous Materials Page 3-167
174 The purpose of conducting Phase II Environmental Site Assessment sampling and analysis is to evaluate the sites with potential and recognized environmental conditions identified in the MESA to provide sufficient information regarding the nature and extent of contamination. This information will be used to implement appropriate materials management practices for contaminated soil and groundwater and/or removal of USTs/ASTs. Recommendations for further investigation for several additional sites not within the project footprint are also included in the MESA. Table identifies the areas directly impacted by the project footprint. A site-specific Health and Safety Plan and Phase II Environmental Site Assessment Sampling Analysis Plan will be prepared prior to construction. Also, on sites where structures may be demolished or removed, assessment and materials management for lead-based paint and asbestos are recommended. Table Recommended Mitigation Section Location MAP ID and Recommended Mitigation Section 1 Map ID Phase II sampling and analysis recommended. Section 2 Iliff Station Florida Station City Center Maps IDs 246A and 246B Phase I ESAs recommended prior to any property acquisition or construction work. Map ID 247A - A Phase I ESA recommended prior to any property acquisition or construction work and Phase II sampling and analysis of surface soils, subsurface soils, and groundwater may be warranted based on the results of the Phase I ESA. Map IDs 211 and Phase II sampling and analysis recommended. Map ID A Phase I ESA recommended. Map IDs 178 and 179 Although ranked low, Phase I ESAs recommended if partial acquisitions. Some Phase II soil and groundwater sampling will likely be required at the location of the former pond (southwest corner, Map ID 173) and some limited soil sampling across Map ID 173, as well as along the proposed rail lines at Map IDs 178 (14701 E. Exposition Ave.) and 179 (14701 E. Exposition Ave.). Hazardous Materials Page 3-168
175 Section Location MAP ID and Recommended Mitigation Section 3 2nd/Abilene Station East Colfax to Alameda Avenue 13th Avenue Station Map ID 136 Phase II sampling and analysis is recommended to assess potential for upgradient sources of contamination. Phase II sampling and analysis along this section of the track recommended for near-surface soil sampling at intervals for confirmation purpose, except where deeper excavations for support structures or tunnels are required. Some Phase II sampling will likely be recommended at the locations of support structures for elevated tracks, and at some intervals along the main line. Although ranked low, Map IDs 141 (10 N. Abilene St.) and 159 (61 S. Sable) Phase I ESAs are recommended. Some sampling and analysis may be prudent at these locations, depending on the findings of the Phase I ESAs. Map IDs 99A and 113A - Phase I ESA recommended prior to any property acquisition or construction work and Phase II sampling and analysis of surface soils, subsurface soils, and groundwater may be warranted based on the results of the Phase I ESA. Section 4 Colfax Station Montview Station Fitzsimons Parkway Peoria from Smith Road to Montview Map ID Phase II sampling and analysis of surface soils, subsurface soils, and groundwater is recommended. Map ID 83, Map ID 100, Map ID 88 - Phase I ESAs recommended prior to any property acquisition or construction. Some Phase II sampling and analysis is recommended at Map IDs 86 and 87. Map ID 66 - Further investigation of previously completed environmental assessments recommended once Fitzsimons remediation complete. Phase II sampling warranted where excavation may occur. Soil caps may exist, which require further investigation. Appropriate material management and construction practices are necessary. Some monitoring of excavations or special handling procedures for excavated material may be required by Fitzsimons current protocols; however, these protocols may also be rescinded before RTD s construction. Sampling recommended in this area, especially north of Sand Creek. Additional Phase I ESA work recommended if partial property acquisitions are required along Peoria, primarily north of Sand Creek. The scope of any Phase II sampling required on Peoria in this area should be determined after Phase I ESAs are completed for any needed acquisitions. Map ID 29 Phase II sampling and analysis recommended. Peoria/Smith Station Map ID 11 Phase II sampling and analysis recommended. Source: FasTracks I-225 Team, 2009 and Walsh, 2008a, b, and c Hazardous Materials Page 3-169
176 3.16 Utilities This section describes existing utilities in the vicinity of the Preferred Alternative, and evaluates the impact of the No-Action Alternative and the Preferred Alternative on these existing utilities. Where appropriate, mitigation measures identified to address adverse impacts of the Preferred Alternative. Utilities included in this assessment are water, sanitary sewer, storm sewer, natural gas, electric, fiber optic, telephone, and cable. These are divided into six groups: electric, communications, water, sanitary, storm, and gas. Utilities were evaluated using a study area extending to a 300 foot buffer on either side of the LRT alignment and from each station. This is referred to in this section as the utility study area Affected Environment The major utilities identified include: overhead and buried fiber optic lines overhead electric transmission lines buried gas lines of varying pressure types overhead and buried cable television lines overhead and buried electric service lines storm sewer overhead and buried telephone lines buried water distribution lines sanitary sewers overhead and buried electric distribution lines buried water transmission lines The majority of the utilities occur in public right-of-way, while other utilities occur on easements or private property. The publicly held utilities, mainly storm and sanitary sewers and water lines, are owned by the City of Aurora and CDOT. The FasTracks I-225 Team coordinated with the Utility Notification Center of Colorado, private utility companies, and municipalities with potentially affected facilities Impact Evaluation This section describes the impacts of the No-Action Alternative and Preferred Alternative as they relate to utilities within the project footprint No-Action Alternative The No-Action Alternative is described in detail in Chapter 2. The No-Action Alternative would not result in direct impacts to utilities because no I-225 corridor LRT facilities would be constructed. Other transportation projects included in the No-Action transportation network may have impacts to utilities. The impacts of these other projects have been or will be considered in the NEPA process for each of these projects, and avoidance, minimization, and/or mitigation specified, as appropriate, in the specific NEPA decision documents for each project. Indirect Impacts The No-Action Alternative would not result in indirect impacts to utilities. Utilities Page 3-170
177 Cumulative Impacts Utility needs are directly correlated to increases in population. Shifts in density may also require expansion of infrastructure facilities. Demand for new utilities in both the Project Study Area and the Metro Region would be driven by population increases expected through If future land use patterns repeat past land use patterns then the majority of this new population would occur in comparatively low-density, single-family residential land uses where new utility infrastructure would be more costly per dwelling unit basis Preferred Alternative The Preferred Alternative is described in detail in Chapter 2. Table shows expected utility impacts. A total of approximately 517 potential utility impacts were identified. Impacts to utilities are temporary in nature. Table Summary of Potential Conflicts with Major Utilities Project Section Section 1 Nine Mile to Exposition Section 2 City Center Section 3 Ellsworth to Fitzsimons/Montview Section 4 Fitzsimons/Montview to Peoria/Smith Approximate Number of Utility Impacts* 105 utilities 179 utilities 46 utilities 187 utilities Summary of Impacts 2 transmission lines; Multiple street lighting power feeds; Multiple communications conduits or ducts; 5 water lines; 3 sanitary sewers; 11 CDOT storm sewers; 8 City of Aurora storm sewers;1 unconfirmed owner storm sewer; multiple storm sewers of 18 inches or less; 7 gas lines 1 transmission line; Multiple street lighting power feeds; Multiple communications conduits or ducts; 21 water lines; 23 sanitary sewers; 20 City of Aurora storm sewers; 2 CDOT storm sewers; 1 private storm sewer; 29 gas lines 1 transmission line; Multiple street lighting power feeds; Multiple communications conduits or ducts; 4 water lines; 2 sanitary sewers; 4 CDOT storm sewers; 4 City of Aurora storm sewers; 2 gas lines Multiple street lighting power feeds; Multiple communications conduits or ducts; 29 water lines and 7 unconfirmed water lines; 37 sanitary sewer lines and 2 potential unconfirmed sanitary sewers; 20 City of Aurora storm sewers, 5 private storm sewers, 7 unconfirmed storm sewers, and 1 unknown storm sewer; multiple storm sewers of 18 inches or less ; 17 gas lines. Source: FasTracks I-225 Team, 2008 Note: Impacts identified within 300 foot buffer on either side of the LRT alignment and station areas. Indirect Impacts The Preferred Alternative could result in potential densification around TOD areas required additional utilities. Temporary Construction Impacts During construction, temporary service interruptions may be necessary to safely accommodate construction activities, including utility relocation. The length and frequency of the service interruption would vary depending on the construction process, type and condition of equipment Utilities Page 3-171
178 used, layout of the construction site, and specific utility owner shut-off restrictions. Interruptions in service for utilities users is expected to minimal. Cumulative Impacts Construction of the Preferred Alternative or the other FasTracks project elements would have a slight positive impact on utility investment due to increased population density at TOD around proposed transit stations. This higher density form of development results in a lower per capita cost for utilities Mitigation Measures Table summarizes utility impacts and mitigation measures of the Preferred Alternative. Table Summarization of Utility Impacts and Mitigation Measures Impacts Direct Impacts 517 potential utility impacts including: transmission lines, street lighting power feeds, communications conduits or ducts, water lines, sanitary sewers, storm sewers, gas lines Indirect Impacts Densification of development requiring additional utilities Temporary Construction Impacts Same as Direct Impacts to utilities Source: FasTracks I-225 Team, 2009 Mitigation Measures Required inspections and cooperative design processes will be necessary for each utility that requires relocation Interruption of service may occur during the utility relocation process, however certain limitations will be observed Specific utilities maintain service during peak times of day and year that may require construction of redundant systems to accommodate Use cathodic protection to mitigate corrosion or electrical grounding to mitigate effects of induced voltages caused by alternating current Reinforce or protect utilities through casing pipes modify design to avoid or minimize conflict No mitigation required Ensure that disruption of service provided by the existing utilities infrastructure is limited. This will be done through the preparation of a detailed utility report during preliminary engineering. Conduct detailed field survey and coordinate with utility owners and municipalities Utilities Page 3-172
179 3.17 Water Resources This section discusses water resources and quality in the study area and evaluates impacts associated with the No-Action Alternative and Preferred Alternative. Included in this section are surface water and groundwater impacts, Best Management Practices (BMPs) for use during construction and operations, and permanent BMPs for post-construction. Water resources were evaluated using a 300-foot buffer around the project footprint to capture potential direct, indirect, and temporary construction impacts. Water Resources Regulations Water resources are managed through federal, state, and local regulations that establish the standards and management actions necessary to protect their physical, chemical, and biological integrity. The primary regulations governing surface water and groundwater resources in the project area are the Clean Water Act (CWA) and Safe Drinking Water Act (SDWA). The Colorado Department of Public Health and Environment (CDPHE) Water Quality Control Commission (WQCC) has the authority to establish and enforce water quality standards within the State of Colorado. The primary water quality concern associated with the project results from the discharge of stormwater to receiving waters. As part of the CWA, entities with stormwater discharges are regulated under the National Pollutant Discharge Elimination System (NPDES) permit program. Municipal Separate Storm Sewer Systems (MS4s) that are owned and maintained by municipalities, RTD and Colorado Department of Transportation (CDOT), are required to obtain Colorado Discharge Permit System (CDPS) permits for stormwater discharges. The permit requires the permittee to develop and implement a stormwater management program to maintain and protect water quality conditions from their stormwater discharges. Streams that do not meet established water quality standards ( impaired streams ) are placed on the Colorado 303 (d) List. CDPHE is required to establish a Total Maximum Daily Load (TMDL) assessment for water bodies on the 303 (d) list. The TMDL assessment establishes the total amount of pollutant loading that a surface water system can receive without exceeding water quality standards. When surface waters may be impaired but supporting documentation does not meet the standards for credible evidence, these waters are placed on the CDPHE Colorado 303(d) Monitoring and Evaluation List (M and E). Public drinking water supplies (systems serving more than 25 people) from both groundwater and surface water sources are regulated by the SDWA. These sources include lakes, rivers, reservoirs, springs, and groundwater. Water Resources Page 3-173
180 Affected Environment The Preferred Alternative lies within the transition zone between the Rocky Mountain Front Range in central Colorado and the Great Plains of eastern Colorado and entirely within the South Platte River basin. The South Platte River basin is one of eight major river basins within Colorado, encompassing over 1.3 million acres in Colorado, Wyoming and Nebraska. The South Platte River eventually joins the North Platte River in Nebraska, which then flows into the Missouri and Mississippi Rivers. Drainage basins and streams within the water resources study area and their designated uses are shown in Figure Surface Water Hydrology Human activities have extensively altered the natural hydrologic conditions within the South Platte River basin. The majority of streams have water flows that originate as snowmelt, creating high-flow conditions from May to July, with peak flows in June, and lower flows from October to March. High-intensity precipitation events also greatly affect these streams during the spring and summer months. Alterations to the natural hydrologic regime of the surface water systems within the entire basin affect the quality of aquatic habitat and the species that are dependent on that habitat. Water withdrawals within the basin have also affected the natural potential for streams to dilute contaminants entering from outside sources (USGS, 1998). The majority of soils have low to moderate erosion potential. Wetlands provide benefits to water quality and are typically surrounding flowing water bodies and one of their key functions can be to filter materials and contaminants from stormwater runoff before they reach stream, etc. Additionally, wetlands along waterways usually provide shorebank stabilization which aids to prevent bank erosion, which improves water quality. Wetlands are further discussed in Section Floodplains have been severely altered from their natural state. Historically, the flowing waterbodies in the corridor have been shallow, meandering streams with wide floodplains. However, over time, these floodplains have been made more narrow and deeper in an effort to prevent catastrophic flood events. Surface Water Quality The quality of surface water resources within the South Platte River basin is influenced by factors such as climate, geology, topography, land use patterns, natural water chemistry, stream flow characteristics, stream morphology, and riparian vegetation. Most of the surface water bodies within the South Platte River basin face similar water quality issues primarily due to human activities. These activities include extensive urbanization, flood control activities (e.g., channelization, cementing of banks, grade control structures), extensive in-basin and transbasin diversions, reservoir construction, and pollutant-laden discharges (e.g., point and nonpoint) from multiple sources. Point sources of pollution can include Publicly Owned Treatment Works (POTW) and stormwater sewer discharges, while nonpoint sources of pollution can include runoff from croplands, livestock, urban areas, roads, or construction sites (USGS, 1998). Water Resources Page 3-174

181 Figure Drainage Basins in Project Area Source: CGS, 2003; Fast Tracks I-225 Team, 2009 Water Resources Page 3-175
182 Water Resource Study Area Impairments The majority of the impairments in the project area are associated with Escherichia coli (E. coli) and selenium. E. coli impairments in Colorado streams are generally derived from animal waste, while the source of selenium impairments in Colorado streams is more ubiquitous (CDPHE, 2008a). E. coli can be detected in stormwater runoff, but is not generally associated with LRT facilities (rail or park-n-rides). Although selenium is a naturally-occurring element that is found in rocks, soils, and water, it can be harmful to certain aquatic fish and wildlife species when concentrations are only slightly elevated above normal levels (Lemly, 2002). Streams and their designated uses and impairments are discussed in Table Table Stream Classifications and Impairments Stream Classification 303(d) List Impairments Cherry Creek Aquatic Life Warm 2 Recreation 1a Water supply Agriculture Westerly Creek Aquatic Life Warm 2 Recreation 1a Agriculture Toll Gate Creek Aquatic Life Warm 2 Recreation 1a Agriculture Sand Creek Aquatic Life Warm 2 Recreation 1a Agriculture Source: CDPHE, 2008b, 2008c The project study area drains to Cherry Creek downstream of the reservoir. The reservoir is on the 303(d) list for chlorophyll A and on the Monitoring and Evaluation list for dissolved oxygen. None None E. Coli Selenium All flows within the Sand Creek drainage basin ultimately flow to Sand Creek. The basin represents approximately 30 percent of the drainage area flowing into the project area. Segment 16a of the South Platte River Basin (Sand Creek) has been placed on the (d) List for E. coli and selenium impairments (CDPHE, 2008c). All flows within the Toll Gate Creek drainage basin and Westerly Creek drainage basin ultimately flow to Toll Gate Creek and Westerly Creek, respectively. The Toll Gate basin represents approximately 45 percent of the drainage area flowing into the study. The Westerly Creek basin represents approximately eight percent of the drainage area flowing into the water resources study area. South Platte River Segment 16c (Toll Gate Creek, Westerly Creek), do not have any water quality impairments. This Segment includes all tributaries to the South Platte River from the outlet of Chatfield Reservoir to a point immediately below the confluence with Big Dry Creek, except for a few subbasins. Water Resources Page 3-176
183 Point Source and Non-Point Source Discharges Non-point source discharges are caused by rainfall or snowmelt moving over and through the ground. Natural and human-made pollutants can be picked up by the storm and can include: Excess fertilizers, herbicides, and insecticides from agricultural lands and residential areas Oil, grease, and toxic chemicals from urban runoff and energy production Sediment from improperly managed construction sites and eroding streambanks Salt from irrigation practices Bacteria and nutrients from livestock, pet wastes, and faulty septic systems The majority of permitted point source discharges are located in the northern half of the study area. They include heavy and light industrial discharges, recycling, and one sewage treatment facility. Impervious surfaces exacerbate point source and non-point source discharges altering the characteristics of natural stormwater runoff, including the volume, velocity, and quality of runoff discharged into surface water bodies. Additional paved impervious surfaces would cover soils and vegetation that naturally absorb stormwater and decrease overland flow velocities. Stormwater runoff collects on impervious surfaces and causes increases in the volume and velocity of runoff discharged into nearby surface water bodies following snowmelt and rainfall events. As a result, in the absence of BMPs, these alterations could affect existing hydrologic flow patterns, such as peak discharges, stream channel characteristics, and aquatic habitat within surface water bodies. Greater velocities and volumes of stormwater runoff could result in streambed and bank erosion, especially near outlet structures, and deposition of excess sediment (i.e., sedimentation) into surrounding surface water bodies Groundwater The Preferred Alternative is situated above the consolidated bedrock aquifers of the Denver basin and Dakota-Cheyenne group (a.k.a. South Platte Formation) and the unconsolidated shallow alluvial aquifers associated with the South Platte River and its tributaries (Colorado Geological Survey, 2003). Approximately 69 monitoring wells and six drinking water wells associated with these aquifers are located within the project area. Groundwater from the aquifers is brought to the surface with wells to provide water supply for multiple uses. The major sources of groundwater contamination in Colorado major aquifers, including the Denver basin are animal feedlots, leaking underground storage tanks (LUST), surface impoundments, landfills, septic systems, hazardous waste sites, large industrial facilities, oil and gas exploration, spills, small-scale manufacturing, and repair shops (CDPHE, 2008d). Land-use activities have large impacts on alluvial aquifers in particular, due to their shallow water tables and high permeability. Water Resources Page 3-177
184 Impact Evaluation This section describes the impacts of the No-Action Alternative and Preferred Alternative for each resource. This section discusses potential water quality impacts without the implementation of water quality BMPs. Water quality BMPs are planned for the Preferred Alternative and are discussed in Section The Federal Highway Administration (FHWA) developed the Driscoll Model as a technique to estimate the water quality impacts of a stream or lake that directly receives highway stormwater runoff (FHWA, 1990). The Driscoll Model was applied as part of this evaluation. The modeling approach described herein is consistent with RTD and FHWA guidance and has been used as a screening tool to compare pollutant mass loading between the No-Action Alternative and Preferred Alternative. Additionally, the Driscoll Model predicts in-stream concentrations of constituents that are expected in a once-in-three year storm. These values are then compared to water quality standards developed by the CDPHE-Water Quality Control Division (WQCD). RTD s Environmental Methodology Manual (EMM) specifies that the Driscoll model be utilized at point locations where the transit alignment crosses a stream or where streams are within 300 feet of the transit line or station (RTD, 2008). The Driscoll Model was applied to seven specific areas: Iliff, City Center, 2nd/Abilene, 13th/Toll Gate, I-225/Abilene-Toll Gate, I-225/Abilene Westerly Creek, and Sand Creek that met RTD s criteria of point locations. The I-225 realignment area drains into two different basins (Westerly Creek and Toll Gate Creek), with approximately half the amount of runoff to each basin. The Driscoll Model was applied to each drainage basin. The constituents analyzed using the Driscoll methodology for the proposed project include dissolved zinc and dissolved copper because they are good indicators of stormwater runoff quality from pavement and vehicles. The results of the Driscoll model are presented graphically for each of the areas in Figure and Figure Loading is measured in pounds of constituent leaving the roadway per a median rainfall event. The loads for the No-Action Alternative are used as a baseline comparison to the Preferred Alternative. An alternative with a higher predicted load (i.e., a greater quantity of constituent leaving the road) would typically have more water quality impacts than another alternative. However, the Driscoll model does not account for water quality BMPs, which will be included in the Preferred Alternative (see Section ) and will reduce the water quality impacts of the Preferred Alternative. Water Resources Page 3-178
185 Figure Driscoll Model Results for Zinc Figure Driscoll Model Results for Copper Water Resources Page 3-179
186 No-Action Alternative The No-Action Alternative is described in detail in Chapter 2. Existing water quality in the study area is not pristine under the No-Action Alternative. As previously mentioned, the Preferred Alternative lies within an urban environment that has already experienced many impacts from man-made activities. The No-Action Alternative would not increase the impervious surface area relative to existing conditions. The No-Action Alternative showed lower predicted contaminant loading than the Preferred Alternative. No impacts to groundwater are expected under the No-Action Alternative. Indirect Impacts If stormwater is left untreated, the No-Action Alternative could cause indirect impacts later in time or at some distance downstream and upstream. These indirect impacts include alterations to natural channel movement processes (i.e., meandering, channel incision) and the continual degradation of aquatic habitat. Cumulative Impacts Urbanization, including the conversion of vacant land to commercial and residential developments, has increased impervious surfaces cumulatively across the Project Study Area. This has affected the natural hydrology and water quality of the streams in the area. Non-point contamination from impervious surfaces such as petroleum products, fertilizers, pesticides, and animal waste is carried to surface waters as storm runoff. Historically, water quality protection from storm runoff was not provided in new development projects, resulting in a gradual degradation of water quality from non-point source pollution. Under current regulations, stormwater controls are required for all new developments. This has helped to mitigate the effects of development on water quality. Consequently, under the No-Action Alternative, water quality is not expected to decrease beyond its current state, and may improve with adherence to more rigorous water quality controls (RTD, 2007) Preferred Alternative The Preferred Alternative is described in detail in Chapter 2. Direct effects on surface water quality from the Preferred Alternative would result from the addition of paved impervious surfaces, primarily from station platforms, park-n-ride lots and stations, elevated structures, and areas where streets must be widened to accommodate the LRT vehicles. Of all the Preferred Alternative features, the proposed park-n-ride facilities would result in the greatest increase of impervious surfaces. Areas of at-grade LRT lines on ballast material are not considered as impervious surfaces because rail ballast material is relatively permeable. The impacts common to the No-Action and Preferred Alternative in the absence of BMPs are included in Table Water Resources Page 3-180
187 Table Common Impervious Surface Related Surface Water Quality Impacts Sediment Anti-Icing / De- Icing Chemicals (Salt-Based Deicers) Metals Nutrients General Construction Activities Construction of new piers, culverts, etc. Direct Impacts in the Absence of BMP Treatment Harmful to aquatic life. Sedimentation directly degrades aquatic habitat. Suspended sediment increases turbidity and reduces aquatic plant life productivity. Suspended sediment can be fatal to aquatic species by reducing dissolved oxygen levels (Trombulak and Frissell, 2000). Potentially harmful to aquatic species, including plants. CDOT is conducting research to better understand the aquatic life effects. Toxic to aquatic life. Bio-accumulation. Metals that bind to suspended solids and decaying organic matter can persist in the environment for long periods of time. Contamination of drinking water supplies. Toxic to aquatic life. Excessive nutrients, primarily nitrogen and phosphorus, can cause extreme algal growth, which is toxic to certain aquatic organisms. Algal blooms and die-off causes large swings in dissolved oxygen levels and in extreme cases fish kills. Alters aesthetics. Can cause designated use impairments. Erosion. Harmful to aquatic life. Vegetation removal at construction sites increases stormwater runoff velocity and volume causing accelerated erosion. Riparian vegetation removal reduces stream bank stability, accelerates erosion, alters aquatic habitat and shading, and causes in-stream temperature changes. Construction vehicles deposit sediment onto surrounding roads, which is later mobilized during storm events. Erosion. Harmful to aquatic life. Alters streamflow within channel. Erosion/sedimentation upstream and downstream of structures. Reduces quality and quantity of aquatic habitat. Increased Stormwater Velocity & Volume Source: FasTracks I-225 Team, 2009 Erosion. Harmful to aquatic life. Increased stormwater runoff velocity and volume causes stream channelization (i.e., straightening). Channelization increases surface water velocity and exacerbates erosion and sedimentation. Reduces quality and quantity of aquatic habitat. With the implementation of the Preferred Alternative, the study area would have more total impervious surface areas (3,984 acres or a 0.5 percent increase) than the No-Action Alternative (3,964 acres). The Toll Gate Creek Drainage Basin would have the greatest increase in impervious surface (8 acres). A comparison of the impervious areas in each basin for the No- Action and Preferred Alternative is presented in Table To fully understand the impacts from impervious surface area for an alternative, it is important to consider the greater area surrounding the project. Currently, there are approximately 3,964 acres of total impervious surface area that exists within the study area from commercial and Water Resources Page 3-181
188 residential developments and other infrastructure. This helps to provide context that the additional impervious surface area increase from the Preferred Alternative is very small and insignificant in relation to current condition (0.5 percent) of the overall impervious areas in the study area. Table Comparison of Impervious Areas Alternative Cherry Creek Drainage Basin (acres) City Center Drainage Basin (acres) Toll Gate Creek Drainage Basin (acres) Sand Creek Drainage Basin (acres) Baranmor Ditch Drainage Area (acres) Total Impervious Area (acres) No-Action (Existing , ,964 Impervious Area) Preferred Alternative , ,984 Source: FasTracks I-225 Team, 2009 Impervious surface areas closest to waterbodies would have the greatest potential to impact water quality. This primarily occurs in the Toll Gate Creek and Sand Creek Drainage Basins. The Toll Gate Creek Drainage Basin would likely have the greatest potential for water quality impacts because of the proximity of the 13th Avenue park-n-ride to Toll Gate Creek, the two bridge crossings, and the stretch where the rail line parallels Toll Gate Creek. The 13th Avenue park-n-ride is planned to be constructed in an area of open ground where currently water naturally infiltrates through the soil and then minimal storm water is discharged into Toll Gate Creek. By adding eight acres of impervious surface, the storm water volume and contaminants (including hazardous materials) that flow into Toll Gate Creek would increase. The Driscoll model was used to estimate potential water quality impacts at these locations (Figure and 3). The results of the Driscoll model show that the Preferred Alternative estimated contaminant load for the City Center, 2nd/Abilene, I-225 Realignment (Westerly Creek and Toll Gate Creek), and Sand Creek drainage basins are only slightly greater than the No-Action Alternative. The estimated loadings from the Iliff park-n-ride and the 13th Avenue/Toll Gate area show an increase over existing conditions, approximately 170 percent and 36 percent greater, respectively. These areas would contain a larger number of parking spaces compared to the other park-n-rides. For all instances, except for the Iliff Station, the additional loading from the park-n-ride is within the standard removal efficiency of the proposed BMPs. This means that the BMPs should reduce impacts similar to the No-Action Alternative. However, redundant BMPs should be implemented at the Iliff Station to reduce impacts similar to the No-Action Alternative. Based upon the predicted in-stream concentrations from the Driscoll Model, exceedance of water quality standards are not likely. The model does predict a slight exceedance of standards, but because of the conservative model assumptions and the uncertainties associated with the model simplistic stream dilution and difficulty with predicting first-flush event compared to subsequent rainfall events exceedances are not anticipated. Additionally, the Driscoll Model suggests the addition of permanent structural stormwater BMPs to be applied to reduce the Water Resources Page 3-182
189 likelihood of exceedances of water quality standards. The removal efficiencies for these types of BMPs (e.g., extended detention basin) are 50 percent to 70 percent total suspended solids (TSS) and 30 percent to 60 percent (total zinc) (CDOT, 2004). Based on these removal efficiencies, it is assumed that the BMP will reduce the amount of contaminants in the stormwater before it reaches surface waterbodies. The primary water quality impact would occur during operations from the application of traction sand in parking lots during winter months. Groundwater Groundwater quality impacts were evaluated by estimating the number of groundwater wells within the study area. The number of groundwater wells located within the study area was evaluated because active groundwater wells may need to be relocated, and existing wells may need to be plugged, sealed, and abandoned due to their proximity to the project. There are a total of 69 monitoring wells and six drinking water wells within the water resource study area as illustrated on Figure None of the 75 wells are within the construction footprint. Most of the wells are monitoring wells, and do not substantially affect groundwater quality. Most of the wells are located in the City Center Drainage Basin and Toll Gate Creek Drainage Basin. Indirect Impacts If stormwater is left untreated, the Preferred Alternative could cause indirect impacts later in time or at some distance downstream and upstream. These indirect impacts include alterations to natural channel movement processes (i.e., meandering, channel incision) and the continual degradation of aquatic habitat. Indirect water quality impacts are likely associated with TOD near some stations. These improvements are likely to occur in areas where open land currently exists. It is uncertain that TOD would occur without the development of the Preferred Alternative. However, these areas of TOD growth occur in areas covered by the City of Aurora s RTD and CDOT MS4 Permit and thus, would have to comply with the conditions, including capturing and treating stormwater of that permit and inclusion of temporary and permanent BMPs. Temporary Construction Impacts The implementation of the Preferred Alternative would result in temporary construction-related impacts at all water body crossings if left unmitigated. Construction-related impacts and the proposed mitigation to minimize these impacts are included in Table If groundwater is encountered during construction, a dewatering permit is required from the WQCD. Groundwater encountered during construction is not allowed to be discharged directly to surface water. Cumulative Impacts Cumulative impacts for the Preferred Alternative would be similar to those for the No-Action Alternative. Generally, water quality impacts occur as a result of the addition of impervious surfaces, associated with LRT stations and park-n-rides. Currently, there are approximately 3,964 acres of total impervious surface area that exist from commercial and residential developments and other infrastructure. To provide context, the additional impervious surface area from the Preferred Alternative (20 acres) is very small (0.5 percent) and insignificant in Water Resources Page 3-183
190 relation to current condition. Additionally, stormwater quality controls as part of the Preferred Alternative would minimize water quality impacts. Regionally, the implementation of all of the FasTracks projects would have a small effect on the amount of new impervious surfaces. Given existing stormwater controls, water quality is not anticipated to degrade over existing conditions. In instances where park-n-rides are being built in redeveloped areas, the water quality may improve with adherence to more rigorous water quality controls without the FasTracks projects. The implementation of the Preferred Alternative and the other FasTracks projects would be expected to increase the development density around proposed stations, but because these areas would require stormwater quality controls, the further impact to water quality would be negligible Mitigation Measures Table summarizes water resource impacts and mitigation measures of the Preferred Alternative. Table Summarization of Water Resource Impacts and Mitigation Measures Impacts Direct Impacts Impacts on surface water due to increased impervious surfaces Increase in mass pollutant loading Impacts to groundwater wells Mitigation Measures Implementation of permanent structural BMPs for the park-n-ride areas at Iliff and 13th Avenue will require routine maintenance to ensure their functionality Proper monitoring and feedback mechanisms for longterm functionality of permanent BMPs, as well as compliance with RTD, City of Aurora, City and County of Denver, and CDOT MS4 permits RTD will work with CDOT, City of Aurora, and City and County of Denver to comply with their MS4 requirements and build water quality ponds as necessary. Mitigation will be consistent with CDOT s MS4 design criteria identified in the New Development and Redevelopment Program (CDOT, 2004) Low-impact development practices in park-n-ride areas Water quality ponds near the downgradient portions of the park-n-ride facilities and near the three stream crossings (two crossings at Toll Gate Creek and at Sand Creek). Riprap to reduce water quality impacts by protecting stream systems from accelerated erosion and sedimentation processes that can occur from structures Non-structural BMPs such as: parking lot sweeping, spill containment measures, project construction phasing, winter maintenance practices (using liquid deicers instead of sand/salt mixtures) All wells within the final right-of-way would need to be plugged, sealed and abandoned, and any active wells would need to be relocated Water Resources Page 3-184
191 Impacts Indirect Impacts Impacts from development around stations. Temporary Construction Impacts Vegetation removal at construction sites increase stormwater runoff velocity and volume Sediment deposit onto surrounding roads from construction vehicles Source: FasTracks I-225 Team, 2009 Mitigation Measures A stormwater management plan for this project will be prepared for all areas of the project affecting CDOT s right-of-way. No mitigation required Temporary construction BMPs such as: silt fences, erosion log barriers, and temporary check dams A Colorado Discharge Permit System Construction Stormwater Permit will be required for the implementation of the Preferred Alternative In construction areas within Aurora, plans must comply with Aurora specifications including City of Aurora Stormwater (Quality) Discharge Permit for Construction Activities. In construction areas within CDOT s right-of-way, plans must comply with CDOT specifications, including the CDOT Water Quality Consent Decree issued by the Colorado Department of Public Health and Environment (effective January 1, 2009) CDOT s specifications for managing stormwater at a construction site will be followed in construction areas If groundwater is encountered during activities associated with excavations for caisson/retaining walls, a separate Clean Water Act Section 402 Construction Dewatering Permit or Individual Construction Dewatering Permit may be required to be obtained from the CDPHE - WQCD Water Resources Page 3-185
192 3.18 Floodplains This section described floodplains in the vicinity of the project, evaluates the impact of the No- Action Alternative and the Preferred Alternative with regard to floodplains, and where appropriate identifies mitigation measures for the Preferred Alternative. It is important to evaluate whether the project would limit the current natural conveyance of floodwaters or modify the water surface elevation. This section evaluates whether the project would be built in or modify the existing 100-year floodplain. The evaluation was performed in accordance with applicable floodplain regulations. Addition to impervious surfaces would require the use of detention systems so that excess storm runoff associated with an increased impervious area within the basin would not exceed current runoff amounts Affected Environment The 100-year floodplain is defined as lands on either side of a stream that are inundated when the capacity of the stream channel is exceeded by a flood during a 100-year storm event (i.e. the flood having a one percent chance of being equaled or exceeded in any given year (base flood). Encroachment of any of the floodplains would be subject to the requirements of local jurisdictions. Figure illustrates the three flooding sources in the vicinity of the project that have a Federal Emergency Management Agency (FEMA) designated floodplain. The flooding sources and their FEMA Special Flood Hazard Area (SFHA) designations are as follows. The SFHA is an area that is subject to inundation by the base flood. Toll Gate Creek - the FEMA SFHA designation for Toll Gate Creek is a Zone AE, meaning it has established base flood elevations (BFEs). There is also a designated floodway along Toll Gate Creek which will require additional coordination with FEMA and the local jurisdictions. The Preferred Alternative crosses Toll Gate Creek in two locations and runs parallel to the floodplain for a portion of the alignment. The first crossing occurs south of the proposed 13th Avenue Station on the east side of I-225. The second crossing occurs on the west side of I-225 near 13th Avenue. Sand Creek - is also designated as a Zone AE and has an established floodway at the existing Peoria Street bridge. The requirements and coordination will be the same as those on Toll Gate Creek. The Preferred Alternative would cross Sand Creek just downstream (west) of the existing Peoria Street bridge. A floodway, which is smaller than a floodplain, is designated for Sand Creek in this vicinity. Baranmor Ditch - is designated as an approximate Zone A area according to FEMA. Zone A is a SFHA with no BFEs determined. At present, a project is underway to modify the alignment of the ditch on the west side of Peoria (YES, 2008). Furthermore, UDFCD is preparing an Outfall Systems Plan. Once the facility has been constructed the current Zone A boundaries on the FIRM will be modified. The Preferred Alternative would cross this ditch on the west side of Peoria Street between 30th and 33rd Avenues. Floodplains Page 3-186

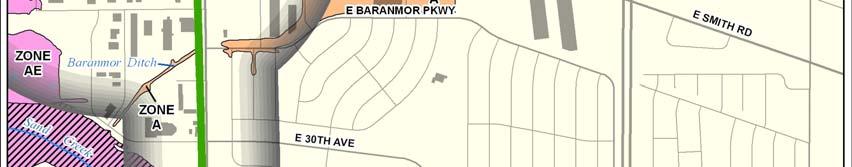
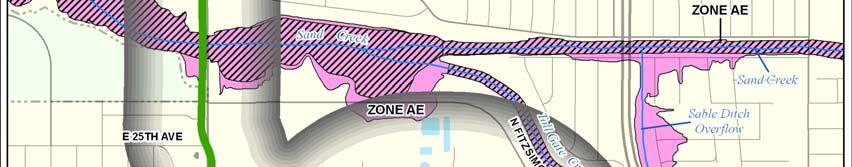
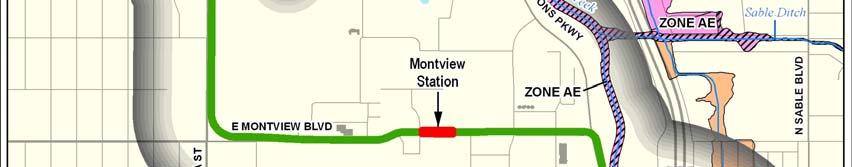
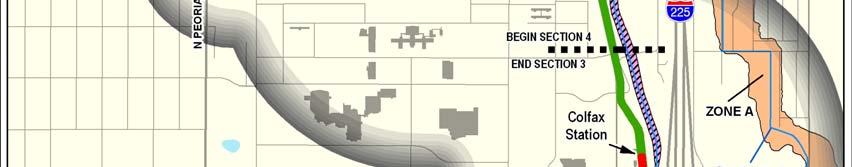

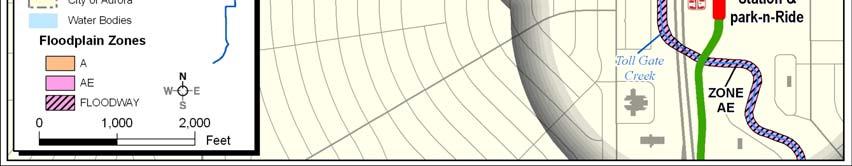
193 Figure Year Floodplains - Sections 3 and 4 Source: FEMA 1995 and 1998; and FasTracks I-225 Team, 2008 Floodplains Page 3-187
194 Impact Evaluation Several streams, ditches and water features are located within the Study Area. A baseline map of the floodplains associated with these water features was developed using the FEMA Flood Insurance Rate Maps (FIRMs). Drainage Master Plans and Flood Hazard Area Delineations (FHADs) were obtained from Urban Drainage and Flood Control District (UDFCD) which have been incorporated into the floodplain mapping. See Figure for the I-225 floodplain boundaries and locations of the affected streams within the project area. The impacts were then assessed to evaluate if they would cause a change in the BFEs and/or stormwater runoff No-Action Alternative The No-Action Alternative is described in detail in Chapter 2. The No-Action Alternative would not result in direct impacts to floodplains because no I-225 corridor LRT facilities would be constructed. Other transportation projects included in the No-Action transportation network may have impacts to floodplains. The impacts of these other projects have been or will be considered in the NEPA process for each of these projects, and avoidance, minimization, and/or mitigation specified, as appropriate, in the specific NEPA decision documents for each project. Indirect Impacts The No-Action Alternative would have indirect impacts to floodplains and drainage/hydrology due to additional impervious surfaces introduced by new development. Impacts due to these developments would be avoided through adherence to local development requirements which would mitigate runoff at pre-development levels. Cumulative Impacts The amount of impervious surfaces and runoff would continue to increase with current urbanization trends. Since the 1950s, the project area has undergone a 75 percent reduction in herbaceous land cover and a 507 and 264 percent increase in non-residential and residential development, respectively (RTD, 2007). This increase in developed land cover and decrease in pervious land cover causes an increase in urban runoff, which can modify floodplains of major river systems. Reasonably foreseeable future developments and roadway extensions and widening would contribute to this increase in imperviousness. Many of these projects would occur on vacant land where water is presently able to percolate from the surface. Development over this land would modify surface hydrology. Nevertheless, existing stormwater controls continue to mitigate these impacts Preferred Alternative The Preferred Alternative is described in detail in Chapter 2. Direct Impacts to Floodplains As described above, there are three flooding sources with FEMA designated floodplains that have the potential to be affected by the Preferred Alternative. Table summarizes the locations of potential impacts to the floodplains within Section 3 and 4. There are no expected floodplain impacts within Section 1 or 2. Floodplains Page 3-188
195 Table Potential Impacts on Floodplains Floodplain Section 3 Toll Gate Creek Section 4 Sand Creek Potential Impact Crossing on the east side of I-225 based on initial design concepts, a singlespan bridge (approximately 145 feet) with vertical wall abutments is proposed at this location. The abutments are expected to be located outside of the current floodplain. This new bridge crossing south of the 13th Avenue Station would result in an increase of 0.4 foot in the water surface elevation over the existing conditions hydraulic model. Crossing on the west side of I-225 based on initial design concepts, a two span bridge with piers running parallel to the floodplain boundaries and vertical wall abutments is proposed. Both abutments are outside of the current floodplain boundaries, however, the piers would be within the floodplain boundaries. This new bridge crossing would result in a 1.68 foot increase of the water surface elevation. After this crossing, the track would run on the west side and parallel to the creek to just south of Colfax. This section of track is close to the floodplain boundaries designated by the Federal Emergency Management Agency (FEMA) and, therefore, the floodplain could be impacted by the construction of the track and retaining wall. The water surface increase due to this construction would be minimal. Based on initial design concepts, a three-span bridge is proposed at Sand Creek on the west side of Peoria Street. The piers would line up with the existing Peoria Street bridge pier locations. The proposed bridge piers and vertical wall abutments would be located within the floodplain. There would also be vertical retaining walls positioned to parallel Peoria Street on the south side to accommodate the LRT alignment. This new bridge crossing and retaining walls would result in a 0.8 foot increase in the water surface elevation. The existing culvert under Peoria Street would likely need to be resized and extended under the proposed track alignment, consistent with UDFCD s Outfall Systems Plan and cost sharing agreements. There is also a need to provide Baranmor Ditch access to existing businesses on the west side of Peoria Street and south of the ditch. This will require a new roadway and a culvert under the new roadway at the ditch crossing. The culvert extension and new culvert will modify the floodplain. There will likely be both increases and decreases in the width of the SFHA. Source: FasTracks I-225 Team, 2009 Floodplains Page 3-189
196 Direct Impacts to Drainage/Hydrology There would be impacts to the stormwater runoff amount as described for each section below. However, the increase in the stormwater runoff will not impact the floodplains since all increased runoff due to increases in impervious areas will be detained in stormwater management ponds (to maintain historic flow rates) before discharging to the creeks. In general, quantitative analysis for floodplains would occur during preliminary engineering activities, or at 65 percent design. Section 1 Nine Mile to Exposition There would be an increase in impervious areas due to the park-n-ride facilities at the Iliff Station as well as the station platforms at Iliff and Florida. Additionally, the area between the LRT and existing sound wall just south of Yale would be paved to minimize CDOT maintenance concerns (i.e. area not wide enough for mowing). This would further increase the total impervious area in this section, resulting in an increase in stormwater runoff. Total overall increase to the impervious area in this section is approximately 9.5 acres. There are no floodplains in Section 1. Section 2 City Center There would be an increase in impervious areas due to the park-n-ride facilities at the City Center Station as well as the station platforms at City Center and 2nd/Abilene. The new rail alignment within this section would be ballasted track within the center of the existing roadway along Exposition as well as a portion of Sable and Ellsworth which would require the road to be widened through these areas. Roadway widening would increase impervious areas, resulting in an increase in stormwater runoff. Total overall increase to the impervious area in this section is approximately 5.9 acres. There are no floodplains in Section 2. Section 3 Ellsworth Fitzsimons/Montview There would be an increase in impervious areas due to the park-n-ride facilities at the 13th Avenue Station as well as the station platforms at 13th Avenue and Colfax Avenue. The ballasted track would be replaced in open area which would also cause an increase to the impervious area, resulting in an increase in stormwater runoff. Total overall increase to the impervious area in this section is approximately 3.3 acres. Section 4 Fitzsimons/Montview to Peoria/Smith There would be an increase in impervious areas due to the station platforms at Montview and Peoria/Smith. There would be a further increase to impervious areas and stormwater runoff because the paved side of Montview Boulevard would replace the existing open area. Total overall increase to the impervious area in this section is approximately 1.3 acres. Indirect Impacts The Preferred Alternative would have indirect impacts to floodplains and drainage/hydrology due to additional impervious surfaces introduced by TOD around stations. Impacts due to these developments would be avoided through adherence to local development requirements. Floodplains Page 3-190
197 Temporary Construction Impacts The Preferred Alternative would have temporary construction impacts to floodplains and drainage/hydrology due to construction that would occur within the floodplains of Toll Gate Creek, Sand Creek and the Baranmor Ditch. Cumulative Impacts The Preferred Alternative would result in increased in-fill development and the revitalization of neighborhoods. This phenomenon would cause slightly less of an increase in impervious surfaces than the No-Action Alternative, which is anticipated to cause more sprawled development. Impacts associated with additional impervious surfaces would be managed to predevelopment conditions using jurisdictional detention requirements, which have proven to be effective in minimizing the effects of urban runoff (RTD, 2007). Impervious surfaces cause an increase in urban runoff, which can modify floodplains of major river systems. New development in the study area associated with the Preferred Alternative and other local actions would continue to increase the amount of impervious surfaces and would continue to modify surface hydrology. Nevertheless, as noted, existing stormwater controls continue to mitigate these impacts Mitigation Measures Encroachment within any of the floodplains will be subject to the requirements of local jurisdictions. RTD will coordinate floodplain management with local jurisdictions and UDFCD regarding the potential floodplain and floodway impacts. Complete detention and water quality treatment will be in accordance with the UDFCD and local jurisdictions. Increases in stormwater runoff would be reduced to the current conditions by the use of detention facilities, as appropriate as discussed in Table During construction activities, Best Management Practices (BMPs) for erosion and runoff control would be implemented. Detention systems would allow for the storage and control of stormwater runoff. Floodplains Page 3-191
198 Table Jurisdictional Requirements for Onsite Detention Facilities Jurisdiction Urban Drainage and Flood Control District (UDFCD) City and County of Denver City of Aurora* Flood Levels Minor 5- and 10-year plus water quality capture volume (WQCV) 10-year plus WQCV 10-year plus WQCV plus an additional 20% of the WQCV to account for sedimentation Major 100-year plus no less than one-half WQCV 100-year plus onehalf WQCV 100-year plus WQCV Freeboard Requirements 1 foot above the water surface elevation when the emergency spillway is conveying the maximum design or emergency flow Greater than or equal to 5 acres 1 foot above water surface elevation when the emergency spillway is conveying the maximum design or emergency flow Less than 5 acres 1 foot above 100-year water surface elevation 1 foot above the 100-year water surface elevation. Detention Sizing Methods Simplified method based on empirical equations in storage chapter of District Manual Simplified method based on empirical equations in storage chapter of District Manual Simplified method based on empirical equations in storage chapter of District Manual Underground Detention Only in ultraurban setting where no onsurface methods are practicable Only in ultraurban setting where no onsurface methods are practicable Only as a last resort and must be approved by City, when all other alternatives are exhausted Aboveground Detention Preferred Preferred Preferred Sources: UDFCD, 2008; City and County of Denver, 2006; City of Aurora, 2005 * The City of Aurora spans both Adams and Arapahoe Counties. The counties do not have jurisdiction over the detention facilities and therefore are not considered. Floodplains Page 3-192
199 Table summarizes floodplain impacts and mitigation measures from the Preferred Alternative. Table Summarization of Floodplain Impacts and Mitigation Measures Impact Mitigation Measures Direct Impact Toll Gate floodplain new piers would result in slight increase to the water surface elevation Sand Creek floodplain - new piers and abutment would result in slight increase to the water surface elevation Baranmor Ditch floodplain resize and extend culvert, new culvert would result in both increases and decreases in the SFHA Additional impervious surfaces at park-n-ride facilities Indirect Impacts TOD development with additional impervious surfaces, which would adhere to local development requirements Temporary Construction Impacts Construction would occur within floodplains of Toll Gate Creek, Sand Creek and the Baranmor Ditch. Source: FasTracks I-225 Team, 2009 Perform additional hydraulic analysis during the design phase to determine increases in water surface elevations caused from the new structure and retaining walls. Onsite detention in accordance with UDFCD and local jurisdictional requirements Baranmor Ditch Floodplain culvert will be designed to safely convey 100-year flow and would result in both increases and decreases in the SHFA. No mitigation required UDFCD and local jurisdictional requirements Floodplains Page 3-193
200 3.19 Wetlands/Waters of the U.S. This section identifies wetlands and Waters of the U.S. in the vicinity of the project, describes impacts of the No-Action Alternative and Preferred Alternative on these resources, and where appropriate, mitigation measures should be incorporated to address impacts. For this analysis, wetlands and other waters were evaluated with a study area buffer of 300 feet from the centerline or 300 feet from the boundaries of other LRT facilities. Wetland resources are protected under Section 404 of the Clean Water Act (CWA) and Executive Order 11990, Protection of Wetlands (United States of America, 1977). Many wetlands and open water features are considered jurisdictional Waters of the U.S. by the U.S. Army Corps of Engineers (USACE). These Waters of the U.S. and associated wetland features are under the jurisdiction of the USACE, and projects that will discharge dredged or fill materials into these features are subject to permitting by the USACE. Non-jurisdictional wetlands are not subject to permitting by USACE under Section 404 of the CWA; however, all federal agencies are required to avoid and minimize wetland impacts to the extent possible per Executive Order In order to be consistent with FTA, and FHWA policies, both the CDOT and RTD follow the same guidelines. Thus, these agencies require mitigation of impacts to non-jurisdictional wetlands on a 1:1 ratio. RTD will require mitigation for all wetland impacts. Wetlands are important because they moderate the rate of flow of water in streams and rivers, cleanse water through the removal of nutrients, organic matter and sediments, and support classes of organisms that are economically or aesthetically valuable and cannot grow elsewhere. Jurisdictional wetlands are areas that contain hydrophytic vegetation, hydric soils, and wetland hydrology and abut or are adjacent to Waters of the U.S Affected Environment The study area crosses two perennial drainages and portions of their associated floodplains, including Sand Creek and Toll Gate Creek. These areas have been altered due to urban development, including the construction of I-225, residential and commercial properties, and numerous streets. A preliminary review of the study area was completed in Winter 2007 and Spring 2008, to assess potential wetlands and Open Waters (OW). The project team referenced open water areas as OW before the jurisdiction was determined, then as Waters of the U.S. once a response was received from the USACE. An Approved Jurisdictional Determination request was submitted to the USACE on April 8, 2008, for these features. An Approved Jurisdictional Determination was returned on October 8, Due to an alignment shift several additional potential wetlands and/or Waters of the U.S. were also identified after the Jurisdictional Determination was submitted. A Jurisdictional Determination was not requested for these features, so they are assumed to be jurisdictional. These wetlands will be assumed jurisdictional for the remainder of the project and include Wetlands (WL) 14-1, WL 10-2 and WL Field crews surveyed the Study Area in July and October, 2008, by driving and/or walking to identify and delineate existing wetlands and other water features. The delineations were performed in conformance with the 1987 Army Corps of Engineers Wetland Delineation Manual (Environmental Laboratory, 1987). The Interim Regional Supplement to the Corps of Wetlands/Waters of the U.S Page 3-194
201 Engineers Wetland Delineation Manual: Great Plains Region was also used as a reference (USACE, 2008). Ten jurisdictional Waters of the U.S. totaling 6.43 acres, were identified in the study area and are summarized in Table Table Summary of Jurisdictional Waters of the U.S. in Study Area Section Feature Hydrologic Source Acres in Study Area OW 14-1 Combination Section 1 OW 13-1 Stormwater OW 11-1 Combination Section 2 OW 7-2 High Line Canal Irrigation OW 7-2 High Line Canal Irrigation Section 3 OW 5-1 Toll Gate Creek Natural OW 5-3 Stormwater OW 5-1 Toll Gate Creek Natural Section 4 OW 2-2 Sand Creek Natural OW 2-1 Irrigation Total Source: FasTracks I-225 Team, 2008 BOLD acreage reflects features that have not received a Jurisdictional Determination by the USACE, but are assumed to be jurisdictional Table summarizes jurisdictional and non-jurisdiction wetlands found within the study area. Three wetland areas were identified as highly functional (those wetlands deserving a high standard of protection), including the wetlands associated with Toll Gate Creek (WL 5-1), Sand Creek (WL 2-2) and WL 6-2. Of the acres of wetlands, acres (WL 5-1) are located within CDOT right-of-way and will be addressed within the CDOT Wetland Finding Report. Wetlands/Waters of the U.S Page 3-195
202 Table Summary of Wetlands in the Study Area Feature Community Type Source Section 1-Nine Mile to Exposition Acres of Wetlands (Total Jurisdictional &non- Jurisdictional) WL 14-1 PEM Combination WL 11-1 PEM/PSS Combination WL 10-2 PEM Stormwater Section 2-City Center WL 7-3 PEM Stormwater WL 8-1 PEM/PSS Stormwater Section 3-Ellsworth To Fitzsimons/Montview WL 7-3 PEM Stormwater WL 7-2 PEM Natural/Irrigation WL 6-2 PSS Natural WL 5-1 PSS/PEM Natural WL 5-3 PEM Stormwater Section 4-Fitzsimons/Montview to Peoria/Smith WL 5-1 PEM/PSS Natural WL 2-4 PEM Stormwater WL 2-2 PEM/PSS Natural WL 2-1 PEM Irrigation Source: FasTracks I-225 Team, 2008 PEM= Palustrine Emergent PEM/PSS= Palustrine Emergent and Scrub/Shrub combination PSS= Palustrine Scrub/Shrub BOLD acreage reflects jurisdictional wetlands Impact Evaluation Total Impacts to wetlands and other water features were assessed in terms of direct, indirect, temporary construction, and cumulative impacts No-Action Alternative The No-Action Alternative is described in detail in Chapter 2. The No-Action Alternative would not result in direct impacts to wetlands because no I-225 corridor LRT facilities would be constructed. Other transportation projects included in the No-Action transportation network may have wetland impacts. The impacts of these other projects have been or will be considered in the NEPA process for each of these projects, and avoidance, minimization, and/or mitigation specified, as appropriate, in the specific NEPA decision documents for each project. Wetlands/Waters of the U.S Page 3-196
203 Indirect Impacts Indirect impacts to Waters of the U.S. and wetlands include sedimentation, erosion, and noxious weed invasion. Best management practices, such as the use of on-site detention, will minimize this potential impact. Cumulative Impacts Since 1950, the amount of wetlands located in the greater Metro Region has decreased due to a doubling in population growth. Historically, Colorado s wetlands only accounted for 3 percent of the surface area of the state. Due to a lack of regulations prior to the early 1970s, up to 50 percent of those wetlands have been lost, which is proportionately greater than other habitat type losses in Colorado (RTD, 2007a). Improved regulations now protect wetlands, which means the loss of wetlands will be markedly less than was experienced historically. However, under the No-Action Alternative, future land use would be more dispersed and would have greater potential to affect wetlands and Waters of the U.S Preferred Alternative The Preferred Alternative is described in detail in Chapter 2. Direct Impacts The Preferred Alternative would result in impacts to five jurisdictional Waters of the U.S. totaling acre within the permanent project footprint (Table ). In addition, wetlands with a total acreage of acre would be impacted by the permanent project footprint (Table ). Of the acres, acres (WL 5-1) are located within CDOT right-of-way and will be addressed in the CDOT Wetland Finding Report. Thus, maximum permanent impacts would be acre. Figure through Figure illustrates the locations of impacts to Waters of the U.S. and wetlands. Direct impacts to wetlands and Waters of the U.S. associated with Toll Gate Creek and Sand Creek noted in Tables and may be further minimized based on the placement and design of the bridge abutments and piers as discussed in Table Wetlands/Waters of the U.S Page 3-197
204 Table Direct Permanent Impacts to Jurisdictional Waters of the U.S. Feature Source Section 1-Nine Mile to Exposition Acres within Permanent Project Footprint OW 11-1 Combination None OW 7-2 High Line Canal OW 5-1 Toll Gate Creek OW 2-2 Sand Creek OW 2-1 Baranmor Ditch Source: FasTracks I-225 Team, 2008 Section 2-City Center Section 3-Ellsworth To Fitzsimons/Montview Irrigation Natural Section 4-Fitzsimons/Montview to Peoria/Smith Natural Irrigation Total Table Direct Permanent Impacts to Wetlands Feature Community Type Source Acres of Wetlands (Total Jurisdictional & Non- Jurisdictional) in Permanent Project Footprint Section 1-Nine Mile to Exposition None Section 2-City Center None Section 3-Ellsworth To Fitzsimons/Montview WL 7-2 PEM Natural/Irrigation WL 5-1 PSS/PEM Natural Section 4-Fitzsimons/Montview to Peoria/Smith WL 2-4 PEM Stormwater WL 2-2 PEM/PSS Natural Total Source: FasTracks I-225 Team, 2008 PEM= Palustrine Emergent PEM/PSS= Palustrine Emergent and Scrub/Shrub combination PSS= Palustrine Scrub/Shrub BOLD acreage reflects jurisdictional wetlands Wetlands/Waters of the U.S Page 3-198


205 Figure Wetland and Waters of the U.S. Impacts within Section 1 Source: FasTracks I-225 Team, 2008 Wetlands/Waters of the U.S Page 3-199


206 Figure Wetland and Waters of the U.S. Impacts within Section 3 (Near High Line Canal) Source: FasTracks I-225 Team, 2008 Wetlands/Waters of the U.S Page 3-200

207 Figure Wetland and Waters of the U.S. Impacts within Section 3 Source: FasTracks I-225 Team, 2008 Wetlands/Waters of the U.S Page 3-201


208 Figure Wetland and Waters of the U.S. Impacts within Section 4 Source: FasTracks I-225 Team, 2008 Wetlands/Waters of the U.S Page 3-202