Current Status of Recycling and Thermal Waste Destruction in the U.S.
|
|
|
- Darren Freeman
- 5 years ago
- Views:
Transcription
, City University of New York (CUNY) Director, Earth Engineering Center Presentation to: The Responsible")
1 Current Status of Recycling and Thermal Waste Destruction in the U.S. Marco J. Castaldi Chemical Engineering Department City College (CCNY), City University of New York (CUNY) Director, Earth Engineering Center Presentation to: The Responsible Management of Waste Foams and Plastics Mixed with Flame Retardants April 12, 2016 Berkeley, CA
2 Perspective on Wastes 1E+12 1E+11 1E+10 Tons (metric) 1E+09 1E+08 1E+07 1E CO2 MSW Waste Nuclear
 Lowest")
3 Waste Hierarchy Highest Desirability All are needed to sustainably manage waste (i.e. complementary) Lowest
 Continuous Emission Monitoring System")
4 Waste to Energy (WTE) Overview High-temperature Combustion Odors Burned in Boilers Enclosed Unloading and Storage Areas Urea Injection* Acid Gas Scrubbers Tall Stack Baghouse or ESP Manua l Stack Tests Environmental Management System Ash Wetted Carbon Injection Newer Installations include Selective Catalytic Redution (SCR) Continuous Emission Monitoring System (CEMS)
5 Extraction of value from wastes is sustainable Conserves fossil fuels by generating electricity. (Energy) 1 ton of waste combusted = 45 gallons of oil or 0.28 tons of coal Most WTE facilities in U.S. process between 500 and 3,000 tons of waste per day Electricity for 2.8 million homes WTE facilities process 14% of the MSW in the United States. (Health) Trash-disposal needs about than 37 million people Reduce greenhouse gas emissions. (Climate, global) EPA estimates :WTE facilities prevent 33 million metric tons of CO2 per year avoided Compatible with recycling. (Resource Minimization) Communities served by WTE recycle 35% of their trash, compared to 30% for the general population. Annually removes more than 700,000 tons of ferrous materials ~ 3 million tons of WTE ash reused as landfill cover, roadbed, or building material.
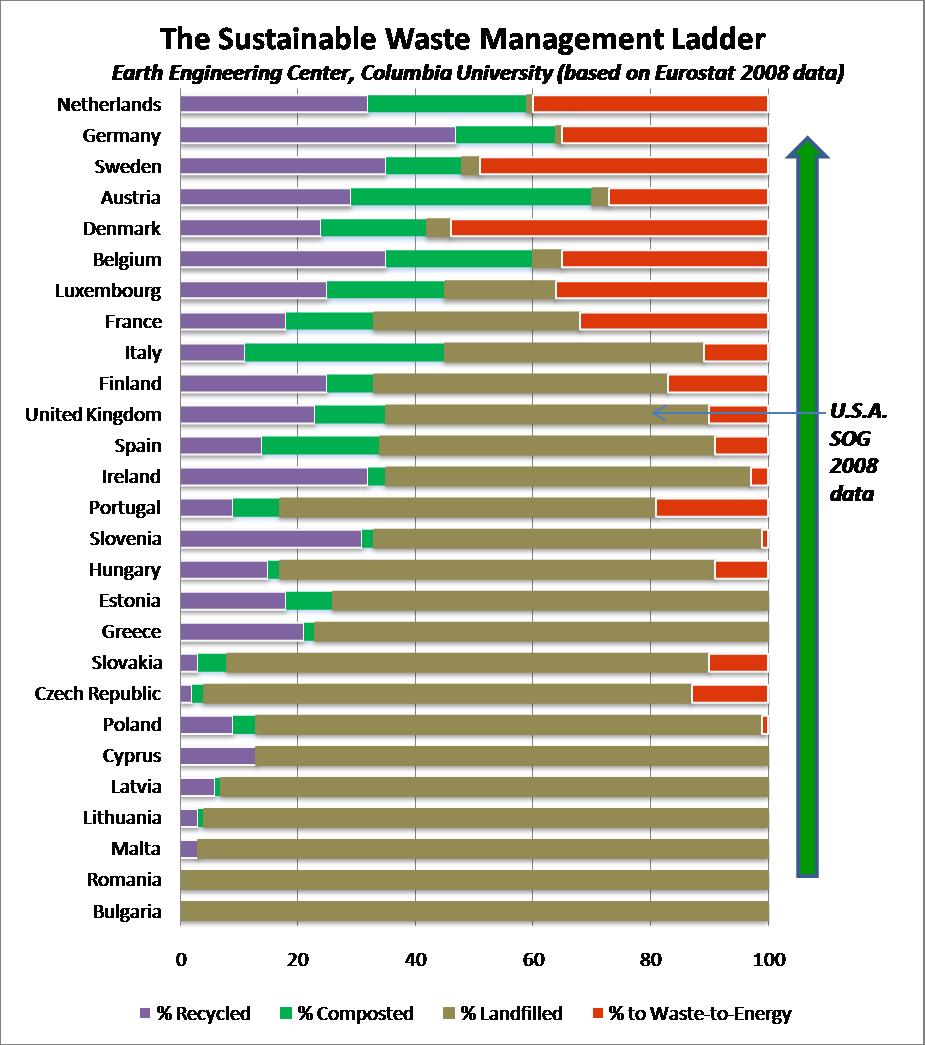
6 Ladder

7 WTE Again, as thermal conversion (WTE) is employed, recycling increases Landfill
8 Plastics are well suited for thermal conversion Energy value of NRP compared to the fossil fuels used in the U.S. (lower heating value, Btu/lb) Natural gas Crude oil Petroleum coke Non-recyclable plastics U.S. Coal, high U.S. Coal, low Wood
9 Products of Thermal Conversion of Waste Heat/Power & CO 2 and H 2 O (Goal for Combustion/Incineration) Typically kwh per ton of MSW Syngas (Goal for gasification/pyrolysis) biomass waste: 300 Btu ft -3 non-recyclable plastic (NRP) waste: 900 Btu ft -3 Typical Composition of Syngas: 12.8% H 2, 11.4% CO and 3.7% CH 4, H 2 /CO = 1.1. Claimed HHV = 107 and 268 BTU ft -3 (4 10 MJ m 3 ). EEC CCNY measured HHV = BTU ft -3 ( MJ m 3 )
")
10 WTE (Mass Burn) Status (metric tons) Number of nations using WTE: 35 Total number of WTE plants > 600 Estimated global WTE: 170 million tpy U.S. WTE: 26 million tpy (81 plants) Urban global landfilling: 830 million tpy U.S. landfilling: 225 million tpy Recent expansions of ~800,000 tpy New US Facility ~ 1 million tpy (2015)
11 WTE (Mass Burn) Status 2013 world MSW generating ~ 2 billion tons ~ 800 thermal WTE plants currently Operating in nearly 40 countries This is 12% vs 70% landfilled WTE expected to increase to 283 terawatt hours by 2022 from 221 in 2010 Global market for WTE technologies ~$6.2 billion in 2012 and grow to $29.2 billion by Source: Pike Research
12 Reliability is Important Mass burn combustion Consideration of availability is required for thermal destruction systems for foams & plastics
13 Gasification is making another effort ~ 26 waste gasification plants currently operating worldwide of which 5 are in the US. Global capacity = 3,483 tons of biomass and MSW per day (tpd) Syngas output is approximately MWth. 13 additional in construction/planning stages and are expected to add an additional 5,006 tpd of capacity and MWth output.. The majority of the existing plants were designed and constructed to produce a synthetic gas, consisting primarily of H2 and CO EnerChem/City of Edmonton Ethanol Covanta CLEERGAS gasification w/o pre-processing Totaling ~ 1.2 million tpy (metric)
14 Availability of Worldwide Installations Measured Estimated
15 Worldwide Unit Installations (boiler, gasifier, etc) Number of Units (logarithmic) Emissions from Gasification Systems Compound Range (approx) Units PM 1-18 mg/nm 7% O 2 HCl <5-55 mg/nm 7% O 2 NO x < mg/nm 7% O 2 SO x <1-50 mg/nm 7% O 2 Hg <0.008 mg/nm 7% O 2 Dioxins/furans ~0-0.1 ng TEQ/Nm 7% O 2
16 Representative Emissions for U.S. WTE Operational Facilities
17 Emission Comparison of Thermal Treatment Technologies Emissions from thermal conversion systems are similar
18 Recovery of materials from ash Values of one facility in Switzerland Nearly all recover metals and non-metals from ash residue 3,400 tons 440 tons 83% of the total economical potential/value comprised of seven metals: Au (26%), Sc (17%), Al (17%), Cu (11%), Ag (6%), Pt (4%), Nd (3%). Grams/ton Gold (Au) Au increase by ~100x solid waste concentration (0.4 mg/kg) non-ferrous fraction (40 mg/kg) economical level of mg/kg ore Bot. ash < 1 mm 1.5 tons 1.1 tons < 5 mm Source: Morf, L.S., et al. Waste Management (2012), dx.doi.org/ /j.wasman
19 Thermal Conversion Economic Summary Conventional WTE: Capital Cost: $70/ton + Labor: $10/ton + Operating: $30/ton = $110 - $130 per ton Similar for Energos enough operating experience yielding accurate economics Other systems do not have reliable operating experience Technology Energy (kwh/ton) Capital Costs ($/ton) InEnTec 530 ~77 (est) Alter NRG Europlasma Plasco Newer WTE Current WTE (US avg)
20 Alternative fuel (AF) usage in Cement Kilns US Average Everything is incorporated into product (no ash) CEMEX Alternative Fuel Usage Engineered fuel, tires and biomass 38.9% Jan April 2013 Avg US from , à 10%-15% Kiln 2 Apr- 13 Feb- 13 One Facility s status ~ 50% AF usage High Pet Coke replacement achieved Eng.Fuel Wood 19.6% 15.2% 18.5% 18.3% Tires 12.8% 12.2% Bottom Ash 1.9% 2.3% Pecan Shells 0.7% 0.6% Other Sum 0.0% 0.1% 53.5% 48.7%
21 EEC CCNY Much of this work is developed by students and research associates of the Earth Engineering Center The goal of EEC CCNY is to bring to bear rigorous engineering solutions that enable responsible use of energy and materials for the advancement of society. Through industry collaborations and research sponsorship EEC CCNY develops novel solutions to some of the world s most pressing problems. EEC CCNY routinely engages students with industry professionals enabling a holistic approach to creative realistic, forward-looking applications. The reach of EEC CCNY is international in scope with many projects connecting international students and companies with a global presence.